Transcription
82Organizational development through Business Intelligence and Data MiningOrganizational development through Business Intelligence and DataMiningDenis-Cătălin ARGHIR, Ioana-Gilia DUŞA, Miruna ONUŢĂThe Bucharest University of Economic Studies, Romaniaarghir.denis@gmail.com, ioanagd94@gmail.com, miruna.onuta@gmail.comThe article presents the concept of Business Intelligence and their influence on decisionmaking. Examining Business Intelligence systems was accomplished by theoreticallycomparing of four systems: Microsoft Power Bi, IBM Cognos, Oracle BI, and SAS, focusingon “functionality”, “performance”, “usage” and “cost” criteria. Functionality testing wasdone through the Power BI system using a HORECA industry dataset, namely a café retailer.On this dataset has been applied data mining concepts as cluster analysis, KNN classificationanalysis, and association study, to determine the frequently encountered templates, tocategorize buyers into various key categories, and to help the business thrive.Keyword: Business Intelligence, Power BI, Data Mining, Apriori Algorithm, Cluster Analysis,KNN Analysis.1IntroductionThe roots of the business intelligence(BI) concept dates back to the nineteenthcentury when the term BI was originallyinvented by Richard Millar Devens in thepaper “Encyclopaedia of Commercial andBusiness Anecdotes” published in 1865.According to Devens [1], the concept wasused to describe how Sir Henry Furnese'sbanker was able to make a profit byreceiving information about the bankingenvironment and how he acted before hiscompetitors.The capacity to collect information and toreact on the basis of these denotes theability showed by Furnese and whichunderlies the concept of BusinessIntelligence today.The next century's development expandedand refined business by first introducingthe term “Business Intelligence” in 1989by Howard Dresner from Gartner Group,which defined this concept, according to[2], as "a method of improving decisionmaking through the use of fact-basedsupport systems".Although it is related to enterpriseapplications, Business Intelligence is not aproduct or a system, it is a concept thatshelters architectures, applications, anddatabases. Its purpose is to access user’sdata from an organization as easy aspossible by interactive, in real-time accessof databases, and also manipulation andanalysis of them.By analysing historical data, BI performs avaluable insight into business activities andbusiness situations, and managers areactually assisted in making decisionsthrough essentials information, includingthose behavioural and of forecasting.In the current sense, this term denotes a setof concepts and methods used to improvethe quality of business decision-makingprocess and represents a platform forpresenting information in a correct, usefuland capable way to support the dailyactivities and decisions of every person inmanagement positions in order to choosethe most efficient alternatives.Business Intelligence is made up of a seriesof applications and technologies that helpgather, store, query, report, and analyselarge volumes of data, and provide accessto necessary data in company decisionmaking processes by obtaining analysesand reports.With today's BI solutions, managers cananalyse data directly without needing helpfrom IT staff and without waiting forcomplexreportstorun.Thisdemocratization of access to informationhelps users make informed decisions based
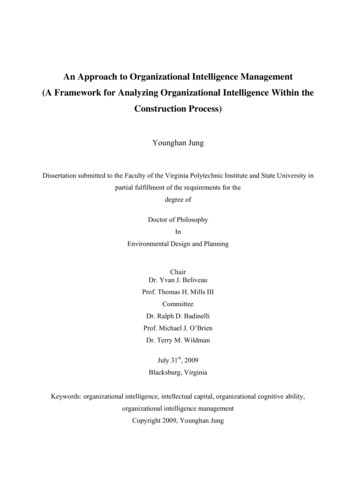
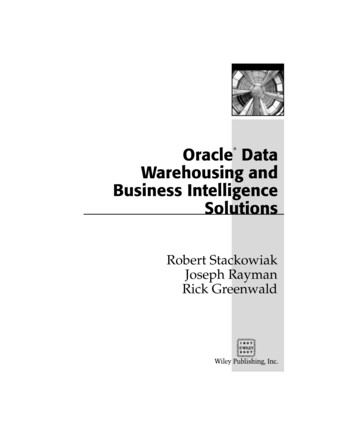
Database Systems Journal, vol. X/201983on concrete facts - not on suspicions andinstincts.2. Fields of application of BIThe effects of using a BI system arestunning, because it produces the neededinformation, at the time it is necessary,providing one of the prerequisites forbusiness success. BI is the art of knowingand harnessing information, gainingcompetitive advantages.BI can provide answers to the core issuesof an organization, helping it making gooddecisions to resolve it. Finding answers isbased on analysing and comparinghistorical data, both created within theorganization, and data from externalsources.The providing benefits of the BI system,unconcerned of the field of activity, arevaried, for example: a producer canquickly find out the need for materials, rawmaterials or stock based on past sales; asales manager can create more profitablesales plans following the evolution of theprevious period; a distributor can find outthe most profitable distribution channels; aservice provider has the possibility toanticipate and identify loyalty programs.3. The architecture of a BI systemThe architectural model of a BI system caninclude the following components: Data source - can be extracted fromvarious sources or systems, such asCustomer Relationship Management(CRM),EnterpriseResourcePlanning (ERP), relational databases,Excel spreadsheet files, CommaSeparated Values (CSV) or text files(TXT); Once the data has beenextracted from external sources andhas been transformed according tooperational needs, the data is loadedto achieve the final goal, this processis called Extract Transform Load(ETL); Data processing - once the data hasbeen loaded to the final target, either Data Warehouse or Data Mart can beprocessed, can be added a series ofnew data, can be maintained recordsin a form of data logging;Analysis and data presentation there are various analysis tools,analyses can be made usingapplications such as:o OLAP – useful for dynamic dataanalysis, fast access to a largeamount of data, synchronizationof data sources from multipledatabases, historical analysisbased on time series;o DATA MINING – useful foranalysing large data sets in ordertoidentifymodelsandrelationships for establishingfuture tendencies - clustering,association, classification;o DASHBOARD - useful for aquick view of performanceindicators relevant to a businessprocess.Fig. 1. The architecture diagram of a BIsystemIn a survey conducted in 2018 [3] on asample of 600 companies from variousindustriesinterestedinbusinessintelligence software, has been achievedthe top of the most wanted functionalities,which is as follows:
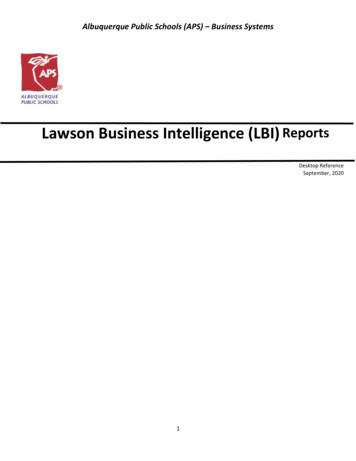
84Organizational development through Business Intelligence and Data Miningthe most used by companies are, accordingto [4]:Fig. 2. Top of the most wanted BI features4. Business Intelligence toolsBy using BI tools can be obtained usefulinformation that allows the user tounderstand at a glance the current state ofsome relevant business indicators. Thetools are varied and start from simplespreadsheets,OnlineAnalyticalProcessing (OLAP) - dynamic reportingsolutions that allow users to interact withcomplex structures as time series, datatrend; Dashboard systems; Data Mining –the process of extracting patterns from alarge volume of data by combiningstatistical and artificial intelligencemethods with those from databasemanagement; Decision Engineering –provides the framework that unites anumber of good practices for organizingdecision-making process; Data Warehouse- a data repository designed to facilitate anorganization's decision-making process;Process mining – extracting knowledgefrom events recorded by the informaticssystem; Exploratory Data Analysis (EDA)– the exploration of a data set, without astrong dependence on assumptions ormodels, the objective being to identifypatterns in an exploratory manner;Business performance management – is aset of managerial and analytical processesthat allow the performance management ofan organization to achieve one or morepurposes.Among the most popular tools can be listedMicrosoft BI & Excel, Oracle BI, IBMCognos, SAS, Qlik, Tableau, SAPBusiness Objects, and in terms ofaccessing business intelligence solutions,THE MOST USED BI TOOLSFig. 3. Most popular BI tools5. The purpose of using BusinessIntelligenceBusiness Intelligence has become astrategic tool to help a company to lead,optimize, discover and innovate to changethe landscape of its organization. BusinessIntelligence systems are useful to modernbusinesses because they have the ability toprovide a continuous flow of informationand the capabilities of such a system thatimplements the BI concept allowemployees: to align day-to-day operations withoverall goals and strategies; to identify and understand therelationshipsbetweenbusinessprocesses and their impact onperformance; to access relevant information foranalytical responsibilities specific forthe analysis; to analyse data from documents andto develop them very easily; to monitor vital business indicators,such as the current financial reports,the effectiveness, and profitability ofsales departments or other relevantmeasurement indicators.Business Intelligence represents the abilityof an organization to think, plan, predict,solveproblems,abstractthinking,understand, innovate, and learn in waysthat enhance organizational knowledge,inform in the decision-making process, to
Database Systems Journal, vol. X/2019allow effective actions and to helpestablish and achieve business goals. Therole of business intelligence is to create aninformational environment in whichoperationaldatacollectedfromtransactional systems and external sourcescan be analysed to discover strategicbusiness dimensions.This information should help organisationsto respond to business key issues, makepredictions, and act on real-time data toimprove the quality and speed of thedecision-making process.Expected benefits do not always his means that the development ofbusiness intelligence capabilities can onlyprovide information-based decisions, butthey cannot implement them.An analysis of the impact of businessintelligence should not focus on the impactat a given point in time, but it should belongitudinal to determine how and why itvaries over time. Similarly, to enterpriseresource planning systems, there are casestudies that have examined long-termsuccess or failure of business intelligence.On a more theoretical side, in order tosubstantiate business intelligence researchwithin the research information systems,rigorous preparation based on theory andimpact analysis is required.Given that the rapid evolution oftechnologies and managerial methods is asignificant challenge for theoreticians,most of the previous business intelligenceresearch has not had a theoreticalfoundation.In this analysis, the organizational theoryof information processing is used toanalyse how new business intelligencetechnologies can favourably enhanceinformation processing capabilities.Business intelligence clearly reducesdecision-makingriskanddirectsoperational and marketing activities togenerate real value and which can becapitalized, with minimal resources.85Business intelligence projects are notmeant to teach managers how to make theright decisions, but instead, help themmake decisions based on facts and figuresrather than assumptions.6. The elements that turn BI into aviable business solutionBy using a Business Intelligence solution,business people have access to current andquality information, highlighted in a visualand effective way.Many organizations implement businessintelligence systems, but their long-termimpact on the quality of the decisionmaking process and of the performanceconsequently varies greatly.An analysis of the factors that influence thecontinued use of these systems is requiredand is usually focused on the need forinformation processing in the continueduse of business information and the factorsthat influence these needs.Business complexity means, today, that acompany needs to perform regularlycomplex analysis with vast amounts ofdata.Many businesses are now implementingbusiness intelligence systems to get timelyinformation about organisational processesand company environments that combineinformation about past circumstances,present events and projected in futureactions to answer to questions that solvevarious problems.Business intelligence solutions have seenunprecedented growth over the pastdecade, and companies that offer themhave seen spectacular growth despite allthe vicissitudes of the economicenvironment.Functionalities offered to users havebecome increasingly varied covering awide range of needs ranging from simpletabular reports or graphical reports to theability to track the organization's mainperformance indicators in a synthetic andconcise manner.To the extent that Romanian companieswant to survive the pressure of European
86Organizational development through Business Intelligence and Data Miningcompetition,businessintelligencesolutions can provide them the necessarymeans to do this. The only remainingproblems are those related to the wish ofcompanies and those time-related becausethe market already has solutions for anybudget.The benefits of a business intelligencesystem are obvious - the analysts areoptimistic, showing that in the comingyears, millions of people will use day-today visual analysis tools and BI. Themarket is already saturated with the rangeof analytical applications available, whichcan carry out all sorts of analysis tosupport decision-making process at alllevels.Other benefits to be taken into account are: Reducing downtime spent withperiodicreportingactivities(collection of reports, consolidations,and various adjustments); Reducing time spent with repetitiveactivities; Reduce the role of the IT departmentin generating reports in favour of theend-user; Reduce the time needed to make adecision.Given that the decision will be even betterdocumented due to the quality of theinformation provided, we will finally beable to talk about an organization preparedto face any changes in the market, nomatter how abrupt they are.Fig. 4. Benefits provided by BI solutions7. The Influence of Business Intelligenceon Decision MakingInformation from business intelligenceneeds to be integrated into the businessprocess of an organization. This can beachieved by building a decision-makingsystem. The results obtained from thisbusiness information are used byoperational managers in the form ofrecommended actions. A prerequisitecondition for efficient use is theavailability of high-quality data, includinggood data management, covering: identifying users’ needs; unification of data; clearing data; improving data quality control.Most business intelligence initiatives havetherefore focused on developing a highquality business intelligence asset that isused instead of classical reporting systems.The value of Business Intelligence derivesfrom the ability to extract specific data andto adapt it from a variety of heterogeneoussources.Managing an enterprise requires efficientdata management in order to monitoractivities and to evaluate the performanceof different business processes.Nowadays, there are a number of changesin the world of analysis, even for the longterm, where BI is beginning to struggle toadapt to new trends. The information hasbecome a profit centre, and processes arenow customer-oriented, so business peopleto have a say about the mode in whichanalyses are predicted.With increasing expectations, BI systemsare looking to constantly improve theircapabilities, because the need for fasterdata processing has increased, especiallythat the most data are not in the internalsystem, companies using information fromoutside the BI environment of enterprises.8. Advantages of using BusinessIntelligence systemsAt this moment, the business environmenthas favoured the spreading of BIapplications. There are industries thatbudget big spending on technologypurchases and BI are more or less obviousinitiatives that lead to improved
Database Systems Journal, vol. X/2019profitability rates. Practically, theseapplications help to make wise decisions.BI applications allow the ability tosummarize and aggregate by specific anddetailed categories at the same time,specific to a particular analysis or process,presenting the exact information andexcluding the extra elements. Thus, adecision-makercanmonitortheperformance variables of a business.Example: sales per region, per product, perquarter, or product return rate for variousreasons, customer behaviour analysis basedon specific preference analysis. Possibility to retrieve data fromvarious computer systems and tocarry out a detailed analysis of themfor decision support; Identifying and adjusting defectiveprocesses, even modifying the logicof performing certain activities tomeet the company's efficiencyrequirements; Development of modules specificallydesignedforeverysinglerequirement; Permanently communication with allthe centres for accurate, up-to-dateand easy to follow reporting; The ability to develop DataWarehouse solutions that support themostdemandingreportingrequirements; Real-time updating of transactionaldata on which to build a decisionsupport system; A business BI system is simple,visual and easy to understand, givingcompanies the freedom to answerquestions immediately as they occur; The possibility of creating interactiveviews in just a few seconds evenwhen working with very largevolumes of information.87Fig. 5. Advantages of using BI systems [5]9. Comparison between BI toolsWe chose for comparison four BI tools,surprising different aspects (functionalities,performance, usage, costs) to find outwhich is the most suitable tool fororganisational development:Microsoft Power BIFUNCTIONALITIES-exposure: there are multiple versions:Power BI Desktop – on-premise version,Power BI service app.powerbi.com Software as a Service (SaaS) online versionand Power Bi Mobile - Android, iOS andWindows mobile device version;-interactivity: creates real-time reports,creates data analysis models, assures quality,reliability, and scalability of the ronment for build comprehensive andrelevant real-time reports with the possibilityof automatically updating them;-presentation: graphics - pie, column, line,matrix, Excel reports, dashboards;-data source: Excel spreadsheets, Access/SQL databases, XML files, flat text and CSVfiles;PERFORMANCE-data integration: creating relations betweentables of type “primary key” - “foreign key”;pivot operations;-data processing: data can be processed fromExcel spreadsheets or from a local database;USAGE-interface: depending on the type of versionyou are working with, data can be viewed asreports, custom dashboards, cubes - either inthe form of Mobile or Desktop;COSTS-moderate costs;IBM Cognos
88Organizational development through Business Intelligence and Data MiningFUNCTIONALITIES-exposure: various tools: Report Studio(interactive and complex report developertool), Query Studio (simple query and reportcreation tool), Analysis Studio (multidimensional analysis tool that provides drag& drop functionalities for exploration,analysis and comparing large data in a veryshort time);-interactivity: allows filtering, ing values into graphs and charts;-modelling:providesasupportiveenvironment for planning, budgeting, makingforecasts and reliable plans in a short time;-presentation: export into images, Excel,PPT, PDF;-data source: Excel spreadsheets, XML files,flat text and CSV scan be joined using SQL commands;-data processing: data is delivered fromcubes to memory for improved performance;USAGE-interface: provides a web-based architecturewith advanced creative capabilities; thedashboard allows desktop customization andaccess to content;COSTS-lower costs than other traditional BIproducts;interface, allows the creation of basic queriesand reports;COSTS-high costs;SASFUNCTIONALITIES-exposure: various visualization capabilitiesimplemented in the product suite, interfacethat allows interaction with charts;-interactivity: users interact with a dashboard- Dashboard Builder;By comparing the four tools, we'vedecided to look in-depth on the features of“Power BI”-a collection of softwareservices, applications and connectors thatwork together to transform unrelated datasources into a coherent and interactiveperspective.It is a simple and fast system able to createcomplex analyses based on various datasources, whether simple flat files like textor CSV, Excel spreadsheets or localdatabases.Robust and high-quality for organizations,ready for extensive modelling and realtime analysis as well as personalizeddevelopment, Power BI enables users toeasily connect to data sources, visualizeand discover what is important for thecommon good of the business. It can also-modelling: interaction with predefinedalgorithms and pre-built models formodelling datasets;-presentation: export as Excel files, TSV(Tab-Separated Values), CSV etc.;-data source: SAS datasets, Microsoft Excelspreadsheets, flat text or CSV files;PERFORMANCE-data integration: administration of serverbased libraries;-data processing: is achieved either on thelocal unit or on the server;USAGE-interface: interactive, web-based reportingORACLE BIFUNCTIONALITIES-exposure: multiple view capabilities-basiccharts, intuitive reports, diagrams;-interactivity: allows filtering, creatinginteractive ons for dedicated financial planning;-presentation: export to PDF, RTF, XML,HTML, Excel and other formats;-data source: supported file types aredatabase files, XML flow, HTTP, Webservices, Oracle BI analysis, OLAP MANCE-data integration: it is created using SQLcommands based on table and columnqueries; they are specified as well as relationsbetween them;-data processing: in-memory processing;USAGE-interface: web-based interface, easy to usefor creating reports, with Template Builderfunctionality;COSTS-high prices for large configurations;
Database Systems Journal, vol. X/2019serve as an engine for analysis anddecision-making for group, divisions, orentire corporations projects. More andmore companies from Romania use thistool to monitor business status usingdashboards that process data in real time.The primary reason for choosing this toolis that it offers the ability to work both incloud and on-premise, that it can easilybuild robust and reusable models usingavailable data, ensuring consistencybetween reporting and analysis within theorganization, and with the Power BI webversion and it can distribute various reportsin just a few seconds across theorganization's departments.Also, an important feature that hasconvinced companies in Romania to adoptthis tool is the existence of the Mobileversion, so managers, the end-users, canhave a view of the data anywhere and atany time. They can view custom reportsand dashboard, find important informationin a due time, and act immediately toreassess situations.Fig. 6. Power BI Workflow10. Case StudyConcluding that Power BI is a very usefultool for Business Intelligence analyses,we've decided to test some of the availablefunctionalities on a specific dataset.The analysed data is a test one and wasextracted from „UCI Machine LearningRepository” (archive.ics.uci.edu [6]), awebsite that includes a structured databasein various fields across the globe, withvarying sizes indicators and instances,classified on different tasks for which canbe used, including data mining , etc. We chose to studyHORECA industry data, from a retailer,89namely a coffee shop selling “Delicacies”products.Why did we choose this data?We took the data to apply businessintelligence analyses, but also of datamining algorithms such as cluster analysis,KNNclassificationanalysisandassociation study to extract from thedataset the most relevant information thatcould be used in the business environment,such as grouping data in smaller clusters inorder to be able to analyse them as closelyas possible, to predict the affiliation ofcertain classes of a test set, starting fromthe training set, and to track consumerbehaviour on consumption of a particularcategory of products, in our analysis "Delicacies", by applying different filtersto see how a product sale may beinfluenced by another product or a mix ofproducts.After identifying and determining thepurpose of the analysis, we imported thedata we wanted in comma-separated values(CSV) format into the Power BI tool,assigning data types for each variablebased on the data content.-Association study: The submitted data foranalysisare"Delicacies"productsmarketed by a café from the HORECAchain (Hotels - Restaurants - Cafes/Coffee Shops).For the association study, we used the“Apriori” algorithm. According to [7], byassociation study, it is desirable todetermineconsumers'consumptionbehaviours to find interesting andfrequently encountered templates thatcould help the business to earn more.Fig. 7. Steps for implementing analysis
90Organizational development through Business Intelligence and Data MiningAfter understanding the need of applyingthe study and collecting the datasets, weswitched to processing them, so, using theBI tool -we concatenated (Merge) theproduct type with the main ingredient; -wegrouped the data set by the order id; -wetransformed the new table, containing theproducts grouped by the order id, in acustomized list column, with the sequence:(Table.Column ([Data], ”Product”); -thelist we distributed on the columns (Split)after the delimiter ";" in order to be able toapply the association rules analysis.To exemplify on a demonstration dataset,we chose 4 purchases made by coffee shopcustomers:orders;Using the previous formula on the samedataset, it appears that in the case of thecombinationof"Tartă-Coacăze"(Blueberries Tart) and "Apă-Plată" (Noncarbonated Mineral Water) there is afrequency of 2 appearances in the fourorders analysed, resulting a support of 0.5,meaning that 50% of purchases containedthe 2 products.(1)In order to determine the ratio between thenumber of customers who buy items thatappear as a rule and the number of buyersof the items that appear in the antecedent,will be calculated with another feature ofthe association rule - confidence:Fig. 8. Test data for the association study(2)By distributing the products purchased byeach of our 4 customers in table form, weobtained the frequency of purchasedproducts:Table 1. Frequency of purchased 0125%To determine the percentage of how oftenitems appear together in a total oftransactions, we calculated the supportlevel, one of the features of the associationrule:(3)(4)(5)We can say, according to (4), that in 60%of the cases, the buyer who bought “ApăPlată” also bought “Tartă-Coacăze”, andaccording to (5), 100% of the cases “TartăCoacăze” were bought together with “ApăPlată”.To see to what extent the association ruleis useful, we will calculate the degree ofimprovement - lift:(6)(7)Where:o X the frequency of occurrence ofarticles (products);o N total number of transactions/We can say that both rules are relevant,since they exceed the unit value.To apply the association algorithm acrossthe dataset, we used the R scripting
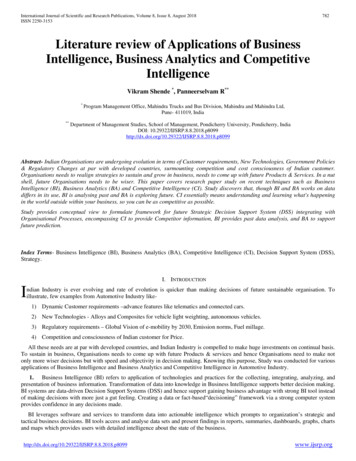
Database Systems Journal, vol. X/2019functionality within Power BI Desktop asfollows:Having the set called “dataset” as an input,we transform it as transactions by applyingthe "Apriori" function to find associationrules, providing the minimum support andtrust levels as parameters.The first 100 results we recorded in avariable called "output", which is the resultof the query.91With “Forced-Directed Graph 2.0.2”visualization mode in Power BI, togetherwith the "Slicer" filter, we represented inan interactive way the relationshipsbetween the main and the related nodes,the link thickness representing the value ofthe support, with the possibility ofselection from the drop-down list the mainor associated products.Fig. 9. The R script for obtaining theassociationsThus, the result of the query is generated inPower BI in tabular format and it can beobserved the newly generated columns:“lhs” (the primary product purchased),“rhs” (the associated purchase product) andcolumns “support”, “confidence”, “lift”(degree of improvement) and “count”(number of appearances of combinations).Fig. 11. Representation of associations as agraph (Forced-Directed Graph)Forexample,wehaveselectedcombinations of main product kies) and resulted in the followinggraph, where can be viewed at a glancewhich are the most preferred customercombinations of products (the most thickerlines):Fig. 12. Extracting all combinations ofpurchases that have associated the product„Fursecuri-Zmeură”Fig. 10. Output – the result of Apriorialgorithm applicationThe strongest link, in the sense of thehighest support, is in the case of thecombination “Suc-Lămâie” (Lemon-Juice)associated with “Fursecuri-Zmeură” with asupport level of 0,03, meaning that 3% of
92Organizational development through Business Intelligence and Data Miningthe purchases (31 purchases) contained the2 products.Fig. 13. Detailing the relationship with thehighest support level 0,03% „Suc-Lămâie”associated with „Fursecuri-Zmeură”Another representation can be made usingthe "R script visual" view:Fig. 14. R script for obtaining a scatterplotrepresentationThus, the three dimensions - “support”,“confidence” and “lift” can be viewed in asingle graph that can be detailed with asimple click:liftFig. 15. Scatter-plot representation forproductassociations(support,confidence and lift)Following the association study, themanagement of the unit can createpromotional packages that could havepositive results in increasing sales of"Delicacies" products.It follows the use of another data mininganalysis that is applicable to businessintelligence:-Cluster Analysis: According to [8] thepurpose of clustering occurs from the needto fit, group or classify certain entities orobjects in the form of categories or classes,of which deli
Keyword: Business Intelligence, Power BI, Data Mining, Apriori Algorithm, Cluster Analysis, KNN Analysis. 1 Introduction The roots of the business intelligence (BI) concept dates back to the nineteenth century when the term BI was originally invented by Richard Millar Devens in the paper "Encyclopaedia of Commercial and