Transcription
White PaperPharmaceutical Analysis using FTIR:Compliance with European, US, Indian,and Japanese PharmacopoeiaMeeting the requirements of global pharmacopoeiawith the Agilent Cary 630 FTIRIntroductionFourier transform infrared (FTIR) spectroscopy is a commonly used technique in thepharmaceutical industry. FTIR spectroscopy is often used for quality assurance /quality control (QA/QC) of pharmaceutical substances and material identification.The Agilent Cary 630 FTIR spectrometer incorporates ease-of-use, reliability, andflexible sampling accessories in a highly compact system with class-leadingperformance. Designed to meet the requirements of a regulated pharmaceuticalenvironment, it is ideal for routine measurements such as analyzing, characterizing,and verifying raw materials and ingredients.The Cary 630 FTIR spectrometer has a modular design. This design allows theinstrument to be reconfigured with permanently aligned sample modules for thedifferent samples and applications. Modules are simply attached to the front ofthe Cary 630 FTIR engines, available with either KBr or ZnSe optics, and can beexchanged in seconds.Several pharmacopeias describe how FTIR spectrometer performance is verified todemonstrate suitability for the intended operational range of analysis.This white paper demonstrates how Agilent Cary 630 FTIR instruments (withKBr and ZnSe optics) can be verified as meeting the performance requirementsof the European, US, Indian, and Japanese Pharmacopoeia. Where applicable,the instruments were verified for transmission and ATR measurement mode asspecified in the respective pharmacopeia.
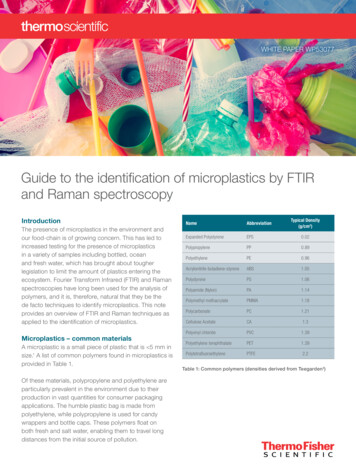
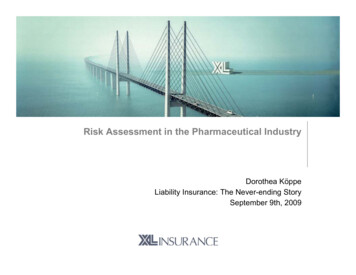
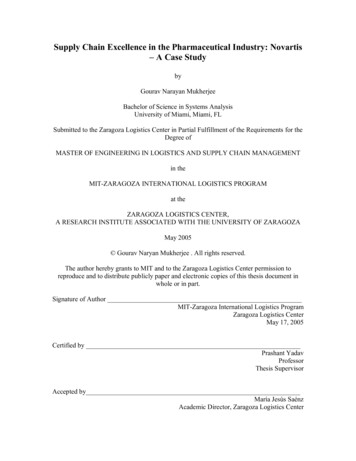
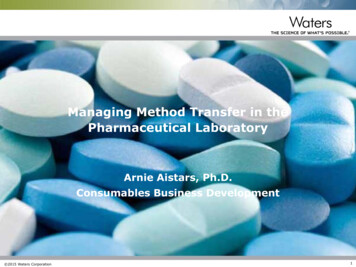
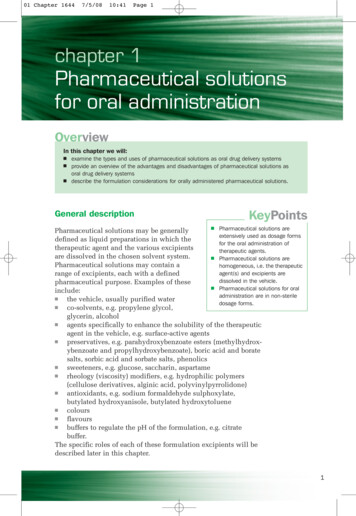
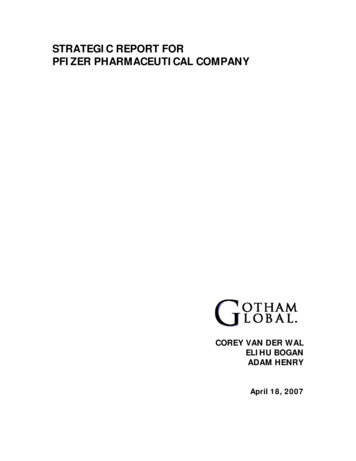
The following sampling modules can be used fortransmission measurement mode tests:The MicroLab software suite consists of fourworkflow-focused software applications: Cary 630 Transmission Module (used in this white paper) Cary 630 DialPath ModulesMicroLab PC: Method-driven software to collect andanalyze data using predefined methods Cary 630 TumblIR Module MicroLab Light: Software for offline review and analysisof FTIR data MicroLab OQ: Automated Operational Qualification (OQ)software. Can be used to routinely verify instrumentperformance MicroLab Quant: Software for the development andverification of quantification modelsThe following sampling modules can be used for ATRmeasurement mode tests: Cary 630 Diamond ATR Module (used in this white paper) Cary 630 ZnSe ATR Module Cary 630 Ge ATR ModuleControl of instrument performanceControl of instrument performance is a critical aspect inqualifying the instrument suitability for the intended analysisto be performed. Spectral resolution and wavenumberaccuracy are the performance parameters that are describedin most pharmacopeia, sometimes using slightly divergingterminology. These parameters are checked using suitablereference materials.All Pharmacopeias referenced here recommend the use of aNIST SRM 1921b traceable polystyrene film of approximately35 µm thickness (available from Agilent: p/n: 925-0128).Spectral resolutionPassing the spectral resolution test confirms the resolvingpower of the system. This parameter is measured to ensurethat closely observed bands can be resolved.Wavenumber accuracyPassing the wavenumber accuracy test ensures that thewavenumber axis of the collected IR spectrum is accuratewithin acceptable limits across the intended operationalrange. The test is usually done by recording the spectrum ofa suitable reference material. The wavenumbers of maximumresponse are then compared with the known band positionsof the standard, as given in the respective pharmacopeia.Further pharmacopeia-specific performance requirementswill be discussed in the respective sections.Instrument performance check using MicroLab softwareThe Agilent MicroLab software suite is easy-to-use softwarethat is provided with all Cary 630 FTIR spectrometers.Step-by-step guidance using instructive pictures and anintuitive software design allow easy navigation through theentire workflow.2MicroLab Pharma is an optional software package for theCary 630 FTIR. The software supports users in regulatedenvironments, providing tools to help achieve compliancewith electronic record regulations such as 21 CFR Part 11 andEU Annex 11.The following section describes how MicroLab OQ andMicroLab PC can be used verify the Cary 630 FTIR instrumentperformance.Instrument performance check using MicroLabOQ softwareMicroLab OQ allows users to easily perform spectralresolution and wavenumber accuracy tests (called “LaserFrequency Calibration Check” and “Spectral Resolution Check”in MicroLab OQ). In addition, the software can be used toperform signal-to-noise and stability tests, which are not partof the international pharmacopeias’ requirements. MicroLabOQ has an intuitive pictorial interface, which guides the userthrough the qualification process (Figure 1) as follows:1.Select the Cary 630 FTIR modules to be verified. Thesoftware automatically recognizes the module attachedto the engine.2.An automatic diagnostic system check examines thehealth condition of the instrument.3.The list of available tests is displayed. Select the tests tobe performed and adjust the settings if required.4.The software navigates the user through the entire testprocedure with step-by-step guidance using instructivepictures.MicroLab OQ software generates a PDF report showing thediagnostic values, the test results, and the specifications forthe tests and pass/fail criteria for future reference (Figure 2).
Figure 1. MicroLab OQ software guides users to perform instrument qualification through simple and easy steps.Cary 630 OQOperational QualificationThis Report was generated under a 21 CFR 11 EnvironmentSystem InformationPC/Workstation ID: DESKTOP-ENM90U7Software Version: MicroLab PC(21CFR11): 5.6.2135.0Firmware: 1.96.00.0Serial Number: MY15030059Reporting InformationGenerated By: New group\New project\userGenerated Date: 9/11/2020 9:05 PMGenerated GMT Date: 9/12/2020 5:05 AMUserName:Engine Optics:Sampling Module:Qual Date/Time:Filename of Report:Filename of Data:New group\New project\userZnSeTransmission Cell9/11/2020 9:05 2020-09-11T09-05-07.pdfDESKTOP-ENM90U7\SQLEXPRESS VAIMDB Public(000) rialNumber:Sampling Module:Gain:Energy Level:Transmission Cell (Primary)11290011Transmission Cell19830194Spectral Resolution TestNumber of Runs: 5Absorption maximum at:Absorption minimum at:Measured Difference (Abs):Specified Difference (Abs):2850.50 cm-12872.00 cm-10.46 0.33Absorption maximum at:Absorption minimum at:Measured Difference (Abs):Specified Difference (Abs):1585.00 cm-11591.50 cm-10.11 0.08Signal To Noise TestNumber of Tests: 15Specification @ 1142-1042: 25000Measured Value: 26631Stability TestNumber of Minutes: 30Specification: 1%Measured Deviation: 0.026%Wavenumber Accuracy TestNumber of Runs: 5Spec. Wavenumber:Measured:Spec. Accuracy:Measured Accuracy:Spec. Repeatability:Measured Repeatability:906.6906.6 1.00.0 0.050.011028.31028.2 1.00.1 0.050.001154.51154.4 1.00.1 0.050.00Spec. Wavenumber:Measured:Spec. Accuracy:Measured Accuracy:Spec. Repeatability:Measured Repeatability:1601.21600.9 1.00.3 0.050.012849.52849.6 1.00.1 0.050.003060.03059.8 1.00.2 0.050.011583.01582.9 1.00.1 0.050.01E-Signature«« Validated comment »»Authority: SignAuthorization ID {CB92826F-B684-4BC3-808DB852A71F}Local Date & Time: 9/9/2020 11:22:37 PMGMT Date & Time: 9/10/2020 6:22:37 AMApplication: MicroLab IQ/OQWorkstation Name: DESKTOPENM90U7User: New group\New project\userUser Name: userUser Description:Instrument Serial Number: MY15030059«« Validated comment »»Figure 2. Operational Qualification (OQ) report generated using MicroLab OQ under MicroLab Pharma. Results are reported with all test parametersalong with easy to ready pass/fail results.3
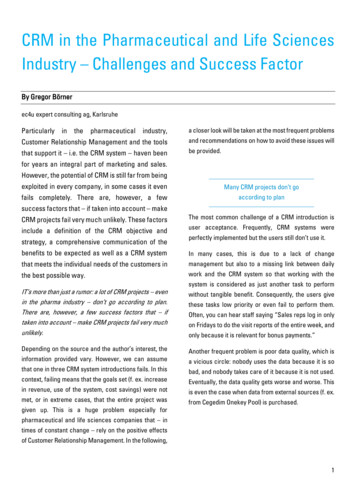
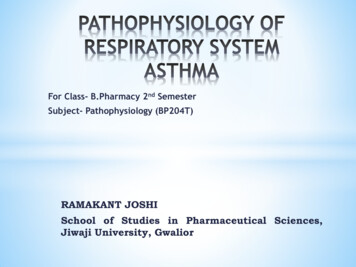
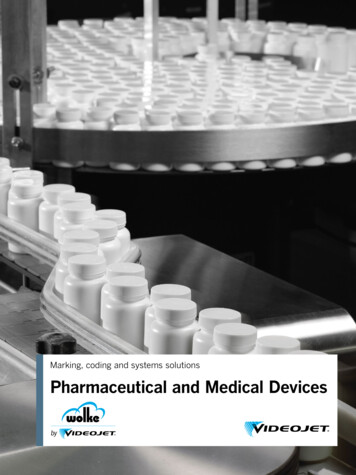
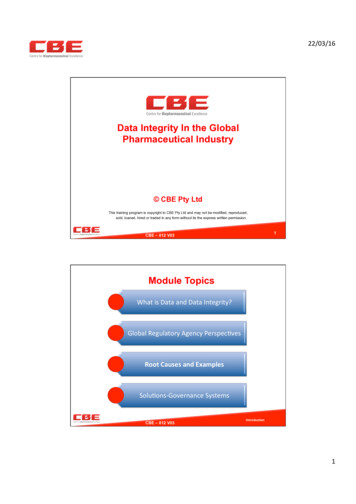
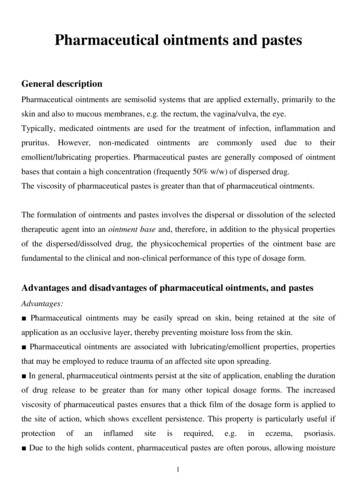
Instrument performance check using MicroLab PCMicroLab OQ software may not cover some pharmacopeiatests and limits. When this is the case, MicroLab PC can beused to verify the instrument performance. MicroLab PC is amethod-driven software that uses the samepicture-guidance as MicroLab OQ to help users through allsteps of the analysis.A selection of widely applicable methods for wavenumberaccuracy and spectral resolution are preinstalled with theMicroLab software. These methods can be used as is orcustomized to verify instrument performance according tothe global pharmacopeia requirements.A color-coded result view, and automatic PDF report (fullycustomizable) generation are provided at the completionof each test (Figure 3). The result screen can be customizedas required (Figure 4).Figure 3. Examples of customized spectral resolution test methods following Ph. Eur. The method can be customized to show (A) a pass/fail indication alongwith the tolerance limits for the test, (B) a combination of both result values along with the tolerance limits for the test, or alternatively, (C) a combination of bothpass/fail indication and result values along with the tolerance limits for the test. Color-coding (green), indicates a pass value.E-SignatureTest SummaryAll resolution test measurements are within acceptable limitsSignatureCary 630 FTIRTest DetailsInstrument QualificationTest descriptionTest 1 - Difference between absorption minima at 2870 cm-1 andabsorption maxima at 2849.5 cm-1 ( 0.33)Resolution Test 1 Overall ResultTest 2 - Difference between absorption minima at 1589 cm-1 andabsorption maxima at 1583 cm-1 ( 0.08)Resolution Test 2 Overall Resultacc. to European Pharmacopeia Chapter (2.2.24)«« Validated comment »» Signed Authority: Sign Authorization ID {D602C2B4-07FB-4CCEB943-48330815E0CC}Local Date & Time: 9/9/2020 11:22:37 PM GMT Date & Time: 9/10/2020 6:22:37 AM Application: MicroLab PCWorkstation Name: DESKTOPENM90U7 User: New group\New project\user User Name: user User Description:Instrument Serial Number: MY15030059 «« Validated comment »»Test Results0.45Pass0.11PassSPECTRAL RESOLUTIONThis Report was generated under a 21 CFR 11 EnvironmentSystem Information:PC/Workstation ID:Software Version:Firmware:Serial Number:DESKTOP-ENM90U7MicroLab PC(21CFR11): 5.6.2135.01.96.00.0MY15030059Reporting Information:Generated By:User Name:Generated Date:Generated GMT Date:New group\New 020-09-10T06:22:37.4975161-07:00Data InformationFilename of Method:Developer Name:Method CommentsFilename of Result:Result File Date:9/9/2020 11:22:39 PMDESKTOP-ENM90U7\SQLEXPRESS VAIMDB SystemCheckMethods(000) PublicMethods\ EP TransRes Poly Test Rev04.a2mAgilent TechnologiesEuropean Pharmacopoeia compliance testing method using a nominally 35-38 µmpolystyrene film. This is a transmission accessory test method intended for theDialPath, TumblIR, or Transmission modules.DESKTOP-ENM90U7\SQLEXPRESS VAIMDB Public(000) Public Results\SpectralResolution sample 00page 1 of 39/9/2020 11:22:39 PMpage 2 of 39/9/2020 11:22:39 PMFigure 4. A PDF report is automatically generated following the completion of a test. The report is fully customizable to report the relevant informationand test details. The shown report has been created from the method example C in Figure 3.4page 3 of 3
European Pharmacopeia (Ph. Eur.)Requirements for IR spectrometer performance are outlinedin Chapter (2.2.24) of the Ph. Eur. The chapter describes theperformance parameters that must be verified to qualifythe Cary 630 FTIR spectrometers. These parameters areWavenumber Scale (equivalent to wavenumber accuracy)and Spectral Resolution. Chapter 2.2.24 specifies the testprocedure for transmission and ATR measurement mode.The MicroLab OQ software can be used to evaluatethe performance of Cary 630 FTIR spectrometers (intransmission and ATR measurement mode) in accordance tothe Ph. Eur. requirements (number of runs set to “1” for bothtests).Transmission measurement modePassing the “Laser Frequency Calibration Check”( Wavenumber Scale) and the “Spectral Resolution Check”in the MicroLab OQ software indicates that the instrumentis performing to Ph. Eur. specifications. Table 1 shows thetest parameters, their limits for transmission measurementmode as well as the test outcome for two Cary 630 FTIRinstruments. Figure 5 shows the automatically created PDFreport for the Cary 630 FTIR with ZnSe optics. Extra bands aretested under the “Laser Frequency Calibration Check” that arenot required by the Ph. Eur.Figure 5. Extract from the Operational Qualification (OQ) report generated byMicroLab OQ. It verifies that the Cary 630 FTIR with ZnSe optics operated intransmission measurement mode met the Ph. Eur. requirements. Results arereported with all test parameters along with easy to ready pass/fail results.Table 1. Ph. Eur. system verification test descriptions and test limits as well as the test outcome for the two tested Cary 630 FTIR instruments in transmissionmeasurement mode.ResultsTest description and limitsCary 630 with KBr opticsCary 630 with ZnSe optics PassPassWavenumber ScalePosition of band maxima of polystyrene film906.6 cm-11028.3 cm-11601.2 cm-13060.0 cm-1 1.0 cm-1Spectral ResolutionDifference between the absorbance values at:the absorption minimum at 2870 cm-1 and the absorption maximum at 2849.5 cm-1. 0.33the absorption minimum at 1589 cm and the absorption maximum at 1583 cm . 0.33-1-1OverallVerificationResult5
Table 2. Ph. Eur. system verification test descriptions and test limits as well as the test outcome for the two tested Cary 630 FTIR instruments in ATRmeasurement mode.ResultsTest description and limitsCary 630 with KBr opticsCary 630 with ZnSe optics PassPassWavenumber ScalePosition of band maxima of polystyrene film906.1 cm-11027.7 cm-11601.0 cm-13059.7 cm-1 1.0 cm-1Spectral Resolution*Ratio between absorbance value at:absorption maximum at 2850 cm-1 and absorbance value at 2870.0 cm-1 1.15absorption maximum at 1601.0 cm-1 and absorbance value at 1589.0 cm-1 1.30Ov
Introduction. Fourier transform infrared (FTIR) spectroscopy is a commonly used technique in the pharmaceutical industry. FTIR spectroscopy is often used for quality assurance / quality control (QA/QC) of pharmaceutical substances and material identification. The Agilent Cary 630 FTIR spectrometer incorporates ease-of-use, reliability, and flexible .