Transcription
Civitas: Institute for the Study of Civil Society, First Floor, 55 Tufton Street, Westminster,London, SW1P 3QL. Email: info@civitas.org.ukAn independent appraisal of the NHS Workforce Race Equality StandardRichard NorrieDecember 2021ContentsIntroduction . 2Background . 2Methodological critique . 5Unrealistic expectations. 14Flawed evaluation . 17Responsibility . 18Oversight . 20‘WRES Experts’ . 23Awards and attempts at self-criticism . 24Cause for conflict . 26Reputational damage . 30A programme for work, endless work . 31Conclusion . 33Recommendations . 34Appendix . 351
About the author:Richard Norrie joined Civitas in 2020 and is Director of the Statistics and Policy ResearchProgramme.IntroductionThe NHS seeks to monitor and control diversity and equality through a programme knownas the Workforce Race Equality Standard (WRES). This is based on a series of statisticalindicators pertaining to outcomes between white and non-white minority groups. However,close inspection of them reveals they do not withstand methodological scrutiny. Theimplication of this is that the NHS creates a rod for its own back, while misdirectingresources and talent away from where they are best needed and served. WRES is thecreation of a cohort of ideologically-minded individuals who benefit from the programme,while the costs are left to patients and the taxpayer. Ultimately, this means money is wastedand not spent on improving health.BackgroundThere are nine indicators which are summarised in the table below, along with their scoresfor the last five years, this being the full range of available data.NHS commissioners and healthcare providers have been contractually obliged to implementWRES since 2015, as have independent healthcare providers and contractors wishing to dobusiness with the NHS, from 2017. This is important in that bureaucratic costs are imposedon both state and private sectors.According to its stated aims,‘NHS providers are expected to show progress against a number of indicators ofworkforce equality, including a specific indicator to address the low numbers of BMEboard members across the organisation’.1Bespoke targets are to be set against which progress is measured. Failure to comply willresult in ‘ whether regulators judge them to be “well led”.’2The most recent WRES report offers some positive findings: 1The share of very senior management in NHS trusts has risen from 5.4 per centto 6.8 per cent, since 2016;The share of trust board members has risen from seven to 10 per cent ers/3.2%20Workforce%20race%20equalty%20standard 0.pdf2
The relative likelihood of BME staff entering the disciplinary process is at a fiveyear low;‘the relative likelihood of BME staff accessing non-mandatory training is at thelowest level since this data collection began’.That last claim does not appear to be true, judging by the table below. Furthermore, eightout of nine indicators show no signs of meaningful change or improvement, once youallow for growth in the minority share of workforce overall, when judging presence at thevery top (WRES 1, 9). It is however not true to say that five years’ worth of data aresufficient to ‘take a long-term view of race equality’.3 Five years is not long-term; we knownothing of what happened 10 or 20 years before, necessary to properly ground ourjudgement of change.It is claimed, ‘Although we have made much progress we still have a long way to go’. Thisis one of the clichés of the genre, along with talk of ‘shining spotlights’, ‘shifting the dial’,and ‘holding up a 020report.pdf4Ibid.3
Table 1: WRES indicators – across all NHS trustsIndicator12Comparison of percentage ofBME staff at very seniormanagement compared tooverallRelative likelihood of whiteapplicants being appointed fromshortlists across all postscompared to BME 9%19.7%21.0%Very senior Relative likelihood of BME staffentering the formal disciplinaryprocess compared to white staff1.561.371.241.221.164Relative likelihood of white staffaccessing non-mandatorytraining and continuousprofessional development (CPD)compared to BME staff1.111.221.151.151.145Percentage of staff experiencingharassment, bullying or abusefrom patients, relatives or thepublic in the last 12 0.0%6789Percentage of staff experiencingharassment, bullying or abusefrom staff in the last 12 monthsPercentage of staff believingthat trust provides equalopportunities for careerprogression or promotionPercentage of staff personallyexperiencing discrimination atwork from a manger/teamleader or other colleaguesBME board membershipSource: NHS WRES.4
Official documentation reveals the purpose of WRES:‘It is intended that the metrics would encourage or oblige organisations to conductroot cause analyses as to the causes of the inequality that exists with the intention ofdriving change, rather than just compliance with the metrics. In so doingorganisations would draw on best practice around the NHS and beyond.’ 5Once the data are published, healthcare providers are expected to draw up plans to bringabout equality of outcomes based on input from the WRES team. Its latest report, however,reveals WRES has no clear idea of what will work, ex ante; instead, it is intended that WRESwill learn through trial and error, so that it will ‘become a vibrant library both of data and ofactions to help move the dial of long-standing racial inequality’.6Importantly, the NHS feels obliged to enact this programme under the ‘Public SectorEquality Duty’ of the Equality Act 2010.7 Many diversity and inclusion schemes are justifiedor even compelled by this duty. This came into force in 2011 and compels public authoritiesto ‘eliminate’ discrimination, advance equality of opportunity, and foster ‘good relations’.Significantly for our story, the duty compels public authorities to publish ‘equalityobjectives’ at least every four years and ‘information to demonstrate their compliance’.Note also that the duty makes no mention of equality of outcomes, only that is how it isbeing interpreted by many, including within the NHS.8Methodological critiqueWhat commences is an inspection of the WRES indicators, grouped according to theirsimilarities.Indicators 1 and 9Both of these indicators look to compare the BME (black and minority ethnic) shares in elitepositions to those of the workforce overall. Percentages are calculated for the BME share of‘very senior management’ and boards. ‘Very senior management’ is defined as chiefexecutives, executive directors, and other senior managers. Figures are produced both forthe NHS as a whole and for individual healthcare providers (NHS trusts).The first problem is that it appears WRES is including in the denominator all those for whomthere is no data on their ethnicity – the ‘unknowns’. What this means is that headlinefigures of 6.8 per cent (WRES 1) and 10 per cent (WRES 9) are to be interpreted as ublic-sector-equality-duty65
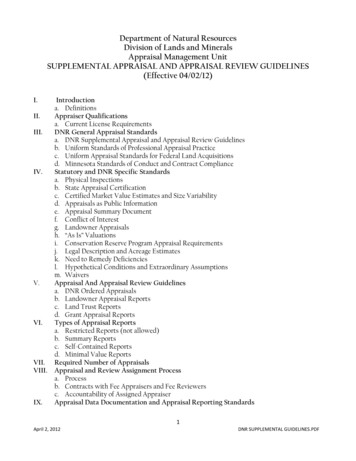
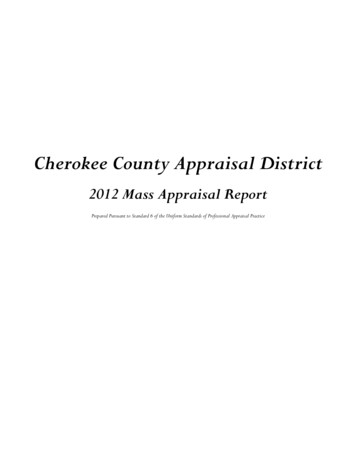
minimum BME share, meaning the actual figures are at least 6.8 and 10 per cent,respectively.The NHS has set a target of 19 per cent BME across all its pay bands.9 The problem is thatdue to the level of unknown data, it may underestimate what is actually there. Overall, theshares of unknowns are low, but this is more of a problem in individual trusts. For example,at Guy’s and St Thomas’ NHS Foundation Trust, zero per cent of very senior management isBME but 18.6 per cent are ‘unknown’.The next issue is the appropriateness of the comparison. It is reasonable to expect seniormanagement to deviate from the workforce overall since we are not comparing like withlike. Senior managers have a unique skill set, while the NHS staff overall includes doctorsand nurses, as well as caterers and cleaners. Each occupation has its own unique route in,with many staff recruited from overseas to fill jobs that are undesired by those already here.Such people are not likely candidates for positions of leadership. Moreover, there isobviously especial prestige placed on medical careers among Asians, with 30.2 per cent ofsenior doctors being Asian.10 Doctors are often precluded from being ‘very senior’ managersby their skill-set, since they are not trained administrators. Differences in the average agebetween groups may also have an impact, since it is known ethnic minority groups tend tobe younger, while positions of seniority go naturally to those who are older.Instead, we need to take into account the ethnic minority share of people likely to be inpositions of leadership. A target of 19 per cent, evenly imposed across the hierarchy of theNHS, will likely not be appropriate, given the variation in many variables between groups.A better benchmark for leadership, as suggested by Policy Exchange, is the share of ethnicminority individuals leaving Russell Group universities at the turn of the century, put ataround nine to 10 per cent, since these are natural candidates for leadership, who shouldhave made it to the top by now.11 Against this benchmark, NHS boards are alreadysufficiently ethnically diverse, while very senior management is not too far off. In fact, themost recent data put NHS senior management at 10 per cent BME, falling to seven per centat ‘very senior’ level.12 This latter figure is in line with the share of the senior civil service,which in turn is in line with those entering the civil service fast stream in the late 1990s andearly loads/2016/11/PEXJ5011 Bittersweet Success 1116 ent data/file/767789/Civil Service Fast Stream Annual Report 2017 - 2018.pdf;6
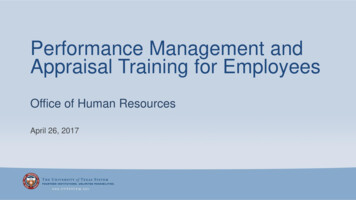
Figure 1: Benchmarking diversity among NHS very senior management – non-white share10.0%8.0%7%6.8%6.0%6.0%4.0%2.0%0.0%1998-2002 averagefaststream appointment2019 Senior Civil ServiceNHS Very SeniorManagementSource: Official Statistics/NHS WRES.Similarly, if we look at diversity among doctors, then we see the most senior positions areboth more diverse relative to the national population, as well as in line with the shares ofethnic minority individuals that entered the profession at the turn of the century. Thisimplies diversity of leadership in line with the historic supply of likely candidates forpositions of responsibility.Figure 2: Benchmarking diversity among doctors – percentage O/FoundationSpecialityConsultant 2009Year1 ave. 1999- registrar 200904Census 2011 Consultant 2019Source: NHS Digital/Policy ointments-data-report-2018197
There is a wider objection, one that can be made to all WRES indicators, in that by focusingon ‘BME’ alone, it obscures differences between minority groups. For instance, a seven percent figure for very senior management hides the fact that this includes four per cent Asian,one per cent black, and one per cent mixed race, with just one out of 2,249 being Chinese.14The term ‘Asian’ itself obscures all differences between Indian, Pakistani and Bangladeshi,and will likely be dominated at the top by Indians, often Gujarati in origin with ties to EastAfrica. Also, ‘white’ obscures differences between the ethnically English, Scottish, Welsh andIrish, as well as Eastern Europeans, Jews, and Gypsies, among whom there will beconsiderable variation.‘White’ and ‘BME’ are purely statistical categories that are useful and enough to saysomething about workforce ethnicity. But the match is not so strong as to supply theknowledge sufficient to control things to bring about a desired equality of outcomes.Moreover, by the time they will have reached the WRES central office, they will already beout of date, which is particularly concerning when looking at boards, where just one personjoining or leaving, can have a remarkable impact on percentages.Indicators 2,3,4These indicators all work on comparing outcomes for BME and white individuals,encompassing short-listing for promotion, receiving training, and disciplinary proceedings.Scores are arrived at by dividing one group’s share of experiencing these, by the other’s. Themajor flaw relates to a quirk of mathematics, namely that when probabilities or proportionsare low, relative disparity tends to be high. This can lead to some counter-intuitiveconclusions. This mathematical quirk, that relative disparity is susceptible to prevalence, hasbeen pointed out by American attorney James Scanlan, and has been termed ‘Scanlan’sRule’ in the academic literature.15Consider the following two NHS trusts: Liverpool University Hospitals scores 2.87 in thelatest data on WRES 2 – the relative likelihood of white applicants being promoted fromshortlists, compared to BME – while Poole Hospital scores 1.66. It would be easy toconclude Liverpool is worse; in fact, that is what WRES would encourage us to believe.However, as seen in the table below, the shares promoted for both whites and non-whitesare much higher for Poole. Most importantly, the absolute difference is far greater – a 30point gap compared to a seven-point gap. Intuitively, you would say Poole is the worsehospital, something not revealed by the WRES p-content/uploads/2016/09/Working-Paper-84.pdf158
Table 2: WRES Indicator 2 – relative likelihood of being promoted from shortlists – whitevs BMETrustLiverpoolUniversityHospitalsPoole HospitalSource: NHS WRES.White sharepromotedBME sharepromotedRelative difference(WRES %45%1.6630The problem becomes more evident when looking at the same trusts over time. Forexample, take Bradford District Care, which provides mental health services (see tablebelow). In 2020, WRES 2 was higher than in 2016, while the absolute difference was just onepercentage point lower. All that had changed was that there were fewer candidatesappointed in that particular year, yet by the terms of WRES, alarm bells would be ringing,necessitating time spent on pointless bureaucratic inquiry.Table 3: WRES Indicator 2 – relative likelihood of being promoted from shortlists atBradford District Care NHS Foundation Trust – white vs BMEWhiteBMERelativedifference(WRES 2)Absolutedifference(percentagepoints)Source: NHS 1%1.720206%3%2.140273This matters in that the current flawed approach leads the focus away from trusts wherethere are massive gulfs, such as Poole, while focusing attention on trusts where there areminor differences, or where fewer promotions are handed out. On WRES 2, of those 148trusts with a score greater than 1.3, meaning a relative disparity in being promoted of morethan 30 per cent in favour of white candidates, 104 had low absolute differences of lessthan 10 percentage points – 70 per cent.1616Based on 2020 data /9
The other implication of Scanlan’s rule is that when we compare probabilities of things notoccurring, between groups, then relative disparity is invariably negligible. For example, atLiverpool University Hospitals, the probability of BME staff not being promoted, comparedto white staff, is just 1.07 times greater, which is a much less alarming figure.The above discussion focused on WRES 2, but the problem of Scanlan’s Rule will hold just asmuch for WRES 3 and 4. A further, specific flaw of WRES 2 is that it is also susceptible to thesize of its denominator. It is calculated by the comparing the white and non-white ratios ofappointees to shortlisted applicants.Consider the following hypothetical example: A trust employs 100 people, 20 of whom areBME. It has six promotions to offer. Twenty white people apply, as do five non-white. Ashort-list of 20 is drawn up, 15 white and five non-white, from which five white people andone minority applicant are promoted. This produces a WRES 2 score of 1.67. Themanagement could easily avoid this if they simply had shortlisted two fewer minorityapplicants, producing a WRES score of one. There is thus potential for manipulating thisstatistic, as well as the incentive to do so.It is very difficult to know why disparity exists between groups, especially when looking ataggregate group-level statistics, not just the facts surrounding individual cases. ConsiderWRES 2 – relative differences in the likelihood of disciplinary action. Why would this notsimply encourage NHS managers to turn a blind eye to poor practice?Indicators 5,6,7,8These indicators pertain to differences in self-reported experiences of abuse andharassment, as well as perceptions of fairness. They stem from the NHS Staff Survey, whichis a survey of employees. According to the NHS, 1.2 million people were invited toparticipate, of which 47.3 per cent did.17 This may entail selection effects, meaning bias,since the survey is not randomly sampled. Indeed, we know the NHS staff to be 23 per centnon-white, while the unweighted response to the Staff Survey is 17 per cent.18 This may becorrected by weighting (we do not know if WRES does this) but if those who are disgruntledare more likely to respond, then adjusting to make the data demographically representativewill only achieve so much.The bigger problem is that these data are subjective. Respondents are asked if theyexperience things such as ‘discrimination’ and ‘abuse’, but such terms may encompass awide variety of behaviours that differ in their gravity.‘Discrimination’ may mean being passed over for promotion, experiencing racial namecalling, or ‘micro-aggressions’ that are often just simple mistakes, poorly chosen words, orcultural misunderstandings. Moreover, analysis of the Crime Survey has shown that w.nhsstaffsurveys.com/results/national-results/10
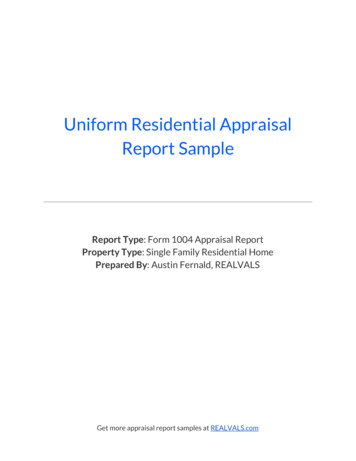
may attribute a racial motivation to a crime often with little grounds. For instance, around12 per cent of crimes classified as ‘race hate crimes’ by the survey were on the grounds thatthe victim stated ‘because some people pick on minorities’.19We also further know black people are more likely to perceive discrimination in hiring andpromotion than Asians, with the Citizenship Survey showing 18 per cent of black Caribbeanpeople believing they were discriminated against compared to eight per cent ofBangladeshis.20 Perception is not everything, so it should not be taken as gospel, which,unfortunately, is the approach of WRES.Again, presenting differences between white and BME will obscure these gradations withinthe non-white minority. For instance, patient satisfaction with GP services for black peopleis the same as for white people, but for Asians, substantially less. Since there are more Asianpeople than black in the United Kingdom, then aggregating them together would produce a‘BME’ score less than that of whites. This would imply a different conclusion from what thefacts actually suggest.21Moreover, those responsible for WRES, who present a picture of a workforce riven withunfairness and inequality, must square this with the fact that nearly all minority groups areas satisfied as the white British in terms of their hospital care. The picture from WRES, basedon subjective staff surveys, does not square with the data from subjective patient surveys,as presented in the graph hange.org.uk/wpcontent/uploads/2016/11/PEXJ5011 Bittersweet Success 1116 al-care/latest2011
Figure 3: Average patient satisfaction score for hospital care, by ethnicity (100-point scale)Minority groupsWhite British majority100806040200Source: Ethnicity Facts & Figures.ValidityIf the WRES indicators are indeed indicators of racial equality within the NHS workforce,then we can expect them to correlate across trusts. Moreover, we can conceive of them asmanifestations of the same ‘latent variable’ – race equality. Statisticians assess the validityof their measurements by comparing them empirically to other conceptually relatedmeasurements. The method used is factor analysis, which looks to measure the extent towhich observed variables measure latent variables or ‘factors’. If measurements ‘load’ ontocommon factors, then they are said to meet the test for ‘convergent validity’, meaning theyare valid measurements of what they purport to measure.23Results of the factor analysis of the 2020 WRES data for NHS trusts are presented in thetable below – for details of variables used, see the Appendix. Provisional analysis (scree test)confirmed a four-factor solution. Thus, the indicators were not loading onto a singledimension, meaning they are not all measuring the same thing.WRES 1 and WRES 9 all load substantially onto Factor 1 (defined as a factor loading with anabsolute value of around 0.4 or more), measuring the extent to which leadership reflectstrusts’ overall ethnic diversity. However, WRES 6, 7 and 8 form a separate factor, measuringthe extent to which white and non-white have differences in subjective perception oftreatment. WRES 2, 3, and 4 all have high ‘uniqueness’ scores, meaning they are largelyindependent of all other variables; hence they do not load onto any factors. WRES 5 -validity/12
weakly onto factor 1, but in the opposite direction from what would be expectedtheoretically.Since the WRES indicators do not converge onto each other, they cannot be said to be validindicators of the same concept, namely ‘race equality’.Table 4: Exploratory factor analysis of WRES indicators (N 183, varimax rotation)24FactorIWRES 1aWRES 1bWRES 2WRES 3WRES 4WRES 5WRES 6WRES 7WRES 8WRES 9SS loadingsProportion varianceCumulative 0.900.790.560.410.460.01Another way to look at this is to look at the correlations between the indicators, aspresented in the table below.There are moderate to strong correlations between WRES 1 and WRES 9. Other than that,there are only moderate correlations at best between other variables, and nothing likeconsistency. WRES 2, 3 and 4 clearly have nothing to do with anything, likely down toScanlan’s Rule. Notably, greater representation in senior leadership reflective of the ethnicdiversity of the ranks is not empirically related to equality of outcome, and on someindicators is weakly but negatively correlated. The subjective measures (WRES 5, 6, 7 and 8)have, at best, only weak to moderate correlations.24Trusts/organisations with missing data on any of the variables were omitted. On WRES 3, there were truststhat had no individuals disciplined in a particular year, from a particular group. These were coded as 0 in theoriginal data, but were treated as ‘missing’ in this analysis. Since the available data contain measurements ofleadership germane to non-clinical and clinical staff, both are incorporated in the model, thus we have twomeasures of WRES 1. Analysis based on 2020 data alone.13
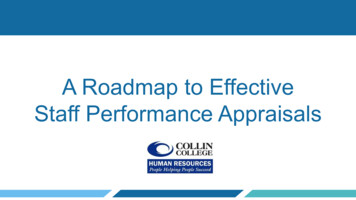
Table 5: Correlation matrix of WRES indicators 2020 (N .09-0.23-0.140.23-0.051.00The factor and correlation analyses confirm that the WRES indicators do not measure thesame thing, they are not all manifestations of the same underlying variable, namely ‘raceequality’.While there are some patterns of correlation, implying some (weak) dimensions of equality,it is incumbent on the designers of WRES to explain why their chosen indicators do notconform to each other. In layman’s terms, they must explain why a hospital with leadershipthat resembles its staff overall, in terms of ethnicity, may or may not report equaltreatment, as well as equal or unequal outcomes in terms of training, promotion ordiscipline. Why might the same employer advantage whites in promotion chances, but notnecessarily in either disciplinary matters or access to training? Why is it that where minorityindividuals believe themselves to be discriminated against, they may, or may not, getpromoted less?Unrealistic expectationsJudging from the metrics chosen, the WRES designers believe ‘equality’ will have beenreached when there is equality of outcome for white and non-white groups. There is,however, a compelling argument for why this is an unreasonable expectation; in effectsomething that is impossible without authoritarian enforcement. That would only produceperverse outcomes, namely ill-equipped individuals in positions of responsibility.Firstly, ethnic minority groups are overrepresented in the NHS, relative to their share of theworking-age population. What this will entail is a higher degree of selectivity for the whitegroup, meaning it would be reasonable to expect that this group will perform better on thejob. If, say, the top five per cent of individuals from one group are selected into a profession,14
compared to the top 10 per cent of another, then it is likely the former will have betteroutcomes. The graph below shows the extent of the disproportionality.Figure 4: Minority presence in the NHS relative to their share of the working-agepopulation (absolute difference)NHS overallDoctorsNursesInfrastructure support30Percentage OtherSource: Adapted from NHS Digital, NHS Hospital & Community Health Service (HCHS) workforce statistics/Ethnicity Facts & Figures.Secondly, groups do not have equality of outcomes at the point of entering into the NHS.Candidates for medical school must sit the UK Clinical Aptitude Test (UKCAT), which teststhem on their suitability for the profession. Analysis by Tiffen et al. (2014) shows differencesbetween ethnic groups in UKCAT scores as well as A-level tariffs (see graph below).25The implication of this is that there will be differences in the levels of aptitude of
Both of these indicators look to compare the BME (black and minority ethnic) shares in elite positions to those of the workforce overall. Percentages are calculated for the BME share of Zvery senior management [ and boards. ZVery senior management [ is defined as chief executives, executive directors, and other senior managers.