Transcription
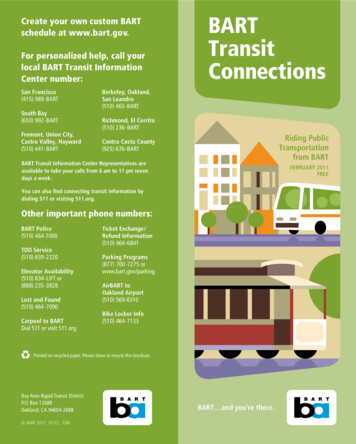
EXECUTIVE DECISION DOCUMENTGENERAL MANAGER ACTION REQ'D:BOARD INITIATED ITEM: NoC ontroller/Treasurer District SecretaryBARCSignatur[ l[ lFiscal Year 2020 Year-End Budget RevisionPurpose: To amend the Fiscal Year 2020 (FY20) Budget for year-end adjustments.Discussion: The District finished FY20 with a balanced budget. A precipitous drop inrevenues caused by the COVID-19 pandemic-related Shelter in Place (SIP) orders beginningin March was offset by one-time emergency federal assistance. Absent such assistance, theDistrict would have finished the year with a 120.3M deficit. Sources were 54.3M (5.7%)favorable to budget and total expenses were 14.6 M (1.8%) favorable. The financial resultsare summarized below, with more detail provided in the Background section andAttachments 1, 2 mid 3.FY20 Operating Results, Including Accounting AdjustmentsFY20 Operating Results ( million)BudgetSourcesUsesOperatirtB Revenue Sales TaxOther AssistanceTotal Sources545.5277.0124.8947.3Actual 399.3266.933 5.31,001.5Var.% (146 .2)-26 .8%(10 .1)210.654.3168.8 %-3 .6%5 .7%LaborNon-LaborTotal ExpenseDebt Service591.6208.1799.747.2586.2198.9785.24 S.95.49 .214.61.3Capital & Other Allocations100.3171.9(71.6)-71.4%Total Debt Service & AllocatlonsTotal UsesNBV of Fixed Assets Disposed Total Uses -Afttr .0s0.0s(0.0)ttJ Na, cash transactla, related t o the net book value d fiJ ed asset s disposed nd: considered In the operatmg bu(8etNct e: For clarity, the a bole table exdudes Other Post Emplavment Benefit (OPEB) Unfun ded Liability and GASB 68 and GASB 15 pension and OPEBadjust melts,. which de net Impact t he Net Result. Results indudl such a ustmerts are shown in Attachment 3.0 .9%4 .4%1 .8%2.8%
Fiscal Year 2020 Year-End Budget Revision (cont.)BACKGROUND: FY20 was unlike any in BART history due to the onset of the COVID19 pandemic and subsequent SIP orders in Bay Area counties. SIP orders were initiated inmid-March. Until then, the District was on a similar financial trajectory as in previous years;expenses (particularly labor) were above budget, but offset by better than expected financialassistance (notably Low Carbon Fuel Standard, or LCFS, credits). Overall ridership inFebruary was within 1% of budget. Despite the pandemic, the District was able to finishFY20 balanced, as described below.Between mid-March and the end ofFY20, BART experienced three major variances fromthe adopted FY20 budget:1. Ridership plummeted, to as low as 6% of the pre-COVID baseline, and slowlyrecovered to about 12% by the end of June. This, along with associated reductions inparking and other operating revenues, led to nearly 1 S0M in revenue reductions whencompared to budget.2. Expenses, which had been above budget until SIP, decreased, primarily by limitingovertime and re-directing Operating Budget-funded staff to accelerate capital projects,the funding for which was not affected by the pandemic. By the end ofFY20, overallexpenditures had been held to just below budget. The net result for the District beforeany emergency assistance would have been 120M deficit.3. BART was able to avoid finishing FY20 with a deficit due to the passage of the federalCoronavirus Aid, Relief, and Economic Security (CARES) Act, which created a newsource of emergency federal aid available to the District. Per the federal formula, BARTwas able to draw down 186M in federal funding. This revenue allowed BART tobalance FY20 without the use of reserves, instead making a deposit of 65 .2M into theReserve for Economic Uncertainty, which will be carried forward to offset operatingdeficits in FY21 .Total Operating Sources: 54.3M (5. 7%) favorable to budget.Operating Revenue was l 46.2M unfavorable to budget, driven by low ridership stemmingfrom COVID-19 related SIP orders. Passenger Revenue was unfavorable ( 138.7M). Passenger trips totaled 83.7M, 27.9%unfavorable to budget and average weekday ridership was 288,271 , 28.8% unfavorable. Parking Revenue was 8.3M unfavorable, with lower ridership impacting the daily nonreserve program. Other Operating Revenue was 0.8M favorable due to above budget investment
Fiscal Year 2020 Year-End Budget Revision (cont.)income and miscellaneous other revenue, offset by below budget advertising and trafficfines & forfeitures revenue.Sales Tax was 1 O. lM below budget and Other Assistance was 210.6M better than budgetdue to the following: Sales Tax was unfavorable to budget by 10.lM for the year, with the 4th quarterresults 13 .9M (21.8%) below budget due to SIP orders and deferral of paymentspermitted under State emergency orders. Through the end of the 3rd quarter, Sales Taxwas 1.8% over budget. The Federal CARES Act provided 185.5M of one-time assistance. Federal TransitAdministration (FTA) rules for CARES Act drawdowns resulted in more funds drawndown to offset FY20 losses than needed in the fiscal year. 65.2M of funds that werenot needed to balance FY20 will be deposited in the Reserve for Economic Uncertaintyand are budgeted to help offset expected operating losses in FY21. Additional Financial Assistance ending the year above budget include: an additional 9 .5M provided by SFO Extension Financial Assistance to offset below budget SFOExtension ridership; 1.2M from the Valley Transportation Authority (VTA) for SiliconValley Berryessa Extension (SVBX) operations; l .8M from unbudgeted County BlockGrant funds provided through State Transit Assistance; l .8M from Property Tax; and 2. lM for miscellaneous Financial Assistance categories. Also contributing to overbudget Financial Assistance is the Low Carbon Fuel Standard (LCFS) Program, whichwas 8. 7M favorable due to higher than anticipated sale of credits generated due tohigh market prices.Total Operating Expenses: 14.6M (1.8%) favorable to budget. Before SIP, expenseswere tracking above budget, but quickly enacted cost-cutting measures after SIP orders wentinto effect brought expenses below budget by year end. Net Labor and Benefits were 5.4M (1 %) favorable to budget due to vacant operatingpositions, which increased in number during SIP, as well as the shifting of operatinghours to accelerate work on capital-funded projects. Overtime in FY20 totaled 75.8M,with approximately 49M attributed to operating and 27M to capital. Over-budgetOperating Budget Overtime totaled 16.9M, just over half the amount above budget inFY19. The decrease is due to the limiting of Overtime as a cost savings measure afterSIP orders went into effect. Non-Labor expenses were 9.2M (4.4%) favorable to budget. Power was 5.0Mfavorable due to reduced service and reductions in transmission and distribution costs.Other Non-Labor items favorable to budget due to reduced ridership include ADAparatransit service ( 2.3M favorable); Clipper Fees ( 3.8M favorable) ; and credit card& interchange fees ( 2.2M favorable). These savings were offset by increased
Fiscal Year 2020 Year-End Budget Revision (cont.)Maintenance and Repair ( 2.6M unfavorable) costs for ongoing maintenance andstation cleaning. An additional 2. lM was expended for enhanced COVID-relatedstation, vehicle, and facility cleaning costs as well as personal protective equipment(PPE).Debt Service and Allocations: 70.3M above budget. Planned allocations were generallyheld to budget, including those allocations linked to ridership or parking revenue, despite thereductions in revenues. The vast majority of the above budget sum consists of 68.7Mdeposited into reserves; 3.5M per the Financial Stability Policy and 65.2M in CARES Actfunds to be carried forward into FY21. Debt Service was 1 JM under budget due to favorable debt refunding in the fall of2019. 65.2M of one-time CARES Act funds drawn down in FY20 were directed to theReserve for Economic Uncertainty to help balance the FY21 budget. 3.5M of theFY20 year-end positive result was allocated to District operating reserves per theFinancial Stability Policy, which brings the reserve balance to 53.7M. 4.3M of over-budget Low Carbon Fuel Standard (LCFS) Program revenue wasallocated to capital reserves for sustainability per the LCFS policy adopted by theBoard. The Allocation to the Fiscal Stability Pension was 0.3M over budget due toinvestment earnings and Other Capital Allocations were 1. 7M under budget due to areversed allocation not budgeted in FY20.The budget revision requires Board approval for adjustments that conform the final budgetto Board Rules. These adjustments increase or decrease categories of expense, revenue, andallocations and fully offset each other. For example, the budget for revenue is decreased;budgets for various categories of financial assistance are increased; budgets for labor andnon-labor are decreased; and certain allocations are increased as described in theBackground section of this document.FISCAL IMPACT: Board approval of the proposed allocations closes the fiscal year andresults in a balanced FY20 Budget.ALTERNATIVES: If the Board does not approve the adjustments, the District will still endthe year balanced.
Fiscal Year 2020 Year-End Budget Revision (cont.)RECOMMENDATION: Approval of the motion below.MOTION: Approval of the attached resolution "In the Matter of Amending Resolution No.5401 regarding Fiscal Year 2020 Annual Budget."
BEFORE THE BOARD OF DIRECTORS OF THESAN FRANCISCO BAY AREA RAPID TRANSIT DISTRICTIn the matter of amending Resolution No. 5401 regarding Fiscal Year 2020 Annual BudgetResolution No.RESOLVED, that Resolution No. 5401 is amended by changing the following line items in Exhibit A thereof:Increase/(Decrease)Fund Source Line Item:CurrentIn Th isAmendedAmountReso lut ionAmount(146,179,176) 399,314,216Ope rati ng Revenue 545,493,392 1/2 C Sales Tax 277,000,000 CARES Act Funds SFO Ext Financial Assistance VTA Financial Assistance State Transit Assistance Property Tax Other Financial Ass istance- (10,104,905 ) 266,895,095185,509,587 185,509,587 9,549,626 15,364,525 1,183,052 1,183,05239,370,555 1,768,367 41,138,92250,622,254 1,770,251 52,392,505 6,429,013 2,057,299 8,486,312Low Carbon Fuel Standards Program 14,149,560 8,731,815 22,881,375Low Carbon Transit Operations Program (LCTOP) 8,374,385 8,374,385(5,383,508) 586,243,937 52,142,414208,130,477 (9,186,281) 198,944,19647,237,727 (1,307,323) 45,930,4045,814,899--Fund Use Line Item:Net Labor Expense Net Labor Expense - GASB 68 and 75 Non-Labor Expense 591,627,445 - 52,142,414Revenue Bond Debt Service Allocations to Capital - Rehabilitation 25,404,856 25,404,856Allocations to Capital - Priority Capital Program 52,165,937 52,165,937Allocation - Operating Reserve fo r Economic Uncertainty - 65,206,043 65,206,043Allocation - Operating Reserve - 3,500,000 3,500,000Allocation to Sustainability from LCFS 7,074,780 4,351,064 11,425,844Allocation - Fiscal Stability Pension 10,000,000 294,375 10,294,375Allocations to Capital & Operating - Other 8,140,117 (1,749,049) 6,391,068Reverse Operating Reserve (2,527,28 1) - - - (156,783,409) Non -Pension Employer Current Year Contrib - (GASB 75) - 43,633,000Non -Pension Expense - Offset (GASB 75) -NVB of Fixed Assets Disposed -PERS Employer Current Year Contrib - (GASB 68)PERS Pension Expense - Offset (GASB 68)96,640,995 (2,527,281)96,640,995(156,783,409) 43,633,000 (35,633,000) (35,633,000) (1,439,404) (1,439,404)
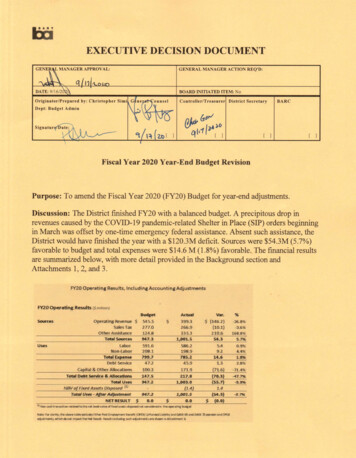
Attachment 1Quarterly Financial ReportFourth QuarterFiscal Year - 2020Revenue Due to the COVID-19 pa nd emic and associated shelter in place orders, average weekday trips forthe quarter were 32,071, 92 .1% under budget and 92.2% below the same quarter last year. For FY20,avg weekday ridership was 288,271, 28.8% under budget, and total trips were 83 .7M, 27.9% underbudget. Total trips were 29 .1% lower th an FY19. FY20 net passenger revenue wa s 138.7M unfavorable due to below budget ridership. Parking revenue was 8 .3M unfavorable for FY20 mainly due to under budget daily non-reserveprogram. Other operating revenue was 0.BM favorable for FY20, with above budget investment income andmiscellaneous other revenue offsetting below budget advertising and traffic fines & forfeituresrevenue.Expense Labor (excluding OPEB and GASB) was 5.4M favorable in FY20 due to savings from vacancies,offset by unfavorable overtime. Power was 5.0M favorable in FY20, mostly due to lower than expected electric consumption dueto COVID-19 pandemic-related service reductions and lower transmission and distribution costs. Purchased Transportation was 2.4M favo rable in FY20 due to COVID-19 related servicereductions. Other Non Labor was under budget by 1.BM for the year. This result was driven by 5.0Mfavorable Miscellaneous Expense, mostly due to favorable interchange rates/fees and Clipperreimburse m ent. Thi s savings was offset by 2.GM overspending in Repairs & Maintenance due tostation cleani ng, repairs to damaged commercial fiber network, inventory adjustments, andmaintenance & fuel of all non-revenue vehicles as well as 1.0M of telecom and garbage and waterutilities from increased usage and utility rates.Financial Assistance and Allocations FY20 Sales Tax was 4.8% under FY19 and 10 .lM unfavorable due to COVID-19 and Shelter in Place(SIP) . Property Tax was 1.SM favorable . Other financial assistance was 12 .SM favorable due to 9 .SMfrom the SFO Extension reserves (San Mateo County financial assistance) for under budget ridership onthe extension; 1.2M from VTA for SVBX operations; and 2.lM for miscellaneous over budget fi nancialassistance. Emergency federal assista nce from the CARES Act was 185 .SM. State Transit Assistance w as 1.SM favorable due to unbudgeted County Block Grant fundsre ceived. Low Carbon Transit Operations Program (LCTOP) revenue was on budget . Low Carbon Fuel Standard (LCFS) Program revenue for FY20 was 8.7M favorable due to higher thananticipated sale of credits generated as a result of high market prices. Debt service was 1.3M favorable due to savi ngs from refunding. capital and other allocations fo r FY20 were 71.GM above budget, with 65.2M allocated to therese rve for economic uncertainty (used to carry over funds into FY21). An additio nal 3.SM is allocatedto operating reserves pe r Board policy.Net Operating Resu It The Net Operating Result for Q4 was 26.7M fa vorable, driven by FTA Cares Act revenue of 185.SM. FY20 total year Net Operating Result was balanced, again, primarily due to the FTA CaresCurrent QuarterB Actual( Millions)VarYear to DateActual etVarRevenue124.19.6-92.3%Net Passenger Revenue480.2341.6-28.9%9.32.3-75.1%Parking Revenue36.528.2-22.8%7.05.1-26.5%Other Operati ng Revenue28.729 .52.8%140.517.1-87.9%Total Net ·o perating Revenue545.5399.3-26.8%147.4120.718.1%Net Labor591.6586,20.9%0,060.10.060.1ExpenseGASB 68 Pension Adjustment0.0(8 ,0)0.0(8.0)11.49.516.7%Electric Power45.640.611 .0%7.95.628.9%Purchased Transportation31,629.27.6%36.540,0-9.5%Other Non Labor130.9129.11.4%203.2228.0-12.2%Total Operating Expense799.8837.3-4.7%(62.7)(210.9)Operating Result (Deficit)(254.3)(438 .0)-72.3%GASB 75 OPEB Adjustment-236.3% Taxes and Financial Assistance63.749,8Sales Tax277 .0266.9-3.6%24.238 .2Property Tax, Other Assistance62 .977.423 .2%0.0185,5Federal CARES Act Assistance0,0185.519.70.027 ,9(0.0)State Transit Assistance (STA)Low Carbon Transit Op Prag39.441.18.44.5%8.43.55.3Low Carbon Fuel Std Prog14.122 .961.7%0.0%(11.8){11.3)Debt Service(47.2)(45.9)2.8%(35.5)(110.4)Capital and Other Allocations(100.3)(171 .9)-71.4%0.060,1GASB 68 Pension Adj. Offset0.060.10.0(8 ,0)GASB 75 OPEB Adj. Offset0.0(8 .0)NBV of Fixed Assets 6 .79.7%-59.4% .0.069. 1%0.438 4.889Net Financial AssistancemE -1 015.1 1. Net Operating ResultSystem Operating Ratio68.2%Rail Cost I Passenger Mileo.43650.9%E Totals may not add due to rounding to the nearest million.-72.3%No ProblemDCaution: Potential Problem/Problem Being Addressed Significant Problem0.604 -38.4%
Attachment 2Explanation of GASB 68 and 75Governmental Accounting Standards Board (GASB) Statements No. 68 and No 75 establishaccounting and financial reporting standards and requirements related to pension liability andpost-employment benefits other than pensions (Other Post-Employment Benefits or OPEB),respectively, for state and local government employers. GASB 68 applies to the District'spension program while GASB 75 applies to all OPEB programs, which include retiree medical,survivor benefits, and life insurance. The standards represent a shift from the "funding basedapproach" to an "accounting based approach" and are intended to provide standardization andadditional transparency for public agency pension and OPEB reporting. The standards call forpublic agencies to report their present obligation to pay future benefits. These future benefitsare recognized in the financial statements but not paid. Therefore, the expenses reported in theDistrict's financial statements, which follow Generally Accepted Accounting Principles (GAAP)and GASB guidelines, will be different than the amounts required to be paid to CalPERSannually to fund the pension plans and contributions to OPEB. The District's annual operatingbudget accounts for actual payment to Cal PERS as an expense based on the amount of fundscontributed to pensions during the year and the amounts contributed to OPEB per actuarialcalculations. The expenses determined under GASB 68 and GASB 75 are not funded by theDistrict, so the recognized expenses are backed out as non -expense allocations to reconcilewith the District's annual operating budget.The main changes to financial statements from adopting the GASB 68 and 75 are thatemployers now report the pension and OPEB liabilities on their balance sheet, and expenses arecalculated in a different manner than the payments required to fund the contributions. Localgovernments now receive two actuarial reports for each pension plan and OPEB program, onefor funding contributions and a second valuation for financial reporting.
Attachment 3FY20 Operating Results, Including Accounting AdjustmentsFY20 Operating Results ( million )SourcesTotal SourcesUsesLaborOPEB Unfunded Liability 111Pension - GASB 68 Adjustment r.1i399.3266.9335.31,001.5 (146 .2}-26.8%(10.1}210 .654.3-3.6%591.6586.25.4 60.1Non-Pension - GASB 75 Adjustment r.1iNon-Labor%277 .0124.8947.3Operating Revenue 545.5Sales TaxOther Ass 0198.9837.345.99.2(37.6)1.3-4.7%Debt Service208.1799.847 .2Capital & Other Allocations100.3171.9(71.6)-71.4%Total Debt Service & 7%Total ExpenseTotal Uses4.4%2.8%-11.4%OPEB Unfunded Liability fl!2Pension - GASB 68 Adjustment Offset fJ3Non-Pension - GASB 75 Adjustment Offset / !4NBV of Fixed Assets Disposed f !Total Uses - After AdjustmentsNET RESULT0.060.18.0{8.0}{1.4}1.4(54.3)1,001.5947.3 {60.1} 0.01' 1 OPEB Unfu nded Liability: Other Post Employment Benefits, primarily life insurance (non-cash adjustment)121 GASB 68 requires restating of pension expense (non-cash adjustment)131 GASB 75 requires restating of non-pension post-employment expense (non-cash adjustment)141 Non cash transaction related to the net book value of fixed assets disposed not considered in the aperating budget (0.0)-5.7%
Debt Service was 1 JM under budget due to favorable debt refunding in the fall of 2019. 65.2M of one-time CARES Act funds drawn down in FY20 were directed to the Reserve for Economic Uncertainty to help balance the FY21 budget. 3.5M of the FY20 year-end positive result was allocated to District operating reserves per the