Transcription
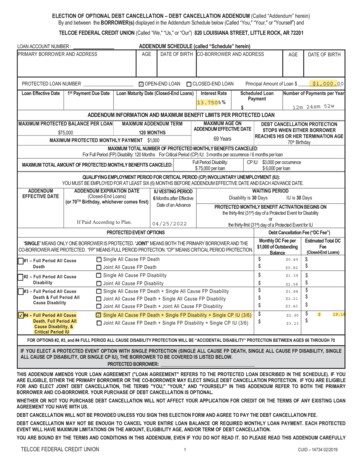
China: DebtCancellation17th April, 2019Consultancy project by OCAC on behalf ofDevelopment Reimagined
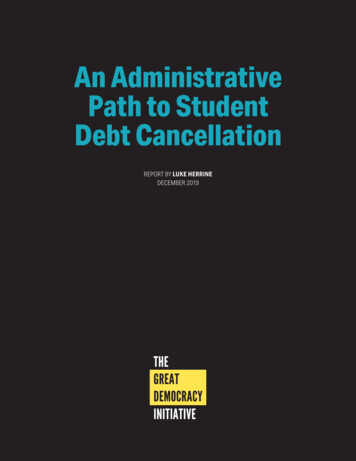
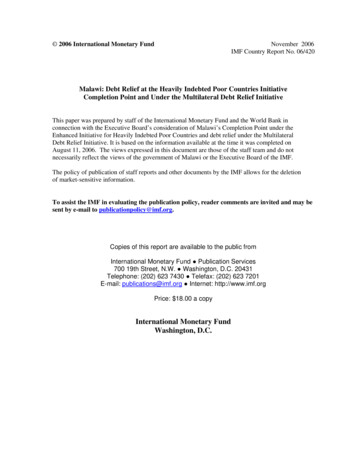
Over the period 2000 to 2018, China has written off c 9.8bn of debt to othercountries; this has been highly variable year-on-yearVerified debt cancellations only(including debt waiver agreements,restructuring, and rescheduling)Annual Debt Cancellations, 2000-18 USmn1838Low volumes and values of debtforgiveness post-2012 6bn 16000779502000 2001 2002 2003 2004 2005 2006 2007 2008 2009 2010 20112 2012 2013 2014 2015 2016 2017 2018NumberCancellations120791382530661--c. 9.8bn-13296CancellationsSignificant spikes in debt forgivenessvolumes in 2001 and 2007 drive highdebt write off value1. Constant Currency terms (2018 US )2. Includes 6bn cancellation to Cuba – although an outlier to group, and is generally excluded from analysis of general trends below OC&C Strategy Consultants 2019Development Reimagined & Oxford China Africa Consultancy, April 20192
Chinese debt cancellation sits within a history of debt cancellation by a range of othercountries and multilateral institutions as well as it’s own foreign aid policyTimeline: Contextualising Chinese Debt Cancellation PolicyThe ASEANmember nations andChina, South Koreaand Japan agreed tohold yearly talks tofurther strengthenregionalcooperation.19961997First Forumon ChinaAfricaCooperation(FOCAC)8 UNMillenniumDevelopmentGoals agreed(2015deadline)2000China’s 1st foreign aid WhitePaper released in 2011. 2ndversion (2014) states thatbetween 2010-2012, Chinaon average gave approx. 4.4bn billion in grants andloans worldwide – of which52% went to LDCs2005Three multilateral institutions—the IMF, theInternational Development Association (IDA) of theWorld Bank, and the African Development Fund(AfDF)— begin to cancel debt for countries that fallunder the Heavily Indebted Poor CountriesInitiative (HIPC) and later the Multilateral DebtRelief Initiative (MDRI)17 UN SustainableDevelopment Goalsagreed – Chinapledges 2bn SouthSouth Aid Fund 3.1bn ClimateChange Fund2010-2014G8 countries agreeto write of 100% ofdebt for 18countries, in totalworth 55bnOECD reports that GlobalOfficial DevelopmentAssistance (ODA) reached 163bn in 2017 – incl. 30bn from US, 11bn fromUK & 3.8bn from UAE2015FOCAC 2018Summit 60bn newcommitments,implies further debtreductions possible– in line withincreasing SinoAfrican Cooperation20172018So far, 99bn of debt for36 countries (30 of whichin Africa) from all donors/multilaterals incl. Chinahas been cancelled underHIPC/ MDRI.NB: All numbers in US OC&C Strategy Consultants 2019Development Reimagined & Oxford China Africa Consultancy, April 20193
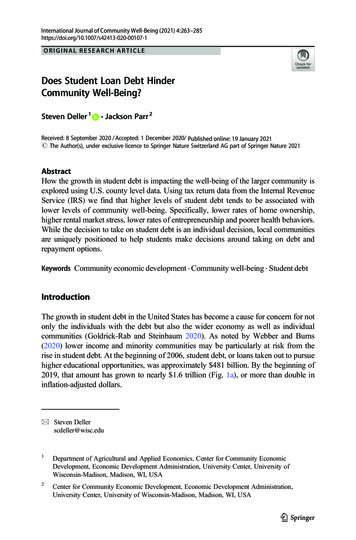
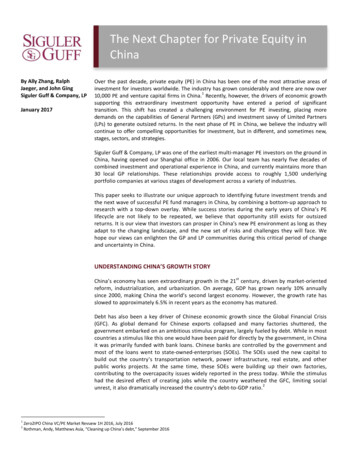
The geographical distribution of Chinese debt cancellation shows asignificant skew towards African countriesGeographic Distribution of Debt Cancellation, By FrequencyNo debt relief1 incidence2 incidences3 incidencesNo diplomaticrelationship toChinaEvident focus on Africa, with Central, West, and EasternAfrica mostly seeing debt cancellations during 20072011 period. Southern Africa, by contrast, sees a focusshift post 2012. OC&C Strategy Consultants 2019Development Reimagined & Oxford China Africa Consultancy, April 20194
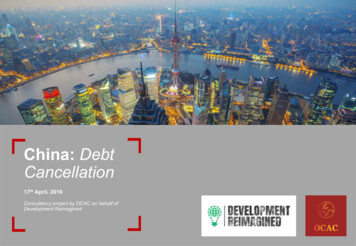
Comparison of bilateral debt relief provided to HIPCs shows China to be inline with the USA & Germany, but behind the biggest cancellersTotal, Debt Cancellation to HIPCs, By Selected Paris Club Countries, 1998-2015 USm5,1923,984Cancellations to HIPCs accountingfor c.40-50% of China’s total debtcancellations (excl. FranceNB: Figuresexclude debtrelief bymultilateralorganisations– e.g. IMF1. Constant Currency terms (2018 US ), analysis excludes Cuba 6bn 2011 restructuring OC&C Strategy Consultants 2019Development Reimagined & Oxford China Africa Consultancy, April 20195
The vast majority of Chinese debt cancellation has been to APAC and Africa,within which Eastern Africa has received the largest amount (c. 1bn)Cancellations by RegionTotal Debt Cancellations, By Region, 2000-18 USm1Africa Total Debt Cancellations, By Region, 2000-18 USm13,75215327733,499Asia and Pacific (APAC)167Southern Africa205Northern Africa308Central Africa556Western Africa1,034Eastern Africa1,2912,208TotalArab StateLatinAmerica andtheCaribbeanAfricaEurope1. Constant Currency terms (2018 US ), analysis excludes Cuba 6bn 2011 restructuring OC&C Strategy Consultants 2019Development Reimagined & Oxford China Africa Consultancy, April 20196
In value terms, medium HDI ranked countries are the largest proportion(c.56%); in volume terms, low HDI countries makes up the greatest share ofcancellationsLow HDI: 0.55Medium HDI: 0.55 to 0.7High HDI: 0.7Cancellations by HDI RatingTotal Cancellation Value, By HDI Rating, 2000-18, USbn13.80.1(4%)2.2(56%)1.6(41%)HighNumber of Cancellations, By HDI Rating, Low201720171. Constant Currency terms (2018 US ) analysis excludes Cuba 6bn 2011 restructuring OC&C Strategy Consultants 2019Development Reimagined & Oxford China Africa Consultancy, April 20197
HIPC countries represent approximately half of China’s total debtcancellations 2000-18 in both value and volume termsCancellations by HPIC StatusTotal Cancellation Value, By HIPC Status, 2000-18, USbn13.8Number of Cancellations, By HPIC Status, C47(49%)Non-HIPC201720171. Constant Currency terms (2018 US ), analysis excludes Cuba 6bn 2011 restructuring OC&C Strategy Consultants 2019Development Reimagined & Oxford China Africa Consultancy, April 20198
Over the period 2000 to 2018, the majority countries (31 out of 54) havereceived only a single cancellationFrequency of Debt CancellationIndicative – Low N the number of cancellations doesnot have a single directional impacton cancellation value c.57% of countries have debtcancelled a single time Number of Discrete Cancellations, 2000-18#Average Cancellation Value, By Numberof Cancellations, 2000-18, USm1 but multiple cancellations are morelikely for countries with a lower HDICancellation Country HDI Value2, ByNumber of Cancellations, 2000-18 USm1Low31 (57%)OneTwo10 (18%)Three11 (21%)More than Three58%4626%60%22532 (4%)Medium High401. Constant Currency terms (2018 US ), analysis excludes Cuba 6bn 2011 restructuring2. High: 0.7, Medium: 0.55 to 0.7, Low: 0.55Development Reimagined & Oxford China Africa Consultancy, April 201916%30% 10%45%55%100% OC&C Strategy Consultants 20199
Countries that have received three or more cancellations are almost all inAfrica, with the highest proportion in the Eastern AfricaGeographical Distribution of Debt Cancellation Frequency, 2000-2018,% of Number of CancellationsSingle CancellationTwo CancellationsThree or MoreCancellationsEurope6%10%8%Arab States13%South / LatinAmericaAPACIndicative – Low NAfrican Distribution of 3 CancellationsN ofCountriesSouthern Africa8%Northern Africa25%Central Africa25%Western Africa33%Eastern Africa3%13%40%92%Africa8%65%3150%1013Analysis excludes Cuba 6bn 2011 restructuring OC&C Strategy Consultants 2019Development Reimagined & Oxford China Africa Consultancy, April 201910
Most cancellations are for values 100m; usually for interest-freegovernment loans maturing at end of yearTotal Value of Debt Cancellation, By Country, 2000-18 USmn1Outlier Cuban debtwrite-down part of morecomplex geopoliticalstatement6000Non-HIPCs (note Eritrea, Somalia & Sudanstill under consideration for inclusion in HIPC)HIPCs (Heavily Indebted Poor Countries)500490Cuba Restructuring2592467075 75 75 67 646153 50 49 45 4438 333029 25 22 20 19 19 1915 14 12 12 12 11 7 7 7 7 6 6 6 5 5 3 3 weEthiopiaMyanmar [Burma]BangladeshBurundiMozambiqueYemenEquatorial GuineaCongoTanzania/ZambiaSerbia and MontenegroUgandaCongo anChadMadagascarCongo DRIvory CoastSierra LeoneGuyanaTanzaniaZanzibar ntral African oros205 17615514110293 92 88 841. Constant Currency terms (2018 US ) OC&C Strategy Consultants 2019Development Reimagined & Oxford China Africa Consultancy, April 201911
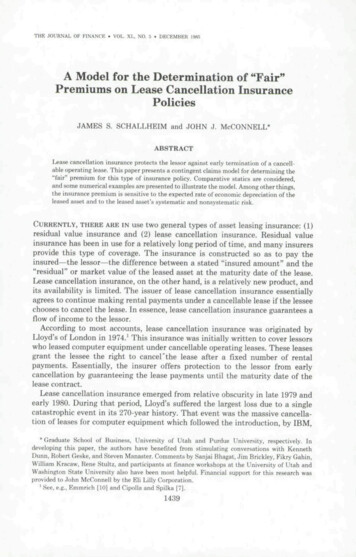
Debt cancellation is not systematically higher for the countries with thegreatest indebted difficulty (as defined by IMF)Average Value of Debt Cancellation, By IMF Level of Debt Distress Risk2, 2000-18 USm1AverageCancellationValue, USm908580757065605550454035302520151050Ball Size 10 CountriesOf countries receiving Chinesedebt forgiveness, those with thelowest level of debt distress riskwere likely to receive the largestcancellationsLow (15) Implies that Chinanot making debtcancellationdecisions basedupon IMF categoriesof default risk / levelof indebtedness Points towards otherfactors that drivedebt cancellationdecisionsHigh (23)In Debt Distress (7)Moderate (26)Increasing Level of Debt Distress Risk1. Constant Currency terms (2018 US , analysis excludes Cuba 6bn 2011 restructuring2. (low risk generally when all the debt burden indicators are below the thresholds in both baseline and stress tests, moderate risk generally when debt burden indicators are below the thresholds in the baseline scenario, but stresstests indicate that thresholds could be breached if there are external shocks or abrupt changes in macroeconomic policies, high risk generally when one or more thresholds are breached under the baseline scenario, but the countrydoes not currently face any repayment difficulties, in debt distress when the country is already experiencing difficulties in servicing its debt, as evidenced, for example, by the existence of arrears, ongoing or impending debtrestructuring, or indications of a high probability of a future debt distress event (e.g., debt and debt service indicators show large near-term breaches or significant or sustained breach of thresholds).Source: IMF Level of Debt Relief Data OC&C Strategy Consultants 2019Development Reimagined & Oxford China Africa Consultancy, April 201912
For African Countries, there appears to be an inverse relationship betweencancellations and FDI – i.e. the more that FDI increases, the less debtcancellation is needed50%Low FDI, HighDebt Cancellation48%49%Rising FDI,Debt Cancellation Share ofFDI (%)25%4.03.53.02.520%2.015%12%1.510%1.05%0%Total FDI( USbn)2004200520062007Pre-2008 significantly lowerChinese FDI resulting in higherdebt cancellation share ofFDI 20082009 2007-08 shortterm anomalousboom 3%4%201020112%1%2012201320142015201620170.50.0 then creeping increases in resulting in insignificant debtcancellation share of FDISource: SIAS CARI OC&C Strategy Consultants 2019Development Reimagined & Oxford China Africa Consultancy, April 201913
There is little correlation between trade balance with China and the number /frequency of debt cancellationCorrelation between Trade Balance with China & Debt Cancellation Frequency (excl. Cuba 2011)# Cancellations, USbnAfricaCorrelation -0.135Imports from China largerthan exports to ChinaAsia and PacificSouth/Latin AmericaExports to China largerthan imports from ChinaArab StatesEurope65Number of DebtCancellations,2000-18Low correlation implyingthat increasing tradingrelationship notmotivating debtcancellations43210-13 -12 -11 -10 -9-8-7-6-5-4-3-2-1012345678910Trade Balance with China USbn OC&C Strategy Consultants 2019Development Reimagined & Oxford China Africa Consultancy, April 201914
Case Studies: Sudan and Zimbabwe have been two non-HIPC recipients offrequent debt cancellations by China, but China is not their largest creditorFrequent Cancellation Deep-DiveSudanZimbabwe Background: Background:– In July 2011 Sudan had no domestic or foreign debt. Since then, twokey factors changed. Shutdown of oil production between Jan 2012 and April 2013 , andsharp drop in oil prices mid 2014.– Debt to China at the end of 2016 is estimated to be 3.2bn, 6% of totalexternal public debt. Rationale for Debt Cancellation:– As part of recent cooperation agreements signed between the twocountries, China agreed to cancel 88m of debts in 2018.– Sudanese President Omer Hassan al-Bashir “implored upon Xi Jinpingto direct financial institutions dealing with Sudan to take into accountthe country’s dire financial position by cancelling some of theoutstanding debt”– IMF described Sudan in 2017 as “continuing to be in debt distress”.2001 70m 1.4m2007– Zimbabwe also has been experiencing political and economic issueswhich placed it in a precarious situation with respect to paying off debts(incl. inflation, political violence etc). Rationale for Debt Cancellation: Conflict emerging in December 2013 40 m– The debt to China at the end of 2016 was 1.2bn, 15% of externalpublic debt 6m 88m20102018– Announced during diplomatic meetings between state leaders: “President Mnangagwa is on a 5-day state visit to China where hehas had meetings with his Chinese counterpart and has reportedlysigned billion dollar deals including one of 1bn for upgrading athermal power station” Note - Zimbabwe was just not paying. E.g. It failed to repay a 60m loan to China Export and Credit Insurance Corporation(Sinosure). IMF described Zimbabwe in 2017 as being “in debt distress, and itstotal public and external debt is unsustainable” 42m 18m2003 454m2010 40m2017 OC&C Strategy Consultants 2019Development Reimagined & Oxford China Africa Consultancy, April 201915
Case Study: Cuban cancellation of 6bn was the result of unique political &economic circumstances & within a broader package from othersCuban Debt Cancellation Deep-DiveTotal Cuban Debt Forgiven, 2011-14 USbnDescription Cuba saw uncharacteristically high debtcancellations from many sources, not just the 6bn from China in 2011. From 2008 to 2015, investment in Cuba fell 17percent and exports by 5 percent. It 2017, it hasa fiscal deficit of 12 percent and a significanttrade deficit (Brookings, 2017).Context ‘”Cash-strapped Cuba ha[d] been feverishlytrying to restructure its debt to jump start itseconomy and attract investment. Three yearsago it restructured 6 billion it owes to China,and in 2012 Japan forgave about 1.4 billion”(RT.com)1.40.56.0MexicoJapanChinaTotal DebtCancellation:c. 40bn32.0Russia In 2015, Cuba actively renegotiated majorproportion of its debt, resulting in a highpercentage of debt forgiveness from manycountries, including China, Mexico, and Russia Thinking of debt cancellation as a ‘loan’,between 2009-2014, the 6bn of debt forgivenamounted to China’s 5th highest ‘loan. OC&C Strategy Consultants 2019Development Reimagined & Oxford China Africa Consultancy, April 201916
References (1) Africa’s growing debt crisis: Who is the debt owed to? (2018). Jubilee Debt Campaign. URL: 18/09/Briefing 09.18.pdf Bloomberg (2011) ‘China Gives Almost Half of Foreign Aid to African Countries’. URL: -countries Davis, C. and Piccone, T. (2017) ‘Sustainable development: the path to economic growth in Cuba: executive summary’. Brookings. -development-the-path-to-economic-growth-in-cuba/ ‘China cancels Sudan’s pre-2016 debt: envoy’. (2018) Sudan Tribune. URL: http://www.sudantribune.com/spip.php?article66243 China’s Global Official Finance Dataset, 2000-2014. Database. AidData Research Lab, William & Mary, nancedataset . OECD (2001) Debt Forgiveness Definition. URL: https://stats.oecd.org/glossary/detail.asp?ID 556 Dreher, A., Fuchs, A., Parks, B., Strange, A, M., and Tierney, M, J. (2017) ‘Aid, China, and Growth: Evidence from a New Global Development Finance Dataset’.Paper for presentation at the Workshop “Tracking International Aid and Investment from Developing and Emerging Economies. -finance-dataset FOCAC 2018 Action Plan. (2018) URL: https://www.focac.org/eng/zywx 1/zywj/t1594297.htm Hurley, J., Morris, S. and Portelance, G. (2018) ‘Examining the Debt Implications of the Belt and Road Initiative from a Policy Perspective’. CGD Policy Paper 121. IMF (2017) ‘Republic of South Sudan Staff Report for 2016 Article IV Consultation – Debt Sustainability Analysis’. 017/dsacr1773.pdf IMF (2017) ‘Sudan: staff report for the 2017 article IV consultation – debt sustainability sa/pdf/2017/dsacr17364.pdf IMF (2017) ‘Zimbabwe: staff report for the 2017 article IV consultation – debt sustainability sa/pdf/2017/dsacr17196.pdf OC&C Strategy Consultants 2019Development Reimagined & Oxford China Africa Consultancy, April 201917
References (2) Kuyedzwa, C. (2018) ‘China writes off Zim's debt’. Fin24 Article. URL: s-debt-report-20180405 Russia writes off 90% of Cuba's debt ahead of Putin's 'big tour' to L. America. (2014) URL: t-writeoff/ SIAS-CARI (2019) ‘Data: Chinese Investment in Africa’. URL: ica SÖZE, K. (2017) ‘Cuba belatedly opens-up for trade after sanctions are lifted’. Web Archive. nctionsfidel-castro/ Stanton, E, A. (2007). ’The Human Development Index: A History’. PERI Working Papers: 14–15. ‘The ‘Big 4’ – How oil revenues are connected to Khartoum’. (2008) Amnesty International USA. p:/www.amnestyusa.org/Business and Human Rights/The Big 4/page.do?id 1081006&n1 3&n2 26 UNCTAD (2017) ‘Bilateral FDI Statistics’. URL: FDI-Statistics-Bilateral.aspx World Bank and IMF (2017) ‘Heavily Indebted Poor Countries (HIPC) Initiative and Multilateral Debt Relief Initiative (MDRI) - Statistical Update’. 8789/WB-HIPC-stat-update-2017.pdf OC&C Strategy Consultants 2019Development Reimagined & Oxford China Africa Consultancy, April 201918
Appendix: Definitions Regions: (of those listed in the data set)– Africa (see image, according to UN Geoscheme for Africa)– Asia South– Pakistan– Bangladesh South East– Cambodia– Laos– Myanmar CentralDebt ForgivenessDebt forgiveness occurs when a governmentcreditor entity in one economy formally agrees via a contractual arrangement - with a debtorentity in another to forgive (extinguish) all, orpart, of the obligation of the debtor entity to thecreditor, the amount forgiven is treated as acapital transfer from the creditor to the debtor.That is, the balance of payments reflects areduction of the liability offset by the transfer.Similar treatment is applicable when agovernment entity’s debt is forgiven byagreement with a creditor entity in anothereconomy. (OECD, 2001)– Afghanistan– Kyrgyzstan– South America Guyana– Pacific Islands Samoa VanuatuHuman Development Index (HDI)The Human Development Index (HDI) is astatistic composite index of lifeexpectancy, education, and per capitaincome indicators, which are used to rankcountries into four tiers of human development. Acountry scores a higher HDI when the lifespan ishigher, the education level is higher, and the GNI(PPP) per capita is higher. (Stanton, 2007) OC&C Strategy Consultants 2019Development Reimagined & Oxford China Africa Consultancy, April 201919
Appendix: Data tablesCancellations By RegionNumber ofTotal Value (US )CancellationsCancellations By YearTotal Value(US 012201320142015201620172018Number ofCancellationsAverageCancellationValue (US 0,00025,810,00047,737,920Asia and PacificAfricaArab alue (US 600,000296,429,126Number ofCancellationsPacific IslandsCentral AfricaEastern AfricaWestern AfricaSouthern AfricaNorthern AfricaCentral AsiaSouth EastAsiaArab StatesSouth AmericaEastern EuropePacific IslandsCaribbeanSouth AsiaAverageCancellationValue (US )Total Value(US ) OC&C Strategy Consultants 2019Development Reimagined & Oxford China Africa Consultancy, April 201920
The geographical distribution of Chinese debt cancellation shows a significant skew towards African countries 1 incidence No debt relief 2 incidences 3 incidences Geographic Distribution of Debt Cancellation, By Frequency Evident focus on Africa, with Central, West, and Eastern Africa mostly seeing debt cancellations during 2007-2011 period.