Transcription
1Race/Ethnicity in 600 Popular Films:Examining On Screen Portrayals and Behind the Camera DiversityDr. Stacy L. Smith, Marc Choueiti, & Dr. Katherine PieperMedia, Diversity, & Social Change InitiativeAnnenberg School for Communication & JournalismUniversity of Southern Californiastacy.smith@usc.eduThis secondary analysis examines on screen portrayals of diversity in popular motion picturecontent. We take a close look at race/ethnicity of speaking characters across 100 of the topgrossing films of 2013. Every speaking character was evaluated for demographic (i.e., age,gender, parental status, relational involvement) and hypersexualization (i.e., sexy attire, nudity,attractiveness) indicators.Key FindingsOn Screen Prevalence of Underrepresented CharactersJust over a quarter (25.9%) of the 3,932 speaking characters evaluated were fromunderrepresented racial/ethnic groups. A full 74.1% were White, 14.1% Black, 4.9% Hispanic,4.4% Asian, 1.1% Middle Eastern, 1% American Indian or Alaskan Native, and 1.2% werefrom "other" races/ethnicities. No meaningful change has been observed in the frequency of anyracial/ethnic group on screen in 600 popular films between 2007 and 2013.The prevalence of underrepresented characters across film genre was evaluated in 2007, 2010,and 2013. Less than 15% of all characters are from underrepresented groups in animation.Between 2007 and 2010, there was 6.6% drop to 1.5%, followed by an increase between 2010and 2013 to a high of 12.4%. Action and/or adventure movies increased and then decreased inthe percentage of underrepresented characters. Comedy showed a slight increase across the threeyears evaluated, from 23.1% to 27.8%, but failed to cross the threshold for meaningful change.Nearly a fifth of all films in the sample (17%) depict no African American or Black speakingcharacters across their unfolding narratives. Fifteen films depict Black characters as 2.2-5.9% ofthe cast and another 22 movies portray Black characters in 6-10% of the cast. Taken together,over half of the movies in the sample are under indexing in comparison to U.S. populationstatistics. Only 14% of the movies show Black characters at or within 2 percentage points of U.S.Census (10.8-14.5%).Male characters within each racial and/or ethnic group outnumbered females from the sameracial and/or ethnic group. The percentage of female characters ranged from the high of 37.3%of Hispanic/Latino characters to 23% of characters from “other” races/ethnicities.Study funded by supporters of Media, Diversity & Social Change Initiative(c) Dr. Stacy L. Smith
2Portrayal of Characters from Underrepresented GroupsHispanic females (37.5%) were more likely than females from all other races/ethnicities to beshown partially or fully naked on screen. In comparison to Black females (23.5%), Whitefemales were more likely to be shown with some exposed skin (31.9%) and Asian females wereless likely (18.2%).Hispanic males (16.5%) were the most likely to be shown in tight, alluring, or revealing clothing.Asian males (13.7%) were more likely than white males (8.3%) to be depicted in sexy attire. Interms of some nudity, male characters from "other" (18.2%) races/ethnicities were more likelythan white male characters (9.9%) to be shown partially or fully nude.Black males were the most likely to be shown in a committed relationship (68.4%). Further,White (58.1%) and Hispanic (57.1%) males were more likely than “Other” males (37.5%) to bedepicted as boyfriends or spouses. Asian males were the least likely to be depicted in a romanticrelationship (28.6%).Prevalence of Black Directors in Top-Grossing FilmsWe assessed whether each film in 2013 was directed by an African American or Black director.A total of 107 directors were attached to the 100 top-grossing films. Only 7 (6.5%) were Black.Although there were 7 total directors, two of them repeated across the sample, leaving only 5unique Black directors in 2013. There were no Black female directors of the top 100 grossingmovies in 2013. Across the six year sample, there are only 2 Black females represented across23 unique Black directors in all six years and 600 films.Films without a Black director were responsible for casting Black characters in 10.8% ofspeaking parts. Black directors, conversely, cast Black characters in 46% of all of the speakingroles. This is a 35.2% increase and is consistent with our previous research.Study funded by supporters of Media, Diversity & Social Change Initiative(c) Dr. Stacy L. Smith
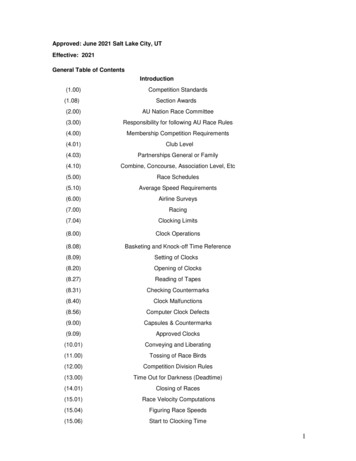
3Race/Ethnicity in 600 Popular Films:Examining On Screen Portrayals and Behind the Camera Diversity1The aim of this secondary analysis is to examine on screen portrayals of diversity in popularmotion picture content. It is a companion study to our yearly longitudinal report, GenderInequality in Film. Here, we take a close look at race/ethnicity of speaking characters across 100of the top-grossing films of 2013. Every speaking character was evaluated for demographic (i.e.,age, gender, parental status, relational involvement) and hypersexualization (i.e., sexy attire,nudity, attractiveness) indicators.2Below, we highlight three major trends. We present findings for 2013 and compare them totrends found across the top 500 films from 2007 to 2012.3 Only results that are statistically (p .05) and practically (5% difference) significant are reported below. Consistent with our otherreports on race/ethnicity, we also examine the frequency of Black directors across the 100 topgrossing 2013 films.#1 Character Race/Ethnicity is Marginalized On ScreenA total of 3,932 speaking characters were evaluated for race/ethnicity. A full 74.1% were White,14.1% Black, 4.9% Hispanic, 4.4% Asian, 1.1% Middle Eastern, 1% American Indian orAlaskan Native, and 1.2% were from "other" races/ethnicities. Put differently, just over a quarter(25.9%) of speaking characters were from underrepresented racial/ethnic groups.Table 1Character Race/Ethnicity in Top-Grossing Films: 4.7%5%5%4.4%Other2.5%3.5%1.5%3.3%3.6%2.5%Note: Other is combined to include American Indian/Alaska Native, Native Hawaiian/Pacific Islander,Middle Eastern, and characters with racial/ethnic identities not listed here.According to the 2010 U.S. Census, 16.3% of the population is Hispanic, 12.6% Black and 4.8%Asian.4 Using these percentages and the statistics featured in Table 1, Hispanics clearly are the mostunderserved racial/ethnic group by the film industry. Latinos represent only 4.9% of speakingcharacters yet they purchase 25% of all movie tickets (20.1% difference) and command roughly 1trillion in spending power.5 Black speaking characters slightly over index (1.5%) in comparison to2010 U.S. Census. The percentage of Black speaking characters in 2013 is only 1.1% above thepercentage in 2007, a finding we will return to shortly.We were interested in whether the prevalence of underrepresented characters was related to filmgenre. This is important to examine because individuals from underrepresented racial/ethnicStudy funded by supporters of Media, Diversity & Social Change Initiative(c) Dr. Stacy L. Smith
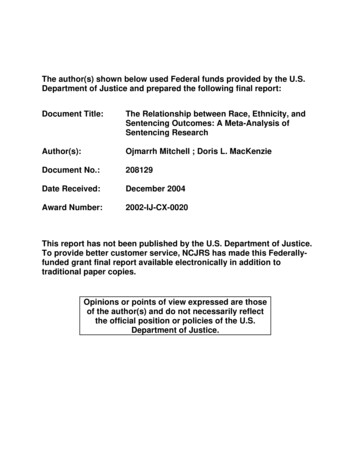
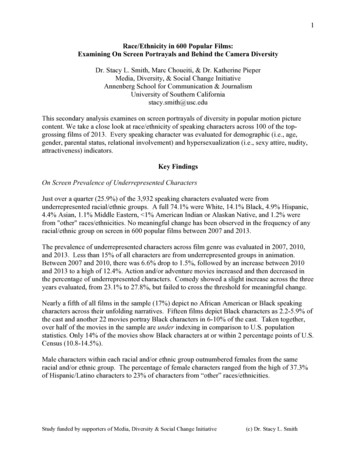
4groups comprise 37% of the U.S. population and buy 46% of movie tickets in this country.6Films were sorted into four genre categories (i.e., action/adventure, animation, comedy, other)and the percentage of white vs. underrepresented characters was compared.A few trends emerged, as shown in Table 2.7 Action and/or adventure movies increased and thendecreased in the percentage of underrepresented characters. A 5% gain was achieved from 2007to 2013, however. A different pattern emerged in animation, where there was 6.6% dropbetween 2007 and 2010 followed by a 10.9% increase between 2010 and 2013. Ultimately, thereis no meaningful difference between percentage of underrepresented characters in 2007 films and2013 films. Comedy showed a slight increase across the three years evaluated, but failed to crossthe 5% threshold for meaningful change. The prevalence of underrepresented characters in allother genres decreased and then increased overtime (2007 24.2%, 2010 18.8%, 2013 25.5%).Table 2Percentage of Underrepresented Characters by Film Genre: 2007, 2010, 2013Action/Adventure% of 12.4%23.1%23.8%27.8%Note: Genre was determined by using Box Office Mojo designations. The percentage of white characters can bedetermined by subtracting the percentage of underrepresented characters from 100%.One other aspect of 2013 is important to note. Many have claimed 2013 to be a renaissance year forBlack actors in film, with the critical acclaim and popularity of 12 Years a Slave, The Butler, 42, andBest Man Holiday. Our findings demonstrate, however, that no meaningful change has beenobserved in the frequency of any racial/ethnic group on screen in popular films between 2007 and2013.It may be the case that a few high profile films are affecting individuals' perceptions of how oftenBlack characters are featured in motion picture content. As such, it becomes important to examinethe percentage of Black characters per film across the sample of 100 movies.Demonstrated in Figure 1, nearly a fifth of all films in the sample (17%) depict no African Americanor Black speaking characters across their unfolding narratives.8 Fifteen films depict Black charactersas 2.2-5.9% of the cast and another 22 movies portray Black characters in 6-10% of the cast. Takentogether, over half of the movies in the sample are under indexing in comparison to U.S. populationstatistics. Only 14% of the movies show Black characters at or within 2 percentage points of U.S.Census (10.8-14.5%). 6 films in the sample portray Black or African American actors in more than30% of speaking parts.Study funded by supporters of Media, Diversity & Social Change Initiative(c) Dr. Stacy L. Smith
5Figure 1Percentage of Black Characters per Movie in 100 Top-Grossing Films: 2013Given the gender imbalance frequently reported on screen in film,9 the percentage of male andfemale speaking characters within the four largest races/ethnicities were calculated (see Table 2).Hispanic females (37.3%) were more likely to be featured in popular films than were white females(29.6%) or Asian females (32%). Females from "other" racial/ethnic categories were the least likelyto be portrayed on screen (23%). These percentages suggest that female actors identifying as MiddleEastern, Native American, or Pacific Islander as well as "mixed race" artists may face considerabledifficulty working on screen in film, particularly in comparison to their male counterparts from thesame racial/ethnic background.Table 2Apparent Race/Ethnicity of Male and Female Characters in Top-Grossing Films: 2013MalesFemalesRatioWhite70.4%29.6%2.38 to 1Hispanic62.7%37.3%1.68 to 1Black66.2%33.8%1.96 to 1Asian68%32%2.13 to 1Other77%23%3.35 to 1Note: Other is combined to include American Indian/Alaska Native, Native Hawaiian/Pacific Islander,Middle Eastern, and characters with racial/ethnic identities not listed here.#2 Some Races/Ethnicities are Sexualized and Stereotyped On screenGiven the gender differences above, we examined the sexualization of male and female charactersseparately. The four groups reported in Table 2 were included in the analyses as well as an "other"category. Sexualized attire (tight, revealing, arousal inducing garments) did not vary byStudy funded by supporters of Media, Diversity & Social Change Initiative(c) Dr. Stacy L. Smith
6race/ethnicity for female characters (see Table 3).10 White (32.2%) and Hispanic (36.1%) femaleswere shown in sexy attire more than Black (24.6%), Asian (23.6%) or Other (26.1%) females.Table 3Female Hypersexuality Indicators by Race/Ethnicity: 2013Hypersexuality Indicator% in sexualized attire% w/some exposed skin% referenced .1%21.7%17.4%Note: Cells feature the percentage of females possessing a certain attribute. To illustrate, 32.2% of white femalecharacters in 2013 were depicted in sexy attire. This means that 67.8% of white females were not shown in sexyclothing.Nudity or showing exposed skin between the mid chest and high upper thigh region varied byrace/ethnicity. Hispanic females (37.5%) were more likely than females from all otherraces/ethnicities to be shown partially or fully naked on screen. In comparison to Black females(23.5%), White females were more likely to be shown with some exposed skin (31.9%) and Asianfemales were less likely (18.2%). References to females' physical attractiveness did not vary byrace/ethnicity. Just under 15% of female characters (13.6%) were verbally (e.g., "you look hot") ornonverbally referenced (e.g., cat call) as pretty.Turning to male characters, we examined the same hypersexuality indicators.11 Overall, thepercentages of boys/men sexualized in popular films were much lower than the percentages forgirls/women. As noted in Table 4, sexy attire varied by race/ethnicity. Hispanic males (16.5%)were the most likely to be shown in tight, alluring, or revealing clothing. Asian males (13.7%)were more likely than white males (8.3%) to be depicted in sexy attire. In terms of some nudity,male characters from "other" (18.2%) races/ethnicities were more likely than white malecharacters (9.9%) to be shown partially or fully nude. Hispanic (16.5%), Black (13.1%), andAsian (15.4%) males held a middle position between the two aforementioned groups. Physicalattractiveness was not associated with male characters' race/ethnicity, though the percentages canbe found in Table 4.Table 4Male Hypersexuality Indicators by Race/Ethnicity: 2013Hypersexuality Indicator% in sexualized attire% w/some exposed skin% referenced lack12.5%13.1%2.2%Asian13.7%15.4% 1%Other11.7%18.2%3.9%Note: Cells feature the percentage of males possessing a certain attribute. To illustrate, 8.3% of the white malecharacters in 2013 were depicted in sexy attire. This means that 91.7% of white males were not shown in sexuallyrevealing clothes.We also assessed two domesticated roles: parental status (no, yes) and romantic relationshipinvolvement (no, yes). These judgments were only made when enough character information orStudy funded by supporters of Media, Diversity & Social Change Initiative(c) Dr. Stacy L. Smith
7context cues (i.e., home life depicted, references to family) were present in the storyline.Focusing on female characters, no relationship emerged between race/ethnicity and parentalstatus. Overall, 52.9% of all female characters were shown as single or co-parents somewhereacross the unfolding plot. Similarly, there was no association between romantic relationship (no,yes) and female characters' race/ethnicity. Almost two thirds of all females (64.9%) that couldbe evaluated on this variable were shown in a romantic relationship.Turning to male characters, parental status was not related to race/ethnicity. Nearly half (48.1%)of all male speaking characters were shown as parents. Romantic relationship status did varywith race/ethnicity, however.12 Black males were the most likely to be shown in a committedrelationship (68.4%). Further, White (58.1%) and Hispanic (57.1%) males were more likely than“Other” males (37.5%) to be depicted as boyfriends or spouses. Asian males were the leastlikely to be depicted in a romantic relationship (28.6%).#3 Black Directors: Few work. Even Fewer are FemaleWe assessed whether each film in 2013 was directed by an African American or Black director(see Table 5). A total of 107 directors were attached to the 100 top-grossing films, only 7 (6.5%)were Black (Lee Daniels, The Butler; Antoine Fuqua, Olympus Has Fallen; Malcolm D. Lee,Best Man Holiday; Steve McQueen, 12 Years a Slave; Tyler Perry, A Madea Christmas, TylerPerry, Temptation, Malcolm D. Lee, Scary Movie 5). As the list reveals, there are only 5 uniqueBlack male directors across the 2013 sample. Not one film was directed by a Black woman.Table 6 lists all of the unique Black directors that have worked on one or more of the 600 topgrossing films from 2007 to 2013. Only 23 unique directors have been attached to popularcinematic fare over the last 6 years.Table 5Black Directors by Gender in Top-Grossing Films: kMalesBlackFemalesTotal #of Directors7.1%(n 8)4.5%(n 5)1.8%(n 2)6.3%(n 7)4.6%(n 5)4.9%(n 6)6.5%(n 7)00005.6%(n 38) 1%(n 2)1121111091211070112672The number of working Black directors across the top 100 films per year has been stable overtime ranging from 8 in 2007 to 7 in 2013. Further, the point statistic (6% of all directors areBlack, n 40) is well below U.S. Census estimates (12.6%). Clearly, there has been nomeaningful change in the percentage or number of Black directors across the 6 years listed inTable 5.Study funded by supporters of Media, Diversity & Social Change Initiative(c) Dr. Stacy L. Smith
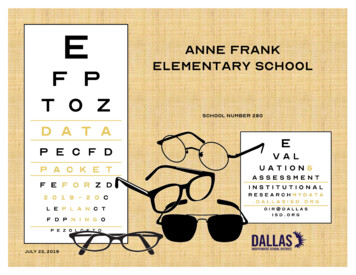
8Table 6Black Directors Working in Top-Grossing Films Between 2007-2013Philip G. AtwellLee DanielsAntoine FuquaF. Gary GraySanaa HamriAnthony HemingwayAlbert HughesAllen HughesMalcolm D. LeeSteve McQueenTyler PerryGina Prince-BythewoodOlatunde OsunsanmiPeter RamseyTim StoryDavid E. TalbertGeorge Tillman Jr.Mark TonderaiDenzel WashingtonDamien Dante WayansSylvain WhitePreston A. Whitmore IIGeorge C. WolfeFigure 3Percentage of Black Characters on Screen by Director RaceLastly, we looked to see how diversity behind the camera may be related to diversity on screen.We were specifically interested in the relationship between Black directors (no, yes) and Blackcharacters on screen. The association was significant,13 as noted in Figure 3. Films with Whitedirectors were responsible for casting Black characters in 10.8% of speaking parts. Blackdirectors, conversely, cast Black characters in 46% of all of the speaking roles. This is a 35.2%increase and is consistent with our previous research.14 Thus, diversity behind the camera maybe the key to diversifying stories and plot points on screen. It may also be the case that studioexecutives and agents were more likely to attach a Black director to racial or ethnic stories.Clearly, more research is needed to determine how and under what conditions Black directors areconsidered for open directing jobs.ConclusionThis study sought to examine the prevalence and portrayal of characters from underrepresentedbackgrounds in the top-grossing films of 2013. There are several key findings across the study.First, the percentage of characters from underrepresented groups has not meaningfully changedsince 2007. Despite the demographic changes at work in the U.S., films still portray ahomogenized picture of the world. In fact, nearly half of children under age 5 in the U.S. are notWhite,15 which means that both the current and future audience for films is far more diverse thanwhat is shown on screen.Study funded by supporters of Media, Diversity & Social Change Initiative(c) Dr. Stacy L. Smith
9Our second major finding reveals that Black female directors are essentially absent from theranks of top-grossing directors. Along these lines, the percentage of Black male directors hasremained consistent since 2007 and below Census estimates of the Black population. 2013 mayhave been heralded as a remarkable year for Black cinema, but not due to the wealth of Blackdirectors. The lack of diversity behind the camera is notable as we have again demonstrated anassociation between the presence of a Black director and the percentage of Black characters onscreen. While this relationship may be due to the nature of the content that Black directors aregiven or choose to helm, adding diversity in the director’s chair may influence what we see onscreen.Third, there is some variation in how characters from underrepresented groups are portrayed.Across two indicators, Hispanic females seem to be more hypersexualized than their femalecounterparts from other groups. Asian females, in contrast, are the least sexualized group.These findings appear to be consistent for males as well, though men from “Other”races/ethnicities are shown with more exposed skin. These findings are noteworthy because theyillustrate how existing cultural stereotypes may still govern how characters from differentbackgrounds are shown on screen.In conclusion, top-grossing films do not fully represent the audiences they target. Stories andstorytellers should reflect viewers who hail from different cultural backgrounds. The increasingdiversity in the U.S. population means that diversity is not a question for the past—it is achallenge and a hallmark of the future.Study funded by supporters of Media, Diversity & Social Change Initiative(c) Dr. Stacy L. Smith
10Footnotes1.This study is a companion report to our previously released investigation: Smith, S.L., Choueiti, M., &Pieper, K. (2014). Gender Inequality in Popular Films: Examining On Screen Portrayals and Behind-theScenes Employment Patterns in Motion Pictures Released between 2007-2013. Media, Diversity, &Social Change Initiative. USC Annenberg.2.A speaking character was defined as a living being that spoke one or more words overtly on screen.Characters that did not speak but were referred to by name were also counted. Speaking characters werecoded for apparent race/ethnicity, using all available cues from the unfolding narrative (i.e., facialfeatures, skin tone, accent, nationality, customs, etc). The levels for race/ethnicity include: White, Black,Hispanic, American Indian/Native Alaskan, Asian, Middle Eastern, and "other." Two additional levelscould be utilized on the race/ethnicity measure: can't tell and not applicable. The race/ethnicity of 530characters was not ascertainable and another 55 characters were coded as "not applicable" on this attribute(i.e., supernatural creatures, animals).Coder training, measure conceptualization, unitizing agreement, and variable reliability is all reported inthe Gender Inequality Report (see Smith et al., 2014).3.Smith, S.L., Choueiti, M., & Pieper, K. (2013). Race/ethnicity in 500 Popular Films: Is the Key toDiversifying Cinematic Content held in the Hand of the Black Director? Media, Diversity, & SocialChange Initiative. USC Annenberg.4.Rastogi, S., Johnson, T.D., Hoeffel, E.M., & Drewery, Jr., M. P. (2011). The Black Population: 2010.U.S. Census Bureau Report. Ennis, S.R., Rios-Vargas, M., & Albert, N.G. (2011). The HispanicPopulation: 2010. U.S. Census Bureau Report. Hoeffel, E.M., Rastogi, S., Kim, M.O., & Shahid, H.(2012). The Asian Population: 2010. U.S. Census Bureau Report.5.Humphreys, J.M. (2009). The Multicultural Economy 2009. Report by The Selig Center for EconomicGrowth, Terry College of Business, University of ulticultural economy 2009.pdf See p. 11.6.MPAA (2013). Theatrical Market Statistics: 2013. Author. -Theatrical-Market-Statistics-2013 032514-v2.pdf7.The relationship was significant between film genre (action/adventure, animation, comedy, other) andunderrepresented characters (underrepresented vs. white) for all three years: 2007, X2 (3, 4,129) 36.29,p .05, V* .09; 2010, X2 (3, 3,847) 74.80, p .05, V* .14; 2013, X2 (3, 3,932) 19.17, p .05, V* .07.8.The percentages in Figure 1 sum to 99%. One film did not depict any speaking characters thatpossessed a race/ethnicity.9.See Smith S.L., et al. (2014).10For female characters, the chi-square analysis for sexually revealing clothing (no, yes) andrace/ethnicity (White, Hispanic, Black, Asian, Other) was not significant (p .05). However, a similaranalysis was significant for nudity (none, some) by race/ethnicity; X2 (4, 1,196) 11.51, p .05, V* .10.No significant association between attractiveness (no references, one or more references) andrace/ethnicity was observed.Study funded by supporters of Media, Diversity & Social Change Initiative(c) Dr. Stacy L. Smith
1111.For male characters, chi-square analysis for sexually revealing clothing (no, yes) and race/ethnicity(White, Hispanic, Black, Asian, Other) was significant, X2 (4, 2,734) 16.78, p .05, V* .08. A similaranalysis was significant for nudity (none, some) by race/ethnicity; X2 (4, 2,734) 14.21, p .05, V* .07.No relationship between male characters' attractiveness (no references vs. more than one) andrace/ethnicity was observed.12.The chi-square analysis for male characters' romantic relationship (no, yes) and race/ethnicity (White,Hispanic, Black, Asian, Other) was significant, X2 (4, 430) 10.24, p .05, V* .15.13.The analysis for Black director (no, yes) and Black character (no, yes) was significant, X2 (1,3,932) 339.06, p .05, phi .29.14.Smith, S.L., Choueiti, M., & Pieper, K. (2013). Race/ethnicity in 500 Popular Films.15.U.S. Census Bureau (2012, May 17). Most children younger than age 1 are minorities, Census Bureaureports. Available: opulation/cb12-90.htmlStudy funded by supporters of Media, Diversity & Social Change Initiative(c) Dr. Stacy L. Smith
12AcknowledgementsThis yearly report is possible because of the generous support from the Harnisch Foundation,Jacqueline & Gregory Zehner, Julie Parker Benello, Manuel and Mari Alba, Ann Erickson andRichard Pellett, and Clif Bar Family Foundation. We also are indebted to Ruth Ann Harnisch,Lindsey Taylor Wood, Jennifer Raymond, Larry Gross, Tracy Mendoza, ASCJ Tech (FrankMiuccio, Carlos Villa, Sebastian Grubaugh, Bryan Sylvester) and USC Annenberg’s publicaffairs department (Anne Bergman, Gretchen Parker, Jeremy Rosenberg, Patricia Lapadula,Jeremiah Bautista). Other team members deserve special mention, especially Arianna Case,Tiffany Wang, Ting Ting Liu, Rosan Hsu, Lily Puglisi, Miranda ‘Andie’ Hearst, JheanelleGarriques, Yawei Yang, Dhruva Patil, Yao Song, and Christine Song. And, a special heartfeltthanks to our first junior intern, Sarah Neff (Sue!).Harnisch Foundation/MDSCI Research Team InternsAllison BegalmanAmanda BrookerAnna Solow-CollinsAshley ChaoBryn McFaddenCathy WangChristine ‘Heechung’ KimEmerald DouglasJeeYun ‘Sophia’ BaikKatherine NeffKatie JagodkaMonica RamsyNick CucciaRachel ZacutoSameer SuriTeddy FogelmanVanessa VillanuevaUSC Undergraduate and Graduate Research TeamRazan Al MarzouqiChristopher AllisonTherese AndersLisa BattagliaAimee BennettNisha BhikhaYoobin ChaAngel ChoiStella ChungMaria De La GarzaAlexandrea DesrosiersSamantha DickensJessica DuncanJacqueline FernandezAlexandra FongArtur GalstyanEmani GleeCory GrzechowiakLucy GuoSarah HempelSamantha HillerCody HockYijing ‘Sally’ HongAudrey JoungJeremy KatchenEdward LauAlix LipsonJanet OcampoArisa OginoHolger PaasMatthew PadavickMelody PakravanGabriel RochaRaquelle RossSam RothschildYujin SeoAvital ShoomerMegan SingsonCrystal SmithChristine SongJaide StepterHannah StetsonKayla TakemotoSareen TavidianAja ThorntonArtur TofanAllison TohSadie ‘Teagan’ TrautweinKymberly Van Der WeydeZhongyue ‘Sabrina’ WangBridgette WebbKevin YaoTessa ZemanYe ZiStudy funded by supporters of Media, Diversity & Social Change Initiative(c) Dr. Stacy L. Smith
13Appendix AList of 2013 Films in the SampleThe Hunger Games: CatchingFireIron Man 3FrozenDespicable Me 2Man of SteelGravityMonsters UniversityThe Hobbit: The Desolation ofSmaugFast & Furious 6Oz The Great and PowerfulStar Trek Into DarknessThor: The Dark WorldWorld War ZThe CroodsThe HeatWe're the MillersAmerican HustleThe Great GatsbyThe ConjuringIdentity ThiefGrown Ups 2The WolverineAnchorman 2: The LegendContinuesLone SurvivorG.I. Joe: RetaliationCloudy with a Chance ofMeatballs 2Now You See MeThe Wolf of Wall StreetLee Daniels' The ButlerThe Hangover Part IIIEpicCaptain PhillipsJackass Presents: Bad GrandpaPacific RimThis is the EndOlympus Has Fallen42ElysiumPlanesThe Lone RangerOblivionInsidious Chapter 2Saving Mr. BanksTurbo2 GunsWhite House DownMamaSafe HavenThe Smurfs 2The Best Man HolidayPercy Jackson: Sea ofMonstersA Good Day to Die HardWarm BodiesJack the Giant SlayerThe PurgeLast VegasEnder's GamePrisonersAfter EarthThe Secret Life of WalterMittyEscape From Planet Earth12 Years a SlaveFree BirdsHansel and Gretel: WitchHuntersEvil DeadRed 2Tyler Perry's A MadeaChristmasStudy funded by supporters of Media, Diversity & Social Change InitiativeTyler Perry's Temptation:Confessions of a MarriageCounselorThe CallPain and GainGangster SquadJurassic Park 3DThe InternshipInstructions Not IncludedSnitchRiddickA Haunted House47 RoninAugust: Osage CountyPhilomenaThe FamilyWalking with DinosaursCarrieTexas Chainsaw 3DR.I.P.D.Blue JasmineSide EffectsScary Movie 5The Mortal Instruments: Cityof BonesDelivery ManGrudge MatchKick-Ass 2Dallas Buyers ClubRushThe HostThe World's End21 and OverHerEscape PlanDon Jon(c) Dr. Stacy L. Smith
statistics. Only 14% of the movies show Black characters at or within 2 percentage points of U.S. Census (10.8-14.5%). Male characters within each racial and/or ethnic group outnumbered females from the same racial and/or ethnic group. The percentage of female characters ranged from the high of 37.3%