Transcription
HOUSING DISCRIMINATIONAGAINST RACIAL ANDETHNIC MINORITIES 2012U.S. Department of Housing and Urban Development Office of Policy Development and Research
Visit PD&R’s websitewww.huduser.orgto find this report and others sponsored by HUD’s Office of Policy Development and Research (PD&R). Other services ofHUD USER, PD&R’s research information service, include listservs, special interest reports, bimonthly publications (bestpractices, significant studies from other sources), access to public use databases, and a hotline (800-245-2691) for helpaccessing the information you need.
HOUSING DISCRIMINATIONAGAINST RACIAL ANDETHNIC MINORITIES 2012Prepared for:U.S. Department of Housingand Urban DevelopmentWashington, D.C.Prepared by:Margery Austin TurnerRob SantosDiane K. LevyDoug WissokerClaudia ArandaRob PitingoloThe Urban InstituteJune 2013
ACKNOWLEDGMENTSThis project could not have been completed successfully without the commitment and hard work oftest coordinators, advance contact staff, testers, and other staff of the local testing organizations thatparticipated.A panel of expert advisors made valuable contributions to our understanding of changes in rental andsales housing markets, analysis of tester racial and ethnic identifiability, and other protocol design anddata analysis challenges. Panel members (and their organizational affiliations at the time of the study)were John Baugh (Washington University); James Follain (James R. Follain, LLC); Fred Freiberg (FairHousing Justice Center); George Galster (Wayne State University); Carla Herbig (Department of Justice);Anne Houghtaling (National Fair Housing Alliance, HOPE Fair Housing Center); William Loges(Oregon State University); Stephen Ross (University of Connecticut); Greg Squires (George WashingtonUniversity); and Shanna Smith (National Fair Housing Alliance).The authors also thank Urban Institute colleagues who contributed to the successful completion ofthis research. Specifically, the regional coordinators worked closely with the local testing organizationsto ensure tests were conducted to the highest standards, and they provided valuable input to the fullresearch team on testing protocols and analysis. Coordinators included Rani Bush, Maurice Destouet,Chris Healy, Katie Koopman, Thu Nguyen, and Sarale Sewell. David D’Orio designed the Web-baseddata system used to enter and share testing information, and he developed and managed the process forelectronically sampling ads from online sources; Austin Nichols, Jenny Kenney, and Tim Waidmannprovided helpful advice on analysis issues; Matt Rogers drafted the site-specific research findings andprovided other editorial and research support; Tim Meko turned data into infographics to help betterconvey findings; Fiona Blackshaw provided excellent editing and formatting services; and Tim Wareassisted us throughout the study with project administration, including preparations for this final report.Finally, Judson James and Carol Star from the U.S. Department of Housing and Urban Development’sOffice of Policy Development and Research provided excellent guidance and oversight throughout thisresearch effort.Despite the generous contributions from these individuals and organizations, any errors and omissionsthat may remain in this report are, of course, our own. All views expressed are those of the authors andshould not be attributed to the Urban Institute, its trustees, or its funders.
CONTENTSACKNOWLEDGMENTSEXECUTIVE SUMMARY xiI. INTRODUCTION 1Background 1Goals for the 2012 Housing Discrimination Study 2Strengths and Limitations of Paired Testing 3Organization of Report 4II. PAIRED TESTING PROTOCOLS AND FIELD MANAGEMENT 5Rental Testing Protocols 6Sales Testing Protocols 8Data Collection Oversight, Management, and Quality Control 9III. SAMPLING AND ANALYSIS METHODS 13Study Objectives 13Sample of Metropolitan Areas 14Sampled Sites and Targeted Tests 19Actual Tests Conducted 19Sampling Available Housing 22Analysis Weights 24Measuring Differential Treatment 27Multivariate Analyses of the Correlates of Differential Treatment 34IV. INCIDENCE OF DISCRIMINATION 39Rental Market Discrimination 39Sales Market Discrimination 50V. VARIATIONS IN DISCRIMINATION 65Change in Discrimination Over Time 65Metropolitan Estimates of Discrimination and Tests for the Influence of Housing Market Conditions 69Identifiability of Minority Homeseekers 72Multivariate Analysis of Variations in Discrimination 74APPENDICESAppendix A: HDS2012 Local Testing Organizations 79Appendix B: Master List of Asian and Hispanic Subgroups 81Appendix C: Tester Characteristics 85Appendix D: Rental Forms 89Appendix E: Sales Forms .115Appendix F: Metro-Specific Rental Estimates 137REFERENCES 163HOUSING DISCRIMINATION AGAINST RACIAL AND ETHNIC MINORITIES 2012 vii
LIST OF EXHIBITSExhibit ES-1: Minority Homeseekers Told About and Shown Fewer Housing Units xiExhibit ES-2: Call for Rental Appointment xiiiExhibit ES-3: In-Person Meeting with Rental Housing Provider xivExhibit ES-4: Inspect Available Rental Units xivExhibit ES-5: Minority Renters Told About and Shown Fewer Housing Units xvExhibit ES-6: Call for Sales Appointment xvExhibit ES-7: In-Person Meeting with Sales Agent xviExhibit ES-8: Inspect Available For-Sale Homes xviExhibit ES-9: Minority Homebuyers Told About and Shown Fewer Housing Units xviiExhibit ES-10: Long-Term Trends in Net Measures of Rental Discrimination xixExhibit ES-11: Recent Trends in Rental Discrimination xxExhibit ES-12: Long-Term Trends in Net Measures of Sales Discrimination xxExhibit ES-13: Recent Trends in Sales Discrimination xxiExhibit ES-14: Trends in Segregation of Whites from Blacks, Hispanics, and Asians xxiiExhibit III-1: Summary of HDS2012 Integrated Sampling Plan 15Exhibit III-2: Distribution of 28 Distinct Sites by Racial/Ethnic Testing and Self-RepresentingStatus for the HDS Sample 15Exhibit III-3: HDS Certainty Metro Sites by Minority Testing Configuration 16Exhibit III-4: Self-Representing Metropolitan Areas 16Exhibit III-5: Sampling Strata for the 2012 HDS 17Exhibit III-6: Number of Sites Sampled by Stratum and Race/Ethnic Group 18Exhibit III-7: Site Selections and Target Numbers of Tests by Sampling Stratum 20Exhibit III-8: In-Person Paired Tests Conducted by Site, Race-Ethnic Group and Test Type Actual Number of Tests 21Exhibit III-9: Stratum Weights for HDS Analysis 26Exhibit III-10: Formulation of Gross and Net Adverse Treatment in a Paired Testing Design 32Exhibit III-11: Illustration of Tabular Analyses of Adverse Treatment in Rental Housing Seeking Among Blacks 32Exhibit III-12: Illustration of Tabular Analyses of Adverse Treatment for Number of Inspections of Rental Housing 33Exhibit IV-1: Summary Measures of Discrimination Against Minority Renters 40Exhibit IV-2: Information and Availability Indicators for White and Black Renters 41Exhibit IV-3: Inspections and Unit Problem Indicators for White and Black Renters 42Exhibit IV-4: Financial Indicators for White and Black Renters 43Exhibit IV-5: Comments and Helpfulness Indicators for White and Black Renters 44Exhibit IV-6: Information and Availability Indicators for White and Hispanic Renters 45viii HOUSING DISCRIMINATION AGAINST RACIAL AND ETHNIC MINORITIES 2012
Exhibit IV-7: Inspections and Unit Problem Indicators for White and Hispanic Renters 45Exhibit IV-8: Financial Indicators for White and Hispanic Renters 46Exhibit IV-9: Comments and Helpfulness Indicators for White and Hispanic Renters 47Exhibit IV-10: Information and Availability Indicators for White and Asian Renters 48Exhibit IV-11: Inspections and Unit Problem Indicators for White and Asian Renters 48Exhibit IV-12: Financial Indicators for White and Asian Renters 49Exhibit IV-13: Comments and Helpfulness Indicators for White and Asian Renters 50Exhibit IV-14: Summary Measures of Discrimination Against Minority Homebuyers 51Exhibit IV-15: Information and Availability Indicators for White and Black Homebuyers 53Exhibit IV-16: Inspections and Unit Problems Indicators for White and Black Homebuyers 53Exhibit IV-17: Financial Indicators for White and Black Homebuyers 54Exhibit IV-18: Comments and Helpfulness Indicators for White and Black Homebuyers 55Exhibit IV-19: Steering Indicators for White and Black Homebuyers 56Exhibit IV-20: Information and Availability Indicators for White and Hispanic Homebuyers 57Exhibit IV-21: Inspections and Unit Problems Indicators for White and Hispanic Homebuyers 57Exhibit IV-22: Financial Indicators for White and Hispanic Homebuyers 58Exhibit IV-23: Comments and Helpfulness Indicators for White and Hispanic Homebuyers 59Exhibit IV-24: Steering Indicators for White and Hispanic Homebuyers 60Exhibit IV-25: Information and Availability Indicators for White and Asian Homebuyers 61Exhibit IV-26: Inspections and Unit Problems Indicators for White and Asian Homebuyers 61Exhibit IV-27: Financial Indicators for White and Asian Homebuyers 62Exhibit IV-28: Comments and Helpfulness Indicators for White and Asian Homebuyers 63Exhibit IV-29: Steering Indicators for White and Asian Homebuyers 64Exhibit V-1: Comparable Measures of Discriminatory Treatment for Renters, HDS2000 and HDS2012 66Exhibit V-2: Comparable Measures of Discriminatory Treatment for Homebuyers, HDS2000 and HDS2012 67Exhibit V-3: Longer-Term Trends in Discriminatory Treatment of Blacks and Hispanics 68Exhibit V-4: Metropolitan Estimates of Discrimination Against Black Renters 69Exhibit V-5: Metropolitan Estimates of Discrimination Against Hispanic Renters 70Exhibit V-6. Metropolitan Housing Market Conditions and Levels of Differential Treatment Estimates fromAlternative Regression Models of the Difference in Number of Units Shown 71Exhibit V-7: Racial/Ethnic Identifiability of Testers 72Exhibit V-8: Racial/Ethnic Identifiability and Levels of Differential Treatment 73Exhibit V-9: Sources of Variation in Discrimination Against Renters Regression Modelsof the Difference in Number of Units Shown 75Exhibit V-10: Sources of Variation in Discrimination Against Homebuyers Regression Models of Difference in Number ofUnits Shown 77HOUSING DISCRIMINATION AGAINST RACIAL AND ETHNIC MINORITIES 2012 ix
x HOUSING DISCRIMINATION AGAINST RACIAL AND ETHNIC MINORITIES 2012
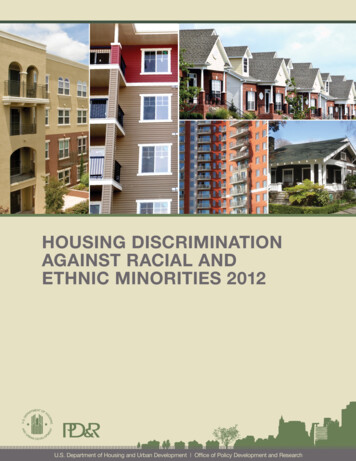
Executive SummaryEXECUTIVE SUMMARYFor much of the twentieth century, discrimination by private real estate agents and rental propertyowners helped establish and sustain stark patterns of housing and neighborhood inequality. Beginning inthe late 1970s, the Department of Housing and Urban Development (HUD) has rigorously monitoredtrends in racial and ethnic discrimination in both rental and sales markets approximately once eachdecade through a series of nationwide paired-testing studies. This summary report presents findings fromthe fourth such study, which applied paired-testing methodology in 28 metropolitan areas to measure theincidence and forms of discrimination experienced by black, Hispanic, and Asian renters andhomebuyers.1When well-qualified minorityhomeseekers contact housing providersto inquire about recently advertisedhousing units, they generally are justas likely as equally qualified whitehomeseekers to get an appointmentand learn about at least one availablehousing unit. However, whendifferences in treatment occur,white homeseekers are more likelyto be favored than minorities. Mostimportant, minority homeseekers aretold about and shown fewer homes andapartments than whites (Exhibit ES-1).2Although the most blatant forms of housing discrimination (refusing to meet with a minorityhomeseeker or provide information about any available units) have declined since the first nationalpaired-testing study in 1977, the forms of discrimination that persist (providing information about fewerunits) raise the costs of housing search for minorities and restrict their housing options. Looking forward,national fair housing policies must continue to adapt to address the patterns of discrimination anddisparity that persist today.1Based on standard U.S. Census Bureau practice, this report uses the term “Asian” to refer to all Asian and Asian American testers. In addition, the term “white” refers to non-Hispanic whites.All reported differences between minority and white treatment are statistically significant at the 0.90 level or higher. For specific tests of statistical significance, see the exhibits in Chapters IVand V.2HOUSING DISCRIMINATION AGAINST RACIAL AND ETHNIC MINORITIES 2012 xi
Executive SummaryThere can be no question that the housingcircumstances of whites and minoritiesdiffer substantially. Whites are morelikely to own their homes, to occupybetter quality homes and apartments,and to live in safer, more opportunityrich neighborhoods. However, it is lessobvious whether—or how much—thesedisparities result from current racial andethnic discrimination in the housingmarket because whites and minoritiesdiffer systematically in employment,income, assets, and debts.In this study More than 8,000 tests were conducted in anationally representative sample of 28 metropolitan areas. Ineach test, two trained individuals—one white and the otherblack, Hispanic, or Asian—contacted a housing provider toinquire about a housing unit randomly selected from recentlyadvertised homes and apartments. The two testers in eachpair were matched on gender and age, and both presentedthemselves as equally and unambiguously well-qualified to rentor buy the advertised unit. Each tester independently recordedthe treatment he or she experienced, including information aboutall the homes or apartments recommended and shown.Paired testing offers a uniquely effective tool for directly observing differential treatment of equallyqualified homeseekers, essentially catching discrimination in the actIn a paired test, two people, one white and the other minority, pose as equally qualified homeseekers andinquire about available homes or apartments. Researchers have adapted the tool to systematically measure howoften discrimination occurs across housing markets and what forms it takes.3Despite its power, paired testingcannot capture all forms of housingdiscrimination that might occur duringa housing search. For example, it doesnot encompass differences in advertisingpractices that may limit a homeseeker’sknowledge about available housingoptions. It cannot measure differencesin treatment that might occur after theinitial inquiry—when homeseekerssubmit applications, seek mortgagefinancing, or negotiate lease terms.Moreover, the results presented heredo not reflect the experience of theaverage or typical minority homeseeker,because testers presented themselves asunambiguously well-qualified for theadvertised homes and apartments aboutUnderstanding the numbers Not every instance ofwhite-favored treatment should be interpreted as systematicdiscrimination. In some tests, random factors may contributeto observed differences in treatment; in other tests, minoritiesmay experience more favorable treatment than their whitepartners for systematic reasons. Therefore, we report the shareof tests in which the white was favored over the minority, theshare in which the minority was favored over the white, and thedifference between the two. This difference—or net measure—provides a conservative, lower-bound estimate of systematicdiscrimination against minority homeseekers, because it notonly subtracts random differences from the gross measure ofwhite-favored treatment, but may also subtract some differencesthat reflect systematic reverse discrimination. Gross measuresof discrimination receive less emphasis in this report than inpast national studies because analysis over the past 25 yearsstrongly suggests that they reflect a lot of random differencesin treatment, and that net measures more accurately reflect thesystematic disadvantages faced by minority homeseekers.This study focuses on differential treatment discrimination—when equally qualified homeseekers receive unequal treatment from housing providers. For methodological details, see Chapters IIand III. Federal law also prohibits forms of treatment that may appear equal on their face but that have a disparate impact on minority homeseekers.3xii HOUSING DISCRIMINATION AGAINST RACIAL AND ETHNIC MINORITIES 2012
Executive Summarywhich they inquired.4 Evidence from other research suggests that when testers pose as more marginallyqualified homeseekers, more discrimination occurs (Hunter and Walker 1996). For all these reasons,results reported here probably understate the total level of discrimination that occurs in the marketplace.People of color still face discrimination when they search for housing todayEach paired test in this study compares the treatment of whites and minorities at three critical steps in thesearch for housing:1. First, testers attempted (by telephone or e-mail) to make appointments for in-person visits.2. If successful, they used the in-person visit to learn about available homes or apartments.3. Finally, if told about at least one available housing unit, testers sought to inspect homes or apartments.The discussion and exhibits that follow summarize the main findings at each of these three steps, first forrenters and then for homebuyers.Discrimination against minority renters. Minority renters who call to inquire about recently advertised homesor apartments are rarely denied appointments that their white counterparts are able to make. In the vast majorityof tests, if one tester is able to make an appointment, then both are. The very small treatment differences favorneither whites nor minorities (Exhibit ES-2).When renters meet in person with housing providers, they are almost always told about at least oneavailable unit. However, Hispanic renters are slightly more likely than equally qualified whites to betold that no homes or apartments are available (1.8 percentage points). Moreover, in about half of allin-person visits, one tester is told about more available units than the other, with whites significantlyAll testers were assigned financial characteristics that qualified them for the housing units about which they were inquiring. Therefore, the assigned income levels varied widely, matching thevariation in advertised rents and home prices in the sampled metropolitan areas. However, in most metropolitan areas, average incomes among black, Hispanic, and Asian households are lowerthan the average incomes assigned to testers.4HOUSING DISCRIMINATION AGAINST RACIAL AND ETHNIC MINORITIES 2012 xiii
Executive Summarymore likely to be favored than minorities, as detailed in Exhibit ES-3. Black, Hispanic, and Asianrenters are all told about fewer housing units than equally qualified white renters. Blacks and Hispanicsare told about one fewer unit for every five in-person visits; Asians are told about one fewer unit forevery six in-person visits.Finally, in about one-third of in-personFor example In one rental test, the white tester arrived firstvisits, one tester is shown more unitsand asked to see a two-bedroom apartment. The agent showedthan his or her partner, with whiteshim the available two-bedroom unit as well as a one-bedroomsignificantly more likely to be favoredapartment and provided application information for both units.than minorities. As Exhibit ES-4 details,The Hispanic tester arrived two hours later at the same office, butblack, Hispanic, and Asian renters are allwas told that nothing was available.shown significantly fewer housing unitsthan equally qualified whites. Blacks areshown about one fewer unit for every 25 visits; Hispanics are shown one fewer unit for every 14 visits; andAsians are shown one fewer unit for every 13 visits.xiv HOUSING DISCRIMINATION AGAINST RACIAL AND ETHNIC MINORITIES 2012
Executive SummaryTaking all three steps into account (ability to make an appointment, availability of units, and agents’willingness to show units), minority renters are told about and shown fewer homes and apartments thanequally qualified whites (Exhibit ES-5). Black renters who contact agentsabout recently advertised housingunits learn about 11.4 percentfewer available units than equallyqualified whites and are shown 4.2percent fewer units. Hispanic renters learn about 12.5percent fewer available units thanequally qualified whites and areshown 7.5 percent fewer units. Asian renters learn about 9.8percent fewer available units thanequally qualified whites and areshown 6.6 percent fewer units.Minority renters sometimes experience other forms of discriminatory treatment as well, relating tohousing costs and quality and the helpfulness of the rental agent. These differences are less consistent andsmaller in magnitude than the differences in numbers of units available and shown. Details will be foundin Chapter IV.Discrimination against minority homebuyers. Like renters, minority homebuyers are rarely deniedappointments that their white counterparts are able to make (Exhibit ES-6). However, black homebuyers areslightly more likely than equally qualified whites to be denied an in-person appointment (2.4 percentage points).HOUSING DISCRIMINATION AGAINST RACIAL AND ETHNIC MINORITIES 2012 xv
Executive SummaryWhen homebuyers meet in person with housing providers, they are usually told about at least oneavailable unit. However, agents frequently tell one tester about more available homes than the other, withwhites significantly more likely to be favored than blacks and Asians, as illustrated in Exhibit ES-7.Consequently, for every two visits, black and Asian homebuyers learn about one fewer home than equallyqualifie
HOUSING DISCRIMINATION AGAINST RACIAL AND ETHNIC MINORITIES 2012 Prepared for: U.S. Department of Housing and Urban Development Washington, D.C.