Transcription
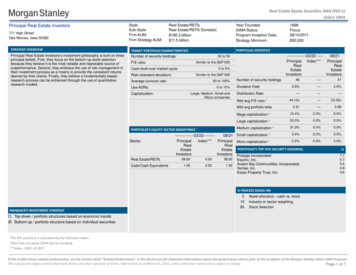
Real Estate Equity Securities SMA (PGI-1)Select UMAPrincipal Real Estate Investors711 High StreetDes Moines, Iowa 50392Style:Sub-Style:Firm AUM:Firm Strategy AUM:Real Estate/REITsReal Estate/REITs Domestic 106.3 billion 11.5 billionSTRATEGY OVERVIEWTARGET PORTFOLIO CHARACTERISTICSPrincipal Real Estate Investors's investment philosophy is built on threeprincipal beliefs. First, they focus on the bottom-up stock selectionbecause they believe it is the most reliable and repeatable source ofoutperformance. Second, they embrace the use of risk management intheir investment process as a means to provide the consistent returnsdesired by their clients. Finally, they believe a fundamentally basedresearch process can be enhanced through the use of quantitativeresearch models.Number of security holdings:Year Founded:GIMA Status:Program Inception Date:Strategy Minimum:PORTFOLIO torsInvestors30 to 50Similar to the S&P 500P/E ratio:0 to 5%Cash level over market cycle:Similar to the S&P 500Risk (standard deviation):50 to 100%Average turnover rate:0 to 10%Use ADRs:Large, Medium, Small andMicro companiesCapitalization:Number of security holdingsDividend YieldDistribution RateWtd avg P/E ratio ¹PORTFOLIO'S EQUITY SECTOR WEIGHTINGS Real Estate/REITsCash/Cash 30x0.91—0.89Mega capitalization 10.4%0.0%0.0%Large capitalization 53.0%0.0%0.0%Medium capitalization 31.0%0.0%0.0%0.0%0.0%0.0%0.0%Wtd avg portfolio betaSector1998Focus08/10/2011 50,0003.4%---------------03/22--------09/21 Small capitalization ------2.2%PrincipalIndex***Principal Micro capitalization RealRealEstateEstate PORTFOLIO'S TOP FIVE SECURITY HOLDINGSInvestorsInvestors Prologis Incorporated99.000.0099.001.000.001.00Equinix, Inc.Avalon Bay Communities, IncorporatedVentas, Inc.Essex Property Trust, Inc.%7.75.75.54.94.6% PROCESS BASED ONMANAGER'S INVESTMENT STRATEGY01585Asset allocation - cash vs. stockIndustry or sector weightingStock Selection Top-down / portfolio structures based on economic trends Bottom-up / portfolio structure based on individual securities¹The P/E used here is calculated by the harmonic mean. Total may not equal 100% due to rounding.***Index : MSCI US REITIf this profile shows related performance, see the section titled "Related Performance" in the disclosures for important information about the performance shown prior to the inception of the Morgan Stanley Select UMA Program.The subsequent pages contain important disclosures and a glossary of terms. Information as of March 31, 2022, unless otherwise noted and is subject to change.Page 1 of 7
Real Estate Equity Securities SMA (PGI-1)Select UMAMANAGER'S INVESTMENT PROCESSRISK CONSIDERATIONS Research-Fundamental based approach, in-depth company studies,proprietary back-tested model ranks stocks Security Selection-Team collaboration to develop strategy, teammembers make recommendations on assigned stocks Portfolio construction-Bottom-up process, portfolio managers jointlydetermine positions and weightings, risk review Portfolio Monitoring-Analysis of security, sector and style impact,continuous attribution analysisInvesting in securities entails risks, including: Real EstateInvestment Trusts, REITs and the portfolios that invest in themare subject to risk, such as poor performance by the manager ofthe REIT, adverse changes to the tax laws or failure by the REITto qualify for tax-free pass-through of income under the Code. Inaddition, some REITs have limited diversification because theyinvest in a limited number of properties, a narrow geographicarea, or a single type of property. Also, the organizationaldocuments of a REIT may contain provisions that makechanges in control of the REIT difficult and time-consuming. Thevalue of real estate and the portfolios that invest in real estatemay fluctuate due to losses from casualty or condemnation,changes in local and general economic conditions,environmental conditions, supply and demand, interest rates,property tax rates, regulatory limitations on rents, zoning lawsand operating expenses. Growth investing does not guarantee aprofit or eliminate risk. The stocks of these companies can haverelatively high valuations. Because of these high valuations, aninvestment in a growth stock can be more risky than aninvestment in a company with more modest growthexpectations. Value investing does not guarantee a profit oreliminate risk. Not all companies whose stocks are consideredto be value stocks are able to turn their business around orsuccessfully employ corrective strategies which would result instock prices that do not rise as initially expected. Bonds ratedbelow investment grade may have speculative characteristicsand present significant risks beyond those of other securities,including greater credit risk and price volatility in the secondarymarket. Investors should be careful to consider these risksalongside their individual circumstances, objectives and risktolerance before investing in high-yield bonds. If a strategyexpects to hold a concentrated portfolio of a limited number ofsecurities, it should be noted that a decline in the value of theseinvestments would cause the portfolio’s overall value to declineto a greater degree than that of a less concentrated portfolio.PORTFOLIO'S ALLOCATION HISTORY (%) REITsCash/Cash Equivalents03/2212/2109/2106/21999999991111¹The P/E used here is calculated by the harmonic mean. Total may not equal 100% due to rounding.***Index : MSCI US REITIf this profile shows related performance, see the section titled "Related Performance" in the disclosures for important information about the performance shown prior to the inception of the Morgan Stanley Select UMA Program.The subsequent pages contain important disclosures and a glossary of terms. Information as of March 31, 2022, unless otherwise noted and is subject to change.Page 2 of 7
Real Estate Equity Securities SMA (PGI-1)Select UMAMorgan Stanley Composite Start Date:Strategy Inception Date:11/2020 ³—AVERAGE ANNUAL TOTAL RETURN (%) - PERIODS ENDING 03/31/22RateRISK/RETURN ANALYSIS - 5 YEARS ENDING 03/31/22RateofReturnsofReturnsStandard Deviation (%)INVESTMENT RESULTSPrincipal Real Estate Investors (Gross)Principal Real Estate Investors (Net)MSCI US REIT90-Day ISK VOLATALITY (%)Principal Real EstateInvestors (Gross)Principal Real EstateInvestors (Net)MSCI US REITAnnual Rates of Return (%)2014 2015 2016 2017 812.243.8417.781.8130.382.528.61PORTFOLIO'S QUARTERLY RETURNS (%)Quarter1Quarter2Quarter3Gross Net Gross Net Gross 581.761.14-4.66 -5.2617.19 16.55-22.36 -22.827.176.52-4.96 -5.583.603.00-0.57-1.147.106.47-9.66 -10.245.765.102.291.676.806.163.262.6412.49 11.8512.28 90.807.272.321.38Quarter4Gross lect UMA**01/01/22-03/31/22Number OfPrincipal Real Estate Investors(Gross)Principal Real Estate Investors(Net)MSCI US REITUp Qtrs.161615Down Qtrs.445PORTFOLIO DIVERSIFICATION - R²(INCEPTION THROUGH 12/14) Principal Real Estate Investors vs. MSCI US REIT Statistics are calculated using gross of fee performance 7414.1610 Year - Ending 03/31/222021 Annual Std. .6716.06PORTFOLIO'S RISK STATISTICS - “ PERIODS ENDING03/31/22 ¹ ²3 Year5 YearStandard DeviationStandard Deviation of PrimaryBenchmarkSharpe RatioSharpe Ratio of PrimaryBenchmarkAlphaBetaDownside RiskR-SquaredTracking ErrorInformation . Statistics are calculated using gross of feeperformance only.2. MSCI US REIT was used as the primarybenchmark and the 90-Day T-Bills Index as therisk-free benchmark.3. For more information on these dates please seethe glossary of term sectionSee important notes and disclosures pages for a discussion of the sources of the performance data used to calculate the performance results and related analyses shown above.If this profile shows related performance, see the section titled "Related Performance" in the disclosures for important information about the performance shown prior to the inception of the Morgan Stanley Select UMA Program.The subsequent pages contain important disclosures and a glossary of terms. Information as of March 31, 2022, unless otherwise noted and is subject to change.Page 3 of 7
Real Estate Equity Securities SMA (PGI-1)Select UMACOMPOSITE DISCLOSURESThe disclosures provided below apply to performance information in this profile, if any. Pastperformance is not a guarantee of future results. Actual individual account results may differfrom the performance shown in this profile. There is no guarantee that this investment strategywill achieve its intended results under all market conditions. Do not rely upon this profile as thesole basis for your investment decisions.Performance results in this profile are calculated assuming reinvestment of dividends and income.Returns for more than one calendar year are annualized and based on quarterly data. Returns forperiods of less than a calendar year show the total return for the period and are not annualized. Norepresentation is being made that any portfolio will or is likely to achieve profits or losses similar tothose shown. Returns will fluctuate and an investment upon redemption may be worth more or lessthan its original value. Performance shown does not reflect the impact of fees and expenses of theunderlying mutual fund and ETFs, as applicable.Sources of Performance Results and Other Data: The performance data and certain otherinformation for this strategy (including the data on page 1 of this profile) may include one or more ofthe following: (i) the performance results of a composite of Morgan Stanley accounts managed by thethird party investment manager, (ii) the performance results for accounts and investment productsmanaged by the third party investment manager, in the same or a substantially similar investmentstrategy outside of the applicable Morgan Stanley program, and/or (iii) in the case of Model PortfolioStrategies, the Model Portfolio Provider’s results in managing accounts outside of the Morgan StanleySelect UMA program prior to Model Portfolio Strategy’s inception in the Morgan Stanley Select UMAprogram . For periods through June 2012, the Fiduciary Services program operated through twochannels – the Morgan Stanley channel and the Smith Barney channel and any performance andother data relating to Fiduciary Services accounts shown here for these periods is calculated usingaccounts in only one of these channels.) Please note that the Fiduciary Services program was closedon January 2, 2018. Although the Fiduciary Services and Select UMA programs are both MorganStanley managed account programs, the performance results and other features of similar investmentstrategies in the two programs may differ due to investment and operational differences. Performancein one program is not indicative of potential performance in the other. For example, the individualinvestment strategies in Select UMA program accounts may contain fewer securities, which would leadto a more concentrated portfolio. The automatic rebalancing, wash sale loss and tax harvestingfeatures of the Select UMA program, which are not available in Fiduciary Services, also could causedifferences in performance. In addition, any performance results included in this profile that are basedon a third party investment manager’s accounts that are not part of the Morgan Stanley programaccounts or institutional accounts that are part of the Model Portfolio strategy may differ due toinvestment and operational differences as well. As such, performance results of the third partyinvestment manager's composites and the third party Model Portfolio Strategies may differ from thoseof Select UMA accounts managed in the same or a substantially similar investment strategy. Forexample, in the case of Model Portfolio Strategies, Morgan Stanley, as the investment manager, maydeviate from the Third Party Model Portfolios.Related Performance:The performance data represents the returns of a composite of 154 account(s) with a market value of 119.5 million as of 03/31/2022. The performance from December 1, 2020, consists of theperformance of all single style Select UMA accounts managed by the investment manager inaccordance with the investment strategy referenced above, subject to any other limitations referencedherein. Performance composites calculated by Morgan Stanley include all fee-paying portfolios with noinvestment restrictions. New accounts are included beginning with the second full calendar month ofperformance. Terminated accounts are removed in the month in which they terminate (but priorperformance of terminated accounts is retained). Performance is calculated on a total return basis andby asset weighting the individual portfolio returns using the beginning of period values.Morgan Stanley Performance:The composite consists of 154 account(s) with a market value of 119.5 million as of 03/31/2022. Inthis profile, the performance from February 1, 2010 through June 30, 2012 consists of accountsmanaged by the investment manager in this strategy in either the Morgan Stanley or the Smith Barneyform of the Fiduciary Services program. From July 1, 2012 through December 31, 2015, performanceconsists of all Fiduciary Services (FS) accounts managed by the investment manager in this strategy,subject to any other limitations stated in this profile. From January 1, 2016, performance consists ofthe performance of all FS accounts (as described in the previous sentence) as well as theperformance of all single style Select UMA accounts managed by the investment manager in thisstrategy, subject to any other limitations stated in this profile. Performance composites calculated byMorgan Stanley include all fee-paying portfolios with no investment restrictions. New accounts areincluded beginning with the second full calendar month of performance. Terminated accounts areremoved in the month in which they terminate (but prior performance of terminated accounts isretained). Performance is calculated on a total return basis and by asset weighting the individualportfolio returns using the beginning of period values.Real Estate Securities Account (Gross): Principal Real Estate Investors’s gross results do notreflect a deduction of the investment advisory fees charged by Principal Real Estate Investors, orprogram fees, if any, but are net of commissions charged on securities transactions.Net Performance for all Periods: Net performance results reflect a deduction of 0.6075% quarterly.This consists of three components: 0.5% maximum quarterly MS Advisory Fee and 0.0175% maximumquarterly Program Overlay Fee (which, together cover the services provided by Morgan Stanley), plus0.09% quarterly SMA Manager Fees (being the fee currently charged by Principal Real EstateInvestors to new clients for managing their assets in the Select UMA program). The SMA ManagerFees may differ from manager to manager, and managers may change their fee to new clients fromtime to time. If you select this manager for your account, check the SMA Manager Fees specified inthe written client agreement, in case these have changed since you received this profile. Historical netfees reflect the Advisory Fee Schedule as of October 1, 2018. Morgan Stanley program fees arecalculated quarterly for the performance illustrated in this profile, and have a compounding effect onperformance. The Morgan Stanley program fee, which differs among programs and clients, isdescribed in the applicable Morgan Stanley ADV brochure, which is available atwww.morganstanley.com/ADV or on request from your Financial Advisor or Private Wealth Advisor.Document approval date February 2013.If this profile shows related performance, see the section titled "Related Performance" in the disclosures for important information about the performance shown prior to the inception of the Morgan Stanley Select UMA Program.The subsequent pages contain important disclosures and a glossary of terms. Information as of March 31, 2022, unless otherwise noted and is subject to change.Page 4 of 7
Real Estate Equity Securities SMA (PGI-1)Select UMAFocus List, Approved List, and Watch Status:Global Investment Manager Analysis ("GIMA") uses two methods to evaluate investment products inapplicable advisory programs. In general, strategies that have passed a more thorough evaluation maybe placed on the "Focus List", while strategies that have passed through a different and lesscomprehensive evaluation process may be placed on the "Approved List". Sometimes an investmentproduct may be evaluated using the Focus List process but then placed on the Approved List insteadof the Focus List.Investment products may move from the Focus List to the Approved List, or vice versa. GIMA may alsodetermine that an investment product no longer meets the criteria under either evaluation process andwill no longer be recommended in investment advisory programs (in which case the investmentproduct is given a "Not Approved" status).GIMA has a "Watch" policy and may describe a Focus List or Approved List investment product asbeing on "Watch" if GIMA identifies specific areas that (a) merit further evaluation by GIMA and (b)may, but are not certain to, result in the investment product becoming "Not Approved". The Watchperiod depends on the length of time needed for GIMA to conduct its evaluation and for the investmentmanager to address any concerns. GIMA may, but is not obligated to, note the Watch status in thisreport with a "W" or "Watch" on the cover page.For more information on the Focus List, Approved List, and Watch processes, please see theapplicable Morgan Stanley ADV brochure (www.ms.com/adv). Your Financial Advisor or Private WealthAdvisor can provide on request a copy of a paper entitled "GIMA: At A Glance ".Overlay Managers or Executing Sub-Managers in some of Morgan Stanley’s Separately ManagedAccount programs may affect transactions through broker-dealers other than Morgan Stanley or ouraffiliates. If your manager trades with another firm, you may be assessed costs by the other firm inaddition to Morgan Stanley’s fees. Those costs will be included in the net price of the security, notseparately reported on trade confirmations or account statements. Certain managers have historicallydirected most, if not all, of their trades to outside firms. Information provided by managers concerningtrade execution away from Morgan Stanley is summarized s/pdfs/adv/sotresponse.pdf. For more informationon trading and costs, please refer to the ADV Brochure for your program(s), available atwww.morganstanley.com/ADV, or contact your Financial Advisor/Private Wealth Advisor.The portfolio may, at times, invest in exchange-traded funds (ETFs), which are a form of equitysecurity in seeking to maintain continued full exposure to the broad equity market.Morgan Stanley investment advisory programs may require a minimum asset level and, depending onyour specific investment objectives and financial position, may not be suitable for you. Investmentadvisory program accounts are opened pursuant to a written client agreement.Consulting Group’s unified managed account program, Select UMA, allows Financial Advisors tocombine separately managed accounts (SMAs), mutual funds and exchange-traded funds (ETFs)within a single investment advisory account for clients.ADDITIONAL DISCLOSURESActual account holdings, performance and other data will vary depending on the size of an account,cash flows within an account, and restrictions on an account. Holdings are subject to change daily. Theinformation in this profile is not a recommendation to buy, hold or sell securities.Actual portfolio statistics may vary from target portfolio characteristics.The Top Five Portfolio Holdings listed herein are provided for informational purposes only and shouldnot be deemed to be a recommendation to purchase or sell the securities mentioned. Portfoliocharacteristics in this profile are based on an allocation weight in the strategy model. There are noguarantees that any of the securities mentioned will be held in a client’s account. It should not beassumed that the securities transactions or holdings discussed were or will prove to be profitable.The Model Portfolio Provider or Investment Manager may use the same or substantially similarinvestment strategies, and may hold similar portfolios of investments, in other portfolios or products itmanages (including mutual funds). These may be available at Morgan Stanley or elsewhere, and maycost an investor more or less than this strategy in Morgan Stanley's Select UMA program.Certain strategies managed or sub-advised by us or our affiliates, including but not limited to MorganStanley Investment Management and Eaton Vance Management and its investment affiliates, may beincluded in your account. Morgan Stanley Global Investment Manager Analysis evaluates certaininvestment products for the purposes of some – but not all – of Morgan Stanley Smith Barney LLC’sinvestment advisory programs. Please contact your Morgan Stanley team and/or see the applicableForm ADV, which can be accessed at www.morganstanley.com/adv, for information about affiliatedinvestment products that are not reviewed or evaluated by GIMA, as well as additional disclosuresapplicable to affiliated products, that could be included in this strategy.Diversification does not guarantee a profit or protect against a loss.No obligation to notifyMorgan Stanley has no obligation to notify you when information in this profile changes.Sources of informationMaterial in this profile has been obtained from sources that we believe to be reliable, but we do notguarantee its accuracy, completeness or timeliness. Third party data providers make no warranties orrepresentations relating to the accuracy, completeness or timeliness of the data they provide and arenot liable for any damages relating to this data.No tax adviceMorgan Stanley and its affiliates do not render advice on legal, tax and/or tax accounting matters toclients. Each client should consult his/her personal tax and/or legal advisor to learn about any potentialtax or other implications that may result from acting on a particular recommendation.Not an ERISA fiduciaryIf this profile shows related performance, see the section titled "Related Performance" in the disclosures for important information about the performance shown prior to the inception of the Morgan Stanley Select UMA Program.The subsequent pages contain important disclosures and a glossary of terms. Information as of March 31, 2022, unless otherwise noted and is subject to change.Page 5 of 7
Real Estate Equity Securities SMA (PGI-1)Select UMAMorgan Stanley is not acting as a fiduciary under either the Employee Retirement Income Security Actof 1974, as amended, or under section 4975 of the Internal Revenue Code of 1986, as amended, inproviding the information in this profile.Bottom-Up Stock Selection Emphasis primarily on individual stock selection. Considerations ofeconomic and industry factors are of secondary importance in the investment decision-makingprocess. 2019 Morgan Stanley Smith Barney LLC Member SIPC.Capitalization is defined as the following: Mega (Above 100 billion), Large ( 12 to 100 billion),Medium ( 2.5 - 12 billion), Small ( .50 - 2.5 billion) and Micro (below .50 billion).INDEX DESCRIPTIONS90-Day T-BillsThe 90-Day Treasury Bill is a short-term obligation issued by the United States government. T-bills arepurchased at a discount to the full face value, and the investor receives the full value when theymature. The difference of discount is the interested earned. T-bills are issued in denominations of 10,000 auction and 1,000 increments thereafter.MSCI US REITThe MSCI US REIT Index is a free float-adjusted market capitalization weighted index that iscomprised of equity REITS that are included in the MSCI US Investable Market 2500 Index, with theexception of specialty equity REITs that do not generate a majority of their revenue and income fromreal estate rental and leasing operations. The index represents approximately 85% of the US REITuniverse.S&P 500The S&P 500 Total Return has been widely regarded as the best single gauge of the large cap U.S.equities market since the index was first published in 1957. The index has over 5.58 trillionbenchmarked, with index assets comprising approximately 1.31 trillion of this total. The indexincludes 500 leading companies in leading industries of the U.S. economy, capturing 75% coverage ofU.S. equities. This index includes dividend reinvestment.Distribution Rate is defined as the most recent distribution paid, annualized, and then divided by thecurrent market price. Distribution rate may consist of investment income, short-term capital gains,long-term capital gains, and /or returns of capital.Dividend a portion of a company's profit paid to common and preferred shareholders.Dividend Yield annual dividend per share divided by price per share. Dividend Yield for the portfolio isa weighted average of the results for the individual stocks in the portfolio.Downside Risk is a measure of the risk associated with achieving a specific target return. Thisstatistic separates portfolio volatility into downside risk and upside uncertainty. The downsideconsiders all returns below the target return, while the upside considers all returns equal to or abovethe target return.Duration is a measure of price sensitivity expressed in years.High Grade Corporate Bonds corporate bonds from issuers with credit ratings of AA or AAA.Information Ratio is a measure of the investment manager's skill to add active value against a givenbenchmark relative to how stable that active return has been. Essentially, the information ratio explainshow significant a manager's alpha is. Therefore, the higher the information ratio, the more significantthe alpha.Indices are unmanaged and have no expenses. You cannot invest directly in an index.GLOSSARY OF TERMSAlpha is a mathematical estimate of risk-adjusted return expected from a portfolio above and beyondthe benchmark return at any point in time.American Depositary Receipts (ADRs) are receipts for shares of a foreign-based corporation held inthe vault of a U.S. bank.Average Portfolio Beta is a measure of the sensitivity of a benchmark or portfolio's rates of return tochanges against a market return. The market return is the S&P 500 Index. It is the coefficientmeasuring a stock or a portfolio's relative volatility.Beta is a measure of the sensitivity of a portfolio's rates of return to changes in the market return. It isthe coefficient measuring a stock or a portfolio's relative volatility.Investment Grade Bonds are those rated by Standard & Poor's AAA (highest rated), AA, A or BBB (orequivalent rating by other rating agencies or, in the case of securities not rated, by the investmentmanager).Morgan Stanley Composite Start Date is the date when Morgan Stanley was able to start tocalculate the composite performance of the strategy using qualifying advisory accounts.Performance Inception Date is the date that the Investment Advisor started to calculate theperformance of the strategy.Program Inception Date is the date that the strategy was launched into the Select UMA program.Price/Book Ratio (P/B) weighted average of the stocks' price divided by book value per share. Bookvalue per share is defined as common equity, including intangibles, divided by shares outstandingtimes the adjustment factor.If this profile shows related performance, see the section titled "Related Performance" in the disclosures for important information about the performance shown prior to the inception of the Morgan Stanley Select UMA Program.The subsequent pages contain important disclosures and a glossary of terms. Information as of March 31, 2022, unless otherwise noted and is subject to change.Page 6 of 7
Real Estate Equity Securities SMA (PGI-1)Select UMAPrice/Cash Flow Ratio a ratio used to compare a company's market value to its cash flow. It iscalculated by dividing the company's market cap by the company' operating cash flow in the mostrecent fiscal year (or the most recent four fiscal quarters); or, equivalently, divide the per-share stockprice by the per-share operating cash flow.Price/Earnings Ratio (P/E Ratio) shows the multiple of earnings at which a stock sells. Determinedby dividing current stock price by current earnings per share (adjusted for stock splits). Earnings pershare for the P/E ratio are determined by dividing earnings for past 12 months by the number ofcommon shares outstanding. The P/E ratio shown here is calculated by the harmonic mean.Price/Sales Ratio determined by dividing current stock price by revenue per share (adjusted for stocksplits). Revenue per share for the P/S ratio is determined by dividing revenue for past 12 months bynumber of shares outstanding.R2 (R-Squared)/Portfolio Diversification indicates the proportion of a security's total variance that isbenchmark-related or is explained by variations in the benchmark.Sharpe Ratio measures the efficiency, or excess return per unit of volatility, of a manager's returns. Itevaluates managers' performance on a volatility-adjusted basis.Standard Deviation is a statistical measure of historical variability or spread of returns around amat
Principal Real Estate Investors (Gross) 17.61 12.55 Principal Real Estate Investors (Net) 17.53 9.89 MSCI US REIT 19.95 9.65 90-Day T-Bills 0.46 1.09 RISK VOLATALITY (%) benchmark and the 90 0.98 Principal Real Estate Investors 1. Statistics are calculated using gross of fee performance only. 2. MSCI US REIT was used as the primary