Transcription
Investment and Industrial Policy:A Perspective on the FutureUNCTAD TRADE AND DEVELOPMENT BOARD, SIXTY-FIFTH SESSIONPanel Discussion October 1, 2018CONFIDENTIAL AND PROPRIETARYAny use of this material without specific permission of McKinsey & Company is strictly prohibited
ContentsNew era of global flowsNew opportunities for economic growthNew world of policy challengesMcKinsey & Company 2
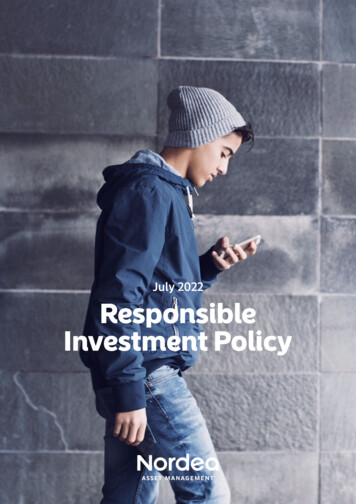
After 20 years of rapid growth, traditional flowsof goods, services, and finance have declined relative to GDPFinanceServiceGoodsFlows of goods, services, and finance, 1980–2017, trillion, currentFDI, 1980–2017, trillion, current4,10,5 0.9FDI as % of GDP1.90.1 0.2FDI512,7 3,3 2,3 2,0 2,1 2,1 2,1 1,92,6 2,5 1,82,3 1,71,71,4 1,6 2,01.51.41.40.90.8 0.60.6 0.71.21.41.9 1.91.6 1.6 1.41.3461.443353130272322222222296 65 5 5 643 3 3 3 3 3 3 4302824212610 9 108 91990SOURCE: UNCTAD; IMF Balance of Payments; World Bank; McKinsey Global Institute analysis28 27 28292825 25221817123533 3331 3123 2337 37 37353420198039 392624-16 p.p.391980 90 2000 01 02 03 04 05 06 07 08 09 10 11 12 13 14 15 16 201726All flows as% of GDP1310 112000200720102017McKinsey & Company 3
TradeHowever, at the same time,the world has entered the new era of digital globalizationFlow dynamics, relative to the year of peak value inFinanceData1980–20171Cross-border dataflows expected togrow 3.5x by 20211980859095200005101520201 Finance 2007 ( 12.2 trillion), Trade 2013 ( 23.5 trillion), Data 2017 (estimated 543 terabits per second of cross-border bandwidth used)SOURCE: McKinsey Global Institute’s “Digital Globalization: The New Era of Global Flows”McKinsey & Company 4
Globalization: Then vs. NowSOURCE: McKinsey Global Institute’s “Digital Globalization: The New Era of Global Flows”McKinsey & Company 5
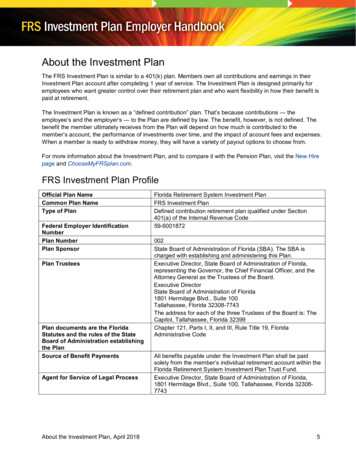
Cross-border data flows are surging and connecting more countriesUsed cross-border bandwidthRegionsNAUnited States and CanadaBandwidthGigabits per second (Gbps) 50EUEurope50–100ASAsia100–5002005100% 4.7 Terabits per second (Tbps)LALatin AmericaMEMiddle –20,0002014100% 211.3 TbpsEU 20,00045x largerEUNANAASASMEAFMEAFOCLAOCLANOTE: Lines represent interregional bandwidth (e.g., between Europe and Africa), but exclude intraregional cross-border bandwidth (e.g., connecting European nations with one another).SOURCE: TeleGeography, Global Internet Geography; McKinsey Global Institute analysisMcKinsey & Company 6
Digital technologies are changing how business is doneacross borders and broadening participationSOURCE: McKinsey Global Institute’s “Digital Globalization: The New Era of Global Flows”McKinsey & Company 7
ContentsNew era of global flowsNew opportunities for economic growthNew world of policy challengesMcKinsey & Company 8
How globalization increases GDPSOURCE: McKinsey Global Institute’s “Digital Globalization: The New Era of Global Flows”McKinsey & Company 9
Digitization is transforming business modelsin ways that enable more cross-border activityFlow typeDataGoodsServicesFinance FDICross-border implications of digitizationRemotemonitoringRemote tracking Remote maintenance Supply-chainmanagementRemote inventory management Supplier management Cross-border access to customers Cross-border access to labor Cross-border access to finance Centralized back-office operations Cross-border digital payments Real-time communications and collaboration Data sharing and analytics-driven decision making Access toglobalmarketsBusinessoperationsand strategySOURCE: McKinsey Global Institute analysis McKinsey & Company 10
Global flows account for approximately 10 percent of global GDP output;data flows account for a large (arguably largest) chunk of that contributionLong-term impact on level of%Goods tradeData flowsMigration2FDIAll flowsImpact onGDP, 20171 trillionGDP13,53,02,01,610,1Accounting for secondary effects of data flows – in that they enable trade flows, FDI, and even people flows –the impact of cross-border data flows on global GDP surpasses the impact of global goods trade1 Includes inflows and outflows data for 139 countries in MGI Global Flows model.2 Global migration flows declined slightly from 2003 to 2013, resulting in a positive impact despite a negative coefficient. Migration flows are negligible or slightly negative at the global level,possibly due to the loss of skilled labor in developing countries or the difficulties of absorbing a large influx of refugees or migrants. However, migration flows have a positive impact onproductivity in advanced economies.NOTE: Numbers may not sum due to rounding.SOURCE: McKinsey Global Institute analysisMcKinsey & Company 11
The MGI Connectedness Index1 shows that advanced economiesare generally more connected than developing countriesConnectedness score, 2014(Number in brackets represents the rank on the data connectedness sub-index2)EmergingSize of circle represents value of flows in 2014Developed70Correlation coefficient (r) 0.5465Netherlands (#1)6055Singapore (#6)United States(#7)Germany (#2)5045UnitedKingdom(#3)4035Ireland (#9)China (#38)France (#4)30Belgium (#8)Saudi Arabia (#53)25Russia (#25)2015India50ThailandMalaysiaSweden (#5)AustriaPortugalTurkeySwitzerland n(#16)MexicoUkraine10South KoreaUnited Arab Emirates (#46)Canada(#18)ItalyBrazilIndonesia10Greece Czech Republic2030Finland(#10)40506070Qatar801401 The McKinsey Global Institute Connectedness Index measures the connectedness of 131 countriesPer capita GDP, 2014across all five flows of goods, services, finance, people, and data and communication; thousand, purchasing power parity, current international dollarhe index reflects the level of inflows and outflows of all types of flows adjusted for country size2 Listed for the top 15 countries by MGI connectedness score and for top 10 countries based on data connectedness sub-index (where not overlapping)SOURCE: IMF; McKinsey Global Institute analysisMcKinsey & Company 12
Limited participation in global flows by many countries has had a realeconomic cost; going forward countries at the periphery of the world’sdigital networks stand to gain even more than those at the centerOutput gap% of GDP 7551–75 26–501–25While participation in global flows is not thepanacea for the other factors that may dampen acountry’s economic growth1, our analysis suggestssome countries may grow their GDP in thelong-term by over 50% by participating fullyin global flows 1No data Over time, participation in data flows will growin importance vs. traditional flows Unlike with traditional flows, countries on theperiphery of the global network of flowshave the most to gain from increasingcross-border data flows Countries benefit from receiving cross-border digitalflows as well as producing them; in other words,countries do not need to transformthemselves into digital content or platformproducers to benefit from data flows1 For example, uncompetitive business environment, weak rule of law, corruptionSOURCE: McKinsey Global Institute analysisMcKinsey & Company 13
ContentsNew era of global flowsNew opportunities for economic growthNew world of policy challengesMcKinsey & Company 14
Policy-makers need a clear agenda to capture the full potential of global flowsKey enablers for digitalization specifically1.Think strategically about the role the country can play in global value chains2.Address policy and administrative barriers that hinder global flows3.Address the dislocations4.Invest in human capital5.Build the necessary physical infrastructure and close the digital divide6.Create a strong business and institutional environment for the digital economy to thrive7.Maintain an open Internet while protecting privacy8.Make cybersecurity a top priorityCan data flows and ‘Digital’ economy be the enablers for some countriesto leapfrog in development, like they have been for tech businesses recently?SOURCE: McKinsey Global Institute analysisMcKinsey & Company 15
BACKUPMcKinsey & Company 16
The outlook also appears more challenged than a year agoDecline in the value of announced FDI projectsDeteriorating outlook of overall economic conditionsSOURCE: UNCTAD; Economic Conditions Snapshot, McKinsey Global Survey, September 2018; team analysisMcKinsey & Company 17
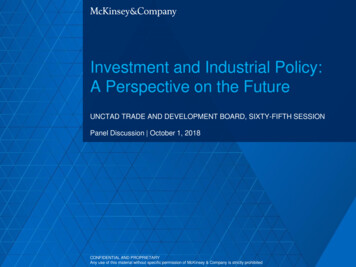
Data flows and traditional flows paint different pictures of the worldThe US is the largest producer of digital contentfor Internet users across the globeUnited States1China, the United States, or Germany isthe major trading partner for most countriesLargest trading partner in goods, 2014EuropeAsia PacificOtherLocation of top 100 websites requested by users% by user region, as of April 201588US and Canada66Latin America1656Africa183251Asia PacificEurope10 21736123261315Hosting location of top1 million websites, 20132%1 Includes United States and Canada for location of top 100 websites requested by users2 Based on Pingdom analysis of Alexa top 1 million websites12100% 1 millionwebsites4231NOTE: Data omitted for some small nations as indicated in graySOURCE: : UNCTAD; TeleGeography, Global Internet Geography; Pingdom; McKinsey Global Institute analysisMcKinsey & Company 18
Flows remain concentrated among a few leading countries,however data flows show more broadening of scope than others% of world totalTop 15 countriesGlobal goods flow distributionGlobal services flow distribution20052005201413 19.0trillion2314 2.5trillion22636623 4.9trillionGlobal FDI flow distributionGlobal data flow distribution200520142005451716 1.39trillion20142716 1.63trillion79626511All others20141314 10.6trillion21Next 20 countries4.8Tbps17986211Tbps1771 Tbps terabits per secondNOTE: Numbers may not sum due to roundingSOURCE: : UNCTAD; IMF; TeleGeography, Global Internet Geography; McKinsey Global Institute analysisMcKinsey & Company 19
The biggest online platforms have user baseson par with the populations of the world’s biggest countriesActive users of online platforms vs. country population, millionOnline tagram400United l2562051 4Q15 or latest available2 2015 populationSOURCE: Facebook; Twitter; Alibaba; Fortune; Statista; Population Reference Bureau; McKinsey Global Institute analysisMcKinsey & Company 20
Individuals are participating in globalization,and 914 million have cross-border social media connectionsSocial networking users withat least one foreign connection914 millionPeople living outsidehome country244 millionInternationaltravelers429 millionCross-borderonline workers44 millionCross-borderonline students13 millionCross-bordere-commerce shoppers361 millionStudentsstudying abroad5 millionNOTE: Numbers adjusted to account for overlap between platforms and for individuals making multiple international trips in the same year.SOURCE: Facebook; AliResearch; US Department of Commerce; OECD; World Bank; McKinsey Global Institute analysisMcKinsey & Company 21
MGI Connectedness Index (1/2)Country connectedness index and overall flows data, 2014Rank of participation by flow as measured by flow intensity and share of world totalConnectedness index 6CountrySingaporeNetherlandsUnited StatesGermanyIrelandUnited KingdomChinaFranceBelgiumSaudi ArabiaUnited Arab .710.610.510.09.81–1011–25Connectedness Index 618441381810Flow intensity low value 53062,498176133100 170–99 702Flow intensity% of 81878016215354831011 Flows value represents total goods, services, and financial inflows and outflows.2 Flow intensity represents the total value of goods, services, and financial flows as a share of the country’s GDP.SOURCE: McKinsey Global Institute analysisMcKinsey & Company 22
MGI Connectedness Index (2/2)Country connectedness index and overall flows data, 2014Rank of participation by flow as measured by flow intensity and share of world totalConnectedness index 738386118CountryAustraliaDenmarkJordanIndiaCzech urkeyIsraelBrazilChileGreeceNew ZealandIndonesiaSouth s Index 24610370233824125102352510664525673128104119Flow intensity 984991Flow value 23916013050427723010415826812235100 170–99 702Flow intensity% of 197554760581 Flows value represents total goods, services, and financial inflows and outflows.2 Flow intensity represents the total value of goods, services, and financial flows as a share of the country’s GDP.SOURCE: McKinsey Global Institute analysisMcKinsey & Company 23
% by user region, as of April 2015 42 31 12 15 100% 1 million websites United States1 Europe Asia Pacific Other Hosting location of top 1 million websites, 20132 % 1 Includes United States and Canada for location of top 100 websites requested by users 2 Based on Pingdom analysis of Alexa top 1 million websites