Transcription
Software Company UpdateSeptember 20, 2019Anaplan, Inc. (PLAN)MARKET OUTPERFORMPrice: 51.00Price Target: 62.00May Have Won a Big Deal with AmazonPatrick Walravenspwalravens@jmpsecurities.com(415) 835-8943INVESTMENT HIGHLIGHTS We maintain our Market Outperform rating and 62 price target on Anaplanafter our due diligence suggests that the company may have recently closeda multi-million dollar per year deal with Amazon (AMZN, MO, 2,275, Josey)and that the opportunity to expand in that account could be multiple timesthe original contract size. An Anaplan spokesperson declined to comment on this potential transaction;however, we note that: 1) Amazon posted a job description on May 7 andMARKET DATAPrice 51.0052-Week Range: 20.37 - 60.36Shares Out. (M):153.0Market Cap ( M): 7,803.0Average Daily Vol. (000):2,167.0Source: Thomson Reuters and JMP Securities LLCupdated it 20 days ago looking for a “Sales Operations Program Manager,”2021E2022ERevenue ( M) 1Q 75.8A 101.5 128.92Q 84.5A 107.9 137.23Q 86.3 109.9 139.84Q 95.6 121.7 153.2FY 342.3 441.0 559.11Q( 0.16)A( 0.11)( 0.03)2Q( 0.12)A( 0.12)( 0.02)3Q( 0.13)( 0.11)( 0.01)4Q( 0.10)( 0.07) 0.01FY( 0.51)( 0.41)( 0.05)CY( 0.41)NANAIncentive programs, data issue resolution”; 2) at the Anaplan CPX user conferencein June, executives from Amazon and Anaplan conducted a brief demonstration ofhow the combined power of Anaplan and Amazon Forecast could address certainEPS We continue to like Anaplan’s mission of driving connected planning and expectbusiness momentum to continue because the company: 1) seems to havegreenfield opportunities with limited competition across finance, sales, and supplychain planning; 2) still has lots of room for improving sales productivity as the salesEPS estimate of ( 0.05) (consensus ( 0.17)) on revenue growth of 27%. Anaplan currently trades at a CY21 EV/revenue multiple of 13.5x, while our 62price target implies a multiple of 16.6x, an 15% premium to the peer groupmedian multiple. We believe this premium is deserved as Anaplan is expected togrow faster than the peer group and operates in a large market with relatively lowVolume (mil.)Price (USD) 70.00 60.0015 50.0010 40.00 30.005 20.000 10.00competition.FOR DISCLOSURE AND FOOTNOTE INFORMATION, REFER TO JMP FACTS AND DISCLOSURES SECTION.This report should be read in conjunction with important disclosure information, including an attestation under Regulation Analyst certification.Sep-19(consensus ( 0.45)) on revenue growth of 29%, and maintain our FY22 non-GAAP20Aug-19on revenue growth of 42%, maintain our FY21 non-GAAP EPS estimate of ( 0.41)STOCK PRICE PERFORMANCEJul-19 We maintain our FY20 non-GAAP EPS estimate of ( 0.51) (consensus ( 0.52))Jun-19on our due diligence.Dec-18(GOOGL, MO, 1,450 PT, Josey) earlier this year and now one with Amazon, basedSource: Company reports and JMP Securities LLCNov-18force ramps; and 3) seems to continue to land large deals like the one with GoogleApr-19companies before now.May-19demand-planning problems — so there has been some interaction between theMar-19Territory Planning, Quota Development, Sales Performance Management, Sales2020EJan-19platform solutions (Anaplan, similar)” to drive “core Sales Operations processes —FY JANFeb-19which included qualifications of “Experience with Sales Performance Management
Anaplan, Inc. (PLAN)JOB POSTINGFigure 1 below outlines an excerpt from the Sales Operations Program Manager job posting thatmentions “experience with Sales Performance Management platform solutions (Anaplan, similar)preferred.”FIGURE 1. Sales Operations Program Manager Job PostingSource: Amazon.jobsSeptember 20, 20192
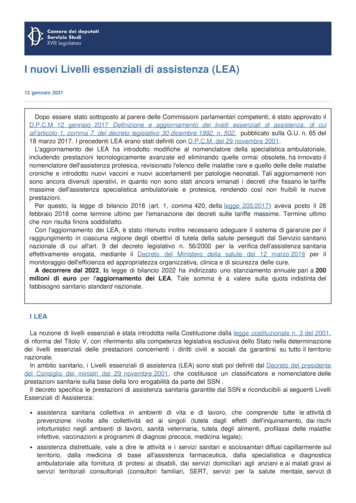
Anaplan, Inc. (PLAN)AMAZON FORECASTAt Anaplan’s CPX user conference in June, two executives from Anaplan, Senior Director of ConsumerProducts and Retail Ara Gopal and Director of Product Management AI/ML Lior Gerling, as well asAWS Solutions Architect Chris King, hosted a session called: “Putting Those Insights to Use: InjectIntelligence and Predictive Capabilities into Planning.” The session focused around a demonstration ofAmazon Forecast and Anaplan. Amazon Forecast was designed to better understand how to improvetime-series forecasting across the entire Amazon business. Amazon Forecast enables customers toleverage the 20 years of experience in forecasting at Amazon with no machine learning experiencerequired, and includes five deep-learning algorithms and three traditional statistical methods. Mr. Kingcommented, “We wanted to build a service that would look to kind of bridge those gaps and allow youtake any custom data that you have — generate your own model that can actually be executed on andthen be able to integrate it with really advanced decision making technologies like those provided byAnaplan to operationalize your business more effectively.” He then shared the deep-learning algorithmsare up to 50% more performant than traditional approaches (on datasets with over 1,000 time series).The Amazon Forecast service ingests historical data of whatever a customer is trying to predict (e.g.,sales, pricing, inventory) and related data (e.g., weather, special offers, product details); it thengenerates an API that outputs a forecast which can then be leveraged by a planning solution likeAnaplan. Once the predictions have been communicated to Anaplan, the solution will consume thepredictions to better assist the Anaplan user with decision making.During the Q&A portion of the session, an attendee asked when it would make sense to use one ofthese services compared to the other, or are they complementary. Mr. Gerling responded, “We are aplatform of planning where we give [all of the] tools for our users to build the plans, [very modular],customize whatever you need our idea is to actually help you to go and to seamlessly integrate withthose solutions similar to how we seamlessly integrate with AWS and with Salesforce and Google.” Mr.Gopal added that “it also comes down to use case, for certain types of problems, certain engines tendto perform better, so you want to provide that option of you get to choose which engine you want touse.” Figure 2 below outlines the demonstration overview.FIGURE 2. Intelligent Demand PlanningSource: AnaplanSeptember 20, 20193
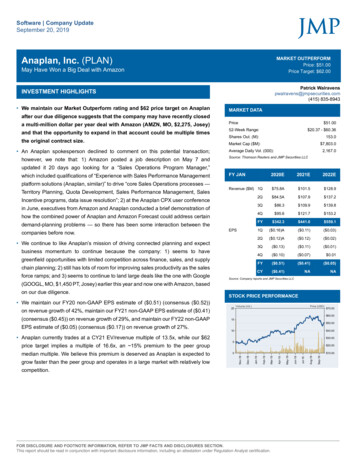
Anaplan, Inc. (PLAN)GARTNER MAGIC QUADRANTFigure 3 below outlines the Gartner Magic Quadrant for Sales and Operations Planning Systems ofDifferentiation from May 2019. As shown, Anaplan is included as a leader, along with: 1) SAP (SAP,MO, 150 PT); 2) OM Partners; 3) Kinaxis; 4) Arkieva; 5) JDA; 6) o9 Solutions; 7) Adexa; 8) DELMIAQuintiq; and 9) Logility.FIGURE 3. Gartner Magic Quadrant for Sales and Operations Planning Systems ofDifferentiationSource: Gartner Magic Quadrant for Sales and Operations Planning Systems of Differentiation, May 2019September 20, 20194
Anaplan, Inc. (PLAN)Anaplan’s strengths, according to Gartner, include: 1) the company’s reference customers reportedabove-average levels of overall satisfaction; 2) Anaplan scored above average in 12 of the 13 keyS&OP technology capabilities, such as global planning support, simple user interface, and projectplanning; 3) Anaplan’s vision for supply modeling, scenario planning, and collaboration are above theaverage in the market; and 4) Anaplan scored above average for financial impact and financial planningdecisions.Anaplan’s cautions, according to Gartner, include: 1) scored below average in terms of its S&OPcapability coverage and the number of customers it has for S&OP; 2) reference customers reportedbelow-average levels of satisfaction with Anaplan’s domain expertise and implementation services; 3) abelow-average geographic strategy; and 4) Anaplan’s reference customers communicated a belowaverage future buying intentions in the second year, and Gartner points to Anaplan’s recent entry intothe supply chain market.September 20, 20195
Anaplan, Inc. (PLAN)F3Q20 EXPECTATIONSFor F3Q20, we expect Anaplan to generate total revenue of 86.3M, up 39% y/y, versus the consensusof 86.2M. We look for non-GAAP operating margin of negative 19.1%, versus the consensus ofnegative 19.5%, and non-GAAP EPS of negative 0.13, in line with the consensus. We look for billingsof 100.3M, up 39% y/y, versus the consensus of 98.7M.September 20, 20196
000s, unless otherwise notedFY end Jan.RevenueSubscription revenuey/y growthsequential growth% of totalProfessional services revenuey/y growthsequential growth% of totalTotal revenuey/y growthsequential 0027%965,00026%DriversCustomers (net new)204Customers (ending)434y/y growthsequential growthCustomers (avg)332Subscription Rev. / Avg. Cust. ( 000, Annual)153y/y growthsequential growthKey metricsDeferred Revenue (net new)Deferred Revenue (ending)y/y growthsequential growthBillingsy/y growthsequential growthDollar-based net expansion rateCustomers with 250K ARR (ending)y/y growth% of total customersRPOy/y growth304,600Source: JMP Securities LLC and Company 58%674,12827%120%Anaplan, Inc. (PLAN)September 20, 2019FIGURE 4. PLAN Revenue Drivers7
000s, unless otherwise notedFY end Jan.Non-GAAPSubscription revenuey/y growthsequential growth% of totalProfessional services revenuey/y growthsequential growth% of totalTotal revenuey/y growthsequential growthCost of revenue - subscriptionCost of revenue - professional servicesTotal cost of revenueGross profit - subscriptiongross margin - subscriptionGross profit - professional servicesgross margin - professional servicesGross profit - totalgross margin - totalR&D% of revenueS&M% of revenueG&A% of revenueTotal Op-Ex% of revenueIncome from Operationsoperating marginInterest income, netOther income (expense), netPretax incomeProvision for income taxesrateNet incomeEPSShares - basicsequential growthShares - dilutedsequential %89(411)(23,615)553-2%(24,168)( 739,02251,33043,42282,393 4781,477 16%90,752 114,085 154,085127%95%92%(49,305) (32,608) (50,592) (33,355) (37,442)805121,2610%-2%-3%(50,672) (33,867) (38,703)Source: JMP Securities LLC and Company 18%17%58,97863,55065,896102%102%95%(16,955) (18,290) )(17,148) (18,578) (14,614)9076171,132-5%-3%-8%(18,055) (19,195) (15,746)( 0.18)( 0.18)( 0.13)98,606 105,370 119,0762%7%13%153,600 21(1,465)(73,955)3,209-4%(77,164)( ,20099%95%96%93%(20,090) (16,641) (16,490) 00(246)548(300)(300)(19,085) (14,754) (15,290) (12,894)1,0871,3221,3501,350-6%-9%-9%-10%(20,172) (16,076) (16,640) (14,244)( 0.16)( 0.12)( 0.13)( 0.10)122,992 129,549 132,917 136,10717%5%3%2%153,000 154,100 158,107 %5,590(298)(62,023)5,109-8%(67,132)( (15,950)( 13)-14.9%1,200(300)(15,213)1,350-9%(16,563)( 55)-14.1%1,200(300)(14,555)1,350-9%(15,905)( 13)-7.7%1,200(300)(8,513)1,350-16%(9,863)( ( 16)( 978)-1.4%1,000(300)(1,278)1,350-106%(2,628)( 83)-1.0%1,000(300)(683)1,350-198%(2,033)( 9551.3%1,000(300)2,6551,35051%1,305 ,173)-0.9%4,000(1,200)(2,373)5,400-228%(7,773)( 0.05)154,8428%173,179Anaplan, Inc. (PLAN)September 20, 2019FIGURE 5. PLAN Income Statement8
000s, unless otherwise notedFY end Jan.FY16Cash and cash equivalentsAccounts receivable, netDeferred commissions, currentPrepaid expenses and otherOtherTotal Current AssetsProperty and equipmentDeferred commissionsIntangible AssetsOperating lease right-of-use assetRestricted CashNotes receivableOtherTotal AssetsAccounts payableAccrued expensesDeferred revenue, currentOperating lease liabilities, current portionTotal Current LiabilitiesDeferred revenue, noncurrentOperating lease liabilities, net of current portionOtherTotal LiabilitiesConvertible preferred stockCommon stockAccumulated other comprehensive lossAdditional paid-in capitalAccumulated deficitTotal Stockholders' EquityTotal liabilities Stockholders' EquitySource: JMP Securities LLC and Company )304,037602,468F3QF4Q----------Anaplan, Inc. (PLAN)September 20, 2019FIGURE 6. PLAN Balance Sheet9
000s, unless otherwise notedFY19AFY20EFY end QNet Income(54,227) (40,194) (47,554) (26,181) (34,318) (37,961) (32,556) (131,016) (37,191) (40,642) Amortization of operating lease right-of-use and accretion of operating lease liabilities2,4422,545Other582582128Changes in:(20,000)Accounts receivable(17,430) (16,529) (10,175)9,239832(7,212) (31,401) (28,542)2789,935Prepaid expenses and other 9)518(4,611)Deferred commissions(11,388) (12,169) (14,765)(5,807)(6,827)(8,748) (11,431) (32,813)(8,191) (13,396)Accounts payable and accrued expenses Payments for operating lease(2,361)(2,429)Deferred 6)3,331(416)1,775(722)(1,256)Cash Flow from Operating Activities(52,804) (26,161) (14,496) (8,801) (6,894) (14,220) (15,938) (45,853) (1,900)5,095 (14,493)Marketable securities(1,003)3,000Acquisitions, net(400)Purchase of property and )(1,615) (15,122)(922)(681)(2,000)Capitalized internal-use (1,995)(7,397)(2,161)(2,890)(2,400)Cash Flow from Investing Activities(7,991) (2,371) (15,366) (7,367) (8,431)(3,111) (3,610) (22,519) (3,083) (3,571) (4,400)Stock issue/repurchase86,533301,813301,813Stock options4681,9352,7003,5096,2093,00411,735Capital Lease(672)(956)(1,628)Principle payments on capital lease ,148Other1464,7251,3031,66312 (31,363) (28,385)9,280(192)Cash Flow from Financing Activities87,1212,23964,7251,3031,663 305,261 (28,304) 279,92311,19622,397FX (398)(644)Net change in cash and equivalents26,708 (29,128) 36,122 (15,472) (14,596) 287,239 (49,566) 209,8375,81523,277Cash and equivalents - beginning83,325 110,03380,905 117,027 101,55586,959 374,198 117,027 326,864 332,679Cash and equivalents - ending110,03380,905 117,027 101,55586,959 374,198 324,632 326,864 332,679 355,956Free Cash ce: JMP Securities LLC and Company Y20E(35,257) 8(41,000) ,029(1,978)(7,697) (18,995)(3,000)(6,603)(3,000) (10,451)(6,000) 30023,400FY21EF2QF3Q(42,156) 7,796) (162,062)8,30029,4003,00013,10027,880 31) 3,338) (136,545)9,90037,3004,10014,90034,590 25,000)(50,000) 3,481)-3%1,6141%5,8524%2160%Anaplan, Inc. (PLAN)September 20, 2019FIGURE 7. PLAN Statement of Cash Flows10
Anaplan, Inc. (PLAN)Company DescriptionFounded in 2008, Anaplan is disrupting the 17B planning software market with its cloud-native solution that leverages its patented in-memorydata engine primarily to address problems in the sales, supply chain, and finance departments of the Global 2000 companies.Investment RisksThere are a number of risks that could prevent shares of Anaplan from reaching our price target, including: 1) Anaplan's ability to drive growthin the future will depend largely on its ability to ramp its sales force; and 2) we project the company will not achieve free cash flow breakevenuntil the second half of FY21.September 20, 201911
Anaplan, Inc. (PLAN)JMP FACTS AND DISCLOSURESAnalyst Certification:The research analyst(s) who prepared this report does/do hereby certify that the views presented in this report are in accordance with my/ourpersonal views on the securities and issuers discussed in this report. As mandated by SEC Regulation AC no part of my/our compensationwas, is or will be directly or indirectly related to the specific views or recommendations expressed herein. This certification is made underthe obligations set forth in SEC Regulation AC. Any other person or entity may not use it for any other purpose. This certification is madebased on my/our analysis on the date of this report’s publication. I/We assume no obligation to update this certification to reflect any facts,circumstances, or events that may subsequently come to my/our attention. Signed Patrick WalravensJMP Securities Disclosures:JMP Securities currently makes a market in the securities of Anaplan, Inc., Amazon.com, Inc., Alphabet Inc. and SAP AGJMP Securities was manager or co-manager of a public offering of securities for Anaplan, Inc. (PLAN) in the past 12 months, and receivedcompensation for doing so.JMP Securities expects to receive OR intends to seek compensation for investment banking services from Anaplan, Inc., Amazon.com, Inc.,Alphabet Inc. and SAP AG in the next 3 months.JMP Securities Investment Opinion Definitions:Market Outperform (MO): JMP Securities expects the stock price to outperform relevant market indices over the next 12 months.Market Perform (MP): JMP Securities expects the stock price to perform in line with relevant market indices over the next 12 months.Market Underperform (MU): JMP Securities expects the stock price to underperform relevant market indices over the next 12 months.JMP Securities Research Ratings and Investment Banking Services: (as of September 20, 2019)RegulatoryEquivalentJMP RatingMARKET OUTPERFORMMARKET PERFORMMARKET UNDERPERFORMCOVERAGE IN TRANSITIONRATING SUSPENDED# valentBuyHoldSell# Co'sUnderCoverage%ofTotal# Co'sReceivingIBServices inPast 0023.20%14.60%0%0%0%414100%7818.84%% of Co'sWith ThisRatingStock Price Chart of Rating and Target Price Changes:Note: First annotation denotes initiation of coverage or 3 years, whichever is shorter. If no target price is listed, then the target price is N/A. Inaccordance with FINRA Rule 2241, the chart(s) below reflect(s) price range and any changes to the rating or price target as of the end of themost recent calendar quarter. The action reflected in this note is not annotated in the stock price chart. Source: JMP Securities.Rating and Price Target History for: Anaplan, Inc. (PLAN) as of 09-19-201911/06/18I:MO: 2902/25/19MO: 4005/28/19MO: 5007/18/19MO:UR08/23/19MO: 6108/27/19MO: d by: BlueMatrixSeptember 20, 201912
Anaplan, Inc. (PLAN)Rating and Price Target History for: Alphabet Inc. (GOOGL) as of 09-19-201910/28/16MO: 985Q3201711/02/18MO: 137501/27/17MO: 1020Q104/28/17MO: 1095Q204/30/19MO: 1300Q307/25/17MO: 1077201810/27/17MO: 1200Q1Q202/02/18MO: 1275Q304/24/18MO: 12352019Q1Rating and Price Target History for: Amazon.com, Inc. (AMZN) as of 09-19-201907/24/18MO: : 145009/30/16MO: 950Q304/28/17MO: 1065201707/27/18MO: 2075Q107/28/17MO: 1125Q210/29/18MO: 205010/27/17MO: 1240Q3201812/19/17MO: 1350Q1Q201/24/18MO: 1475Q302/02/18MO: 16002019Q104/27/18MO: 29/19MO: 2275Created by: BlueMatrixCreated by: BlueMatrixRating and Price Target History for: SAP AG (SAP) as of 09-19-201910/21/16MO: 93Q301/11/17MO: 952017Q104/25/17MO: 106Q207/18/17MO: 112Q3201810/19/17MO: 118Q104/24/18MO: 121Q2Q307/19/18MO: 135201901/29/19MO: 131Q1Q204/24/19MO: 1501501401301201101009080Created by: BlueMatrixJMP Disclaimer:JMP Securities LLC (the “Firm”) compensates research analysts, like other Firm employees, based on the Firm’s profitability, which includesrevenues from the Firm’s institutional sales, trading, and investment banking departments as well as on the quality of the services and activitiesperformed that are intended to benefit the Firm’s institutional clients. These data have been prepared by JMP Securities LLC for informationalpurposes only and are based on information available to the public from sources that we believe to be reliable, but we do not guaranteetheir accuracy or completeness. Any opinions and projections expressed herein reflect our judgment at this date and are subject to changewithout notice. These data are neither intended nor should be considered as an offer to sell or a solicitation or a basis for any contract forthe purchase of any security or other financial product. JMP Securities LLC, its affiliates, JMP Group LLC, Harvest Capital Strategies LLC,and their respective partners, directors, officers, and associates may have a long or short position in, may act as a market maker for, or maypurchase or sell a position in the securities mentioned herein. JMP Securities LLC or its affiliates may be performing, have performed, or seekto perform investment banking, advisory, or other services and may have acted as manager or co-manager for a public offering of securitiesfor any company mentioned herein. The reader should assume that JMP Securities LLC will solicit business from the company covered inthis report. Members of our Sales and Trading Department provide oral and/or written market opinions and trading strategies to our clientsthat reflect their personal opinions about stocks that are the subject of the firm's research reports. Our research analysts discuss tradingstrategies with clients that sometimes reflect short-term expectations for the price of the securities that are the subject of research reports.These trading strategies are distinct from the analysts' fundamental rating for the stock, which is based upon the analysts' view comparedto other stocks under coverage for the relevant time period. Copyright 2019. All rights reserved by JMP Securities LLC. JMP SecuritiesLLC is a member of FINRA, NASDAQ, and SIPC.September 20, 201913
Anaplan, Inc. (PLAN)Jeffrey H. SpurrDirector of Research(415) 835-3903RESEARCH PROFESSIONALSFINANCIAL SERVICESAlternative Asset ManagersDevin RyanBrian McKenna(212) 906-3578(212) 906-3545Commercial & Specialty FinanceChristopher York(415) 835-8965Consumer FinanceDavid M. ScharfJeff Zhang, CFAMedical Devices & SuppliesDavid TurkalyDaniel W. Stauder(212) 906-3563(212) 906-3535REAL ESTATE(415) 835-8942(415) 835-8948Housing & Land DevelopmentPeter L. Martin, CFAAaron HechtDoug Hansen(415) 835-8904(415) 835-3963(415) 835-8934Financial Processing & OutsourcingDavid M. ScharfJeff Zhang, CFA(415) 835-8942(415) 835-8948Property ServicesMitch GermainCorey DeVito(212) 906-3546(212) 906-3525InsuranceMatthew J. CarlettiKarol Chmiel(312) 768-1784(312) 768-1786Residential ServicesAaron Hecht(415) 835-3963Investment Banks & BrokersDevin RyanBria
Gartner Magic Quadrant for Sales and Operations Planning Systems of Differentiation Source: Gartner Magic Quadrant for Sales and Operations Planning Systems of Differentiation, May 2019 Anaplan, Inc. (PLAN) September 20, 2019 4. Anaplan's strengths, according to Gartner, include: 1) the company's reference customers reported