Transcription
September 2019SALES TAXREPORTPrepared by:The County Government Institute
2019 NYSAC Sales Tax ReportLocal Sales Tax in New York StateLocal sales tax has become more important to county government as a major revenue source overthe decades. It is also important for cities, towns, villages and some school districts because mostcounties share their sales tax with these municipalities. Sales tax is a key revenue that supports thecosts of local services (as well as state mandates for counties) and to help reduce pressure onproperty taxes.In general, sales tax is applied to purchases of: Tangible personal property (with some exemptions); Utility (gas, electricity, telephone, and refrigeration and steam) services; Other selected services (for example, interior decorating and detective services); Food and beverages sold by restaurants, taverns and caterers; Hotel occupancy; and Certain admission charges and dues.County Adoption of Local Sales TaxNew York State, like many states, first established a temporary sales tax in the 1930’s as a way toaddress public service needs during the Great Depression and its aftermath. New York City wasgranted authority to set a local sales tax as well during this time. According to the New York StateComptroller’s office, in 1947, the state authorized cities and counties to impose locallyadministered sales tax¹.In 1965, New York State modified its sales tax model by establishing a 3 percent state sales tax,while replacing the locally administered sales tax with a local option sales tax to be administered bythe State of New York. Only a handful of counties opted in the first year, but by 1968, nearly 30counties had adopted a local option sales tax². The adoption by counties of the local sales tax wasdriven by state mandates that required counties to finance nearly half of the nonfederal share ofMedicaid, as well as the requirement to pay for new and expanded state and federal social welfareprograms during this period. By 1972, 44 counties had adopted the local sales tax option at 3percent. The final 13 counties adopted their local sales tax option after 1980, with the last finallyjoining the ranks in 1997.The most recent period of significant changes in county sales tax rates occurred between 2001 and2006. During this period, the State Legislature and Governor enacted a sweeping expansion ofMedicaid eligibility and benefits, for which counties paid a set percentage of the program costs. Inaddition, the state also enacted enhanced pension benefits for government workers during thistime frame (local governments are required to participate in the state designed pension system).The combination of these state actions, combined with a recession, caused these program costs tospike. As a result, 37 counties and New York City raised their local sales tax rates to help pay thenew state-imposed costs and to mitigate increases in property taxes. Exhibit 1 provides a list ofcounty sales tax rates in effect today.¹ NYS Comptroller: Local Government Sales Tax in New York: 2015 Update; Chapter 278, Laws of 1947.²NYS Department of Taxation and Finance: Publication 718-A 1
2019 NYSAC Sales Tax ReportExhibit 1County Sales and Use Tax oeMontgomeryNassau*New York City*CountyTax Rate ySchoharieSchuylerSenecaSt. yTax Rate %4.00%4.00%4.00%3.00%3.00%4.00%3.00%4.00%4.00%- New York State imposes a 4% sales tax that would be added to county rates (and any MCTDtax rate) to determine a full sales tax rate.* These counties are also subject to a 3/8% Metropolitan CommuterTransportation District (MCTD) sales tax- Rates Effective as of December 1, 2015 2
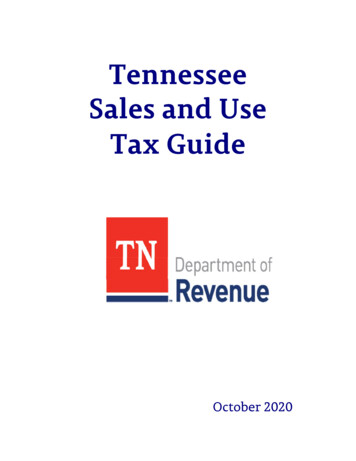
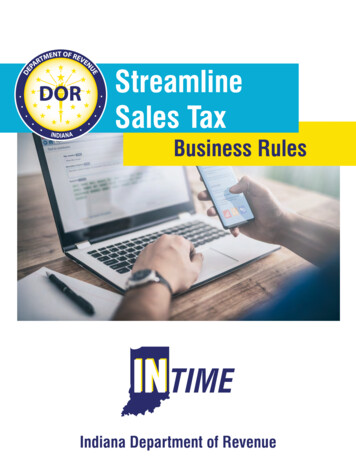
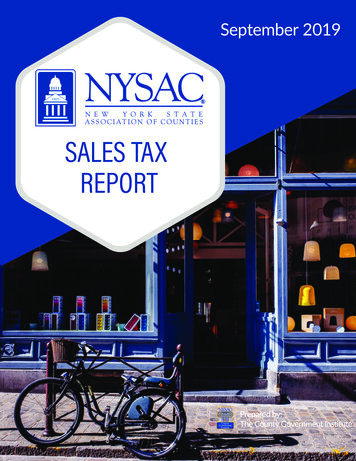
2019 NYSAC Sales Tax ReportSales Tax Revenue Grows in ImportanceIn 2018, total sales tax collected in New York State exceeded 31.6 billion, as follows: New York State New York City .Counties. .Other Local Governments.MTA Cities (preempt) . 14.2 billion (45 percent of the total) 7.8 billion (24.7 percent) 6.3 billion (19.9 percent after sharing w/local governments) 1.9 billion (6.0 percent – as part of county sales tax sharing) 1 billion (3.2 percent) 400 million (1.3 percent)County Sales TaxWhile sales tax revenues are more volatile than property taxes, especially during recessionaryperiods, they have grown in importance to counties over time. From 1996 to 2018 about two out ofthree counties have seen their reliance on sales tax increase compared to property taxes. In 2018,22 counties collected more in sales tax (after sharing with municipalities) than they did in propertytax. The greater reliance on sales tax is linked to a variety of factors, but a few key reasons include: Property taxes are viewed less favorably by a typical taxpayer; Sales tax can be exported to some degree through tourism and travelers passing through anarea; and The sales tax base (as measured by total taxable sales in the counties, not including NYC)grew significantly from 104 billion in 1996 to 197 billion in 2018, nearly doubling in sizeand outstripping the rate of inflation during this period. (Compiled from data from the NYSDepartment of Taxation and Finance.)As sales tax grew, property taxes as a share of total county revenues declined. Exhibit 2 shows themost recent trend in gross county sales tax collections since 2006 (before sales tax sharing) – 2019is an estimate (red).Exhibit 2BillionsGross County Sales Tax, 2006 - 2019 9.0 8.0 7.0 6.3 6.6 6.6 6.2 7.0 6.5 6.8 7.3 7.4 7.4 7.5 7.8 8.2 8.4 6.0 5.0 4.0 3.0 2.0 1.0 0.02006 2007 2008 2009 2010 2011 2012 2013 2014 2015 2016 2017 2018 2019 3
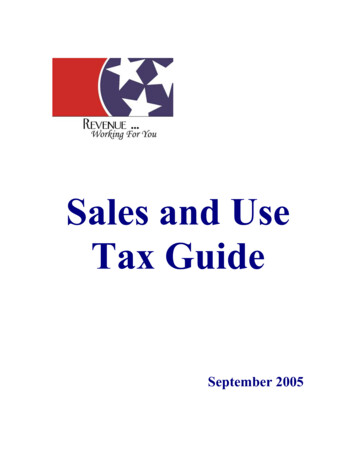
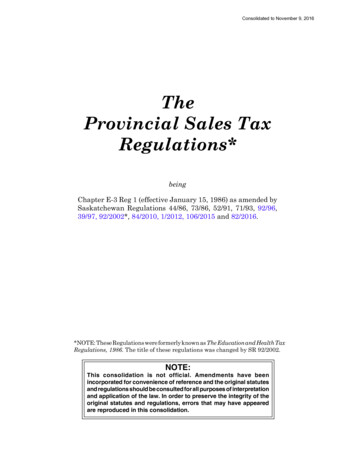
2019 NYSAC Sales Tax ReportNew York City Sales TaxThe experience for New York City has been different. Even with astronomical growth in sales taxsince 1996, the City’s share of total tax revenues coming from sales and use tax has declined from15.1 percent in 1996 to 13.4 percent in 2016 according to data compiled by the Independent BudgetOffice. As described above for counties, New York City’s total taxable sales base grew from 31billion in 1996 to 160 billion in 2018, increasing by a factor of five. However, property taxrevenues increased as a share of the City’s total tax revenues from 39.2 percent in 1996 to 43.2percent in 2016. New York City has a more diverse economic and revenue base (including a cityincome tax) than counties, and the City has benefitted from a very robust real estate market the lastcouple of decades which helps explain part of this revenue trend.The strength of individual county, city and regional economies can strongly influence sales taxcollections year over year. The New York City economy has shown more consistent growth in theyears since the Great Recession and that is highlighted in Exhibit 3, which breaks down sales taxgrowth for the state, counties and New York City (red bar). As the chart shows, the City collectedfar less than the rest of the counties in 2006 but were buoyed by a strong economy and a sales taxrate increase in 2009 from 4.0% to 4.5%, narrowing the gap with counties significantly by 2019.Given current sales tax trends it is likely that New York City’s sales tax collections will surpass allother counties combined gross sales tax collections (before sharing) in the next several years.Exhibit 3Comparison of Annual Sales Tax Revenues -- Counties,NYC and State Shares* 16,000,000,000 14,000,000,000 12,000,000,000 10,000,000,000 8,000,000,000 6,000,000,000 4,000,000,000 2,000,000,000 02006 2007 2008 2009 2010 2011 2012 2013 2014 2015 2016 2017 2018 2019CountiesNYCState*2019 is NYSAC Estimate 4
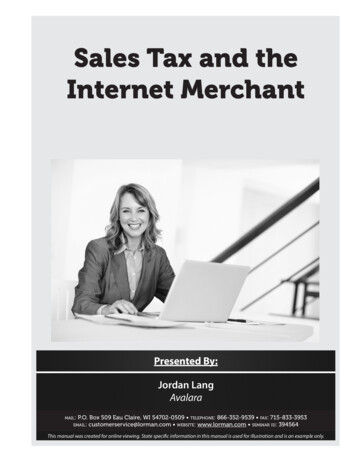
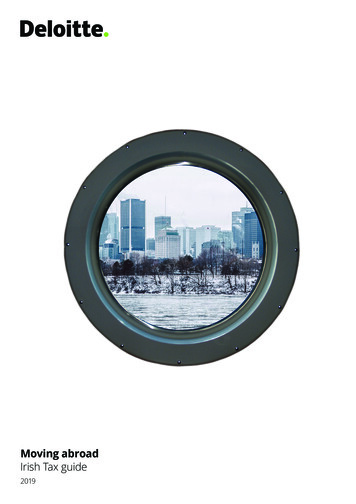
2019 NYSAC Sales Tax ReportAs mentioned, sales tax collections can also be quite volatile. This can be influenced by economicconditions, sales tax rates, consumer confidence, wage growth, inflation, monetary and fiscalpolicy, among a host of other variables. Exhibit 4 charts the change in annual sales tax growth ratesin recent years, including how sales tax rate changes impact collections. The stronger growth inNew York City (3.9 percent) provides an average annual growth rate over the period that isconsiderably higher than the average annual rate change for counties (2.4 percent).Exhibit 4Comparison of Sales Tax Growth Changes by -8.0%CountiesNYCStateAverage Annual Growth Rate in Sales Tax, 2006-2019New York City3.91 percentNew York State2.36 percentCounties2.38 percentSales Tax SharingCounties continue to share a sizable percentage of their local sales tax with cities, towns andvillages. In 2018, NYSAC estimates that counties shared nearly 1.9 billion, or 23 percent of thestatewide total. Not all counties are required to share these revenues, but for those that do, thepercent shared varies from 5 percent to 69 percent, with the average hovering just over 30 percent.Shared sales tax is generally distributed using assessed value, population or some combinationthereof. In some circumstances a set dollar amount, or set percent is shared with municipalities.See Exhibit 5 for an annual breakdown of total sales tax shared with municipalities. 5
2019 NYSAC Sales Tax ReportExhibit 5County Sales Tax Shared with Cities, Towns & Villages,2018 Est. 2,000,000,000 1.89B 1,900,000,000 1.81B 1,800,000,000 1,700,000,000 1,600,000,000 1.59B 1.60B 1.62B 1.67B 1.64B 1.74B 1.72B 1.69B 1.69B 1.56B 1,500,000,000 1,400,000,000 01620172018Sales Tax Per Capita by CountyAs expected, sales tax collections are not distributed evenly across the state. Outside of generaleconomic conditions, key factors that can impact per capita collections in any given county includepopulation, income levels, sales tax base, local tax rates, tourism and retail mix.Exhibit 6 maps the per capita sales tax collections by county and includes all sales tax collectionsincluding city preemption, and for New York City, the MTA. The per capita calculation uses 2017U.S. Census Bureau population estimates for New York counties, along with 2017 sales tax receiptsas presented in the AS570 Report from the NYS Department of Taxation and Finance. The darkerthe color, the higher the per capita sales tax collections. 6
2019 NYSAC Sales Tax ReportExhibit 6In 2018, the average local sales tax per capita statewide (all counties and New York City combined)was 894. This overall average is greatly influenced by New York City. If New York City is removedfrom the calculation, the average per capita for the 57 counties is 760. Suffolk County has thehighest local sales tax per capita at 984 – which is reflective of their high population, a higherlocal tax rate of 4.25 percent, pockets of extremely high wealth, a large array of retail opportunities,and significant tourism compared to many other parts of the state. The same can be said for NassauCounty and New York City that share many of these traits resulting in per capita sales taxcollections of 886 for Nassau and 933 for New York City. The Adirondack Park counties ofEssex, Hamilton and Warren have higher than average per capita sales tax as well, due to theirstrong tourism draw – with Essex County’s number one source of taxable sales being TravelerAccommodation (i.e., hotel and other lodging).Exhibit 7 lists in alphabetical order the per capita sales tax data by county. As the chart shows, thebroad diversity of New York’s counties generates a range from 332 to 984 in local sales tax percapita. 7
2019 NYSAC Sales Tax ReportExhibit 7Per Capita Local Sales Tax - 20182018Per CapitaCOUNTIESGross Sales Tax Population Sales Tax COUNTIESAlbany 275,109,796307,117 896OnondagaAllegany 21,442,83046,430 462OntarioBroome 135,218,298191,659 706OrangeCattaraugus 43,726,00376,840 569OrleansCayuga 36,874,23677,145 478OswegoChautauqua 67,543,461127,939 528OtsegoChemung 61,064,12684,254 725PutnamChenango 25,859,76547,536 544RensselaerClinton 56,909,09580,695 705RocklandColumbia 43,098,93059,916 719St. LawrenceCortland 29,814,16647,823 623SaratogaDelaware 22,729,71544,527 510SchenectadyDutchess 197,426,483293,718 672SchoharieErie 797,191,558919,719 867SchuylerEssex 31,811,71237,300 853SenecaFranklin 23,792,14250,293 473SteubenFulton 30,754,89753,591 574SuffolkGenesee 42,163,43057,511 733SullivanGreene 32,729,48247,491 689TiogaHamilton 4,181,3884,434 943TompkinsHerkimer 32,497,45561,833 526UlsterJefferson 78,658,684111,755 704WarrenLewis 12,489,54826,447 472WashingtonLivingston 34,788,73663,227 550WayneMadison 33,575,17070,795 474WestchesterMonroe 503,950,686742,474 679WyomingMontgomery 30,811,84049,455 623YatesTotal CountiesNassau 1,203,576,3211,358,343 886New York CityNiagara 136,198,353210,433 647Oneida 162,584,751229,577 708GRAND TOTAL**Includes direct sales tax for cities that preempt, school districts, NYC MTA, etc.2018Gross Sales Tax Population 363,657,366461,809 85,781,565109,864 291,038,021381,951 16,748,80640,612 62,065,973117,898 39,001,02459,749 63,145,09298,892 88,428,881159,442 218,516,610325,695 59,035,722108,047 138,062,754230,163 101,627,810155,350 16,063,20131,097 11,445,89817,912 25,984,72534,300 58,611,39195,796 1,457,518,2621,481,093 46,428,01575,498 24,240,23848,560 66,116,805102,793 120,049,605178,599 58,301,51664,265 20,291,92261,197 45,884,37090,064 747,250,409967,612 18,592,59340,085 12,731,99624,841 8,465,193,631 11,143,461 7,838,561,3758,398,748Per CapitaSales Tax 787 781 762 412 526 653 639 555 671 546 600 654 517 639 758 612 984 615 499 643 672 907 332 509 772 464 513 760 933 17,468,246,597 19,542,209 894Identifying the Source of Sales Tax in CountiesThe federal government and New York State use broad industrial classifications to record andcapture the sales activity of thousands of businesses across nearly every sector of the economy. Thecurrent classification system is known as the North American Industry Classification System(NAICS) and was built upon the prior system, the Standard Industrial Classification (SIC). Thereare occasional adjustments, clarifications, or even new industries introduced to the system thatrequire certain transactions, or organizations, be moved to more appropriate categories – this canhamper comparisons across time. Regardless, the system provides a useful tool for counties andothers to measure economic activity. In recent years the NYS Department of Taxation and Financebegan posting taxable sales data by NAICS code online. The data can be sorted using a wide varietyof data points and can be downloaded at:https://www.tax.ny.gov/research/stats/stat excise/taxable sales and purchases/taxable sales and purchases open data.htmThe taxable sales data posted by the tax department is also adjusted to recognize state and localsales tax exemptions. While the State mandates that many items be exempt from sales tax (85categories impacting hundreds of items), they also allow counties and New York City to opt out ofsome of these exemptions. Exhibit 8 provides a summary of these local exemptions. 8
2019 NYSAC Sales Tax ReportExhibit 8County Implementation of Local Sales Tax ExemptionsLocalSales TaxRateClothing &Footwear( 110 )RateSolar - Res. Solar - Comm.SolarSolarCommercial ResidentialRateRatePower PurchasePower uylerSenecaSt. .00%90.00%80.00%230.00%470.00%80.00%Commercial Residential EnergyFuel Cell gas, electricity, coal, woodMotor Fuel Systemsfuel oil, propane & 0%0.00%0.00%4.00%0.00%0.00%4.50%8 cents per ga l l on00.00%410.00%8 cents per ga l l on¹ 9
2019 NYSAC Sales Tax ReportWhile vendors self-identify the NAICS category their business should be in, the NYS Department ofTaxation and Finance closely monitors this to ensure accuracy and consistency. As mentioned, thedatabase is occasionally modified to align certain businesses and transactions into moreappropriate categories. For the 2018-19 sales tax year such a change was enacted involving acategory called “Administration of Economic Programs.” The change resulted from the statemoving sales tax transactions (related to private sales of cars and other motorized vehicles) thatoccur at local department of motor vehicles into this category. Prior to this change thesetransactions were not assigned to one specific area. While the change did not alter the total sales oftaxable goods it did make the economic programs category more prominent with most countiesseeing it entering this year as a top 20 sales tax contributor.Exhibit 9 provides an example of what the “Top 20” taxable sales categories look like for the Stateof New York in the 2018-19 tax year (March to February). The state’s top categories differ slightlyfrom what a typical counties’ data may look like because the state employs different sales taxexemptions and methodologies (i.e., flat amount per gallon of motor fuel vs percent of retail costper gallon for all but one county), and they collect taxes in all corners of the state including NewYork City which has a different business/retail mix than the rest of the state. Note the“Administration of Economic Programs” category entering at 14 for the state. The Top 20 for eachcounty can be found on NYSAC’s website at: www.nysac.org/countytop20sales2019/Exhibit 9New York State - Total Taxable Sales by Category, 2018-19March 2018 to February 2019Rank Description1234567891011121314151617181920Taxable SalesRestaurants and Other Eating PlacesAutomobile DealersBuilding Material and Supplies DealersGen. Merch. Stores, incl. Warehouse Clubs and SupercentersTraveler AccommodationGasoline StationsGrocery StoresClothing StoresWired and Wireless Telecommunications CarriersElectronic Shopping and Mail-Order HousesElectric Power Generation, Transmission and DistributionOther Miscellaneous Store RetailersAutomotive Repair and MaintenanceAdministration of Economic ProgramsHealth and Personal Care StoresElectronics and Appliance StoresServices to Buildings and DwellingsComputer Systems Design and Related ServicesOther Professional, Scientific, and Technical ServicesBeer, Wine, and Liquor Stores 39,847,378,152 30,573,518,238 14,308,759,370 12,968,850,660 12,660,810,765 12,098,815,853 9,872,296,710 9,059,107,470 8,706,537,286 8,653,909,099 7,971,279,547 7,272,890,105 6,002,609,588 5,642,250,194 5,623,067,928 5,274,693,375 5,246,029,190 5,008,763,081 4,413,918,273 4,367,503,964Subtotal Top 20 215,572,988,848Grand Total - All Taxables Sales, 2018-19 350,409,553,159% of TotalCumulative % ofTaxables For most counties the top sales tax generators by industry classifications are similar, includingautomobile dealers, gasoline stations, restaurants and other eating establishments, buildingmaterial and supplies stores, and clothing and big box stores (warehouse clubs). While many of the 10
2019 NYSAC Sales Tax ReportNAICS categories listed appear self-explanatory there are many layers to the types of businessesthat fall into each category. Appendix A provides a description of many of the top NAICScategories listed above for your review.As mentioned, the sheer volume of transactions from New York City skews the statewide data.Additionally, New York City has a broader sales tax base than the rest of the counties due to theCity maintaining a sales tax on more services (mainly health & beauty and credit rating services).Exhibit 10 shows New York City’s Top 20 – several of these categories do not show up in mostcounties’ top 20 (computer and software, as well as professional services).An important trend for New York City has been the increase in taxable sales in the technologysector from 2014 to 2019. In 2014, only “Computer Systems Design and Related Services” made theTop 20. By 2019, “Computer and Peripheral Equipment”, “Other Information Services” and“Software Publishers” broke into the Top 20, as well.Exhibit 10New York City - Total Taxable Sales by Category, 2018-19March 2018 to February Taxable SalesRestaurants and Other Eating PlacesElectric Power Generation, Transmission and DistributionTraveler AccommodationAutomobile DealersClothing StoresElectronic Shopping and Mail-Order HousesWired and Wireless Telecommunications CarriersBuilding Material and Supplies DealersOther Professional, Scientific, and Technical ServicesOther Miscellaneous Store RetailersComputer Systems Design and Related ServicesHealth and Personal Care StoresGrocery StoresGen. Merch. Stores, incl. Warehouse Clubs & SupercentersOther Transit and Ground Passenger TransportationComputer and Peripheral Equipment ManufacturingBuilding Equipment ContractorsOther Information ServicesSoftware PublishersElectronics and Appliance StoresSubtotal Top 20 21,958,428,895 9,928,410,453 9,448,761,618 5,858,711,485 5,681,802,454 4,075,494,721 3,648,871,577 3,639,920,002 3,584,992,258 3,472,988,495 3,207,890,677 3,161,436,062 3,034,177,815 2,864,858,363 2,700,916,836 2,589,706,541 2,506,828,373 2,506,022,344 2,489,045,221 2,487,957,390 98,847,221,580Grand Total - All Taxables Sales, 2018-19 171,813,679,104% of TotalCumulative % ofTaxables 7.0%48.6%50.2%51.7%53.2%54.6%56.1%57.5%57.5%100.0% 11
2019 NYSAC Sales Tax ReportExhibit 11Exhibit 11 compares the Top 5 for New York City to the other 57 counties. The availability of masstransit, and the density of New York City, as opposed to the suburban and rural make-up of muchof the rest of the state, forces a higher priority on automobiles and related categories in thecounties outside of New York City. While auto dealers show up in both Top 5 lists, in New YorkCity, only 3.4 percent of total taxable sales was derived from auto dealers in 2019. For the rest ofthe state, most counties rely on auto dealers to consistently generate between 12 percent to 18percent of total taxable sales in any given year.There are a lot of ways to look at taxable sales data, but a good portion of taxable sales for a typicalcounty falls into one of several buckets, including: Auto Related – Automobile Dealers; Auto Repair & Maintenance; Gasoline Stations;Petroleum ProductsUtilities – Electric Power Generation & Distribution; Wired and WirelessTelecommunications; Natural Gas DistributionFood & Drink – Restaurants & Other Eating Places; Grocery Stores; Beer, Wine & LiquorStoresGeneral Retail – General Merchandise & Warehouse Stores (big box retailers); BuildingMaterials and Supplies; Electronics and AppliancesPersonal Retail – Clothing Stores; Department Stores; Health & Beauty; Sporting Goods;Hobbies, Toys, Musical Instruments, etc.Exhibit 12 provides a view of different sized counties and regions of the state on how these“buckets” impacted their sales tax collections in 2018. The bigger and more diverse the entity, theless reliant they become on one category. These five buckets produce just over 40 percent of totaltaxable sales in New York City, but as much as three-quarters of total taxable sales in a smallermore rural county. 12
2019 NYSAC Sales Tax ReportExhibit 12The size and economic diversity of a county makes a big difference in where their total taxable salesare generated. More importantly, just a handful of key areas can generate nearly half of all taxablesales in a given county. Understanding these industry sectors, their expected health in the comingyear, regional economic conditions, consumer sentiment, wage growth, among other variableshelps county officials project future sales tax revenues. For the 2017-18 sales tax year: Across all counties (including NYC), on average; 44% of all local taxable sales came from their top 5 categories 60% came from their top 10 categories 73% came from their top 20 categoriesFor New York City; 32% from their top 5 43% from their top 10 59% from their top 20For a smaller county (typically); 54% from their top 5 69% from their top 10 82% from their top 20Top Sources of Taxable Sales in the Counties Outside New York CityThe top five sources of taxable sales as previously identified in Exhibit 11 are virtually the same ineach region of the state (and generally for each county), but their order may change from region toregion. The only exception is the Mid-Hudson Region (Dutchess, Orange, Putnam, Rockland,Sullivan, Ulster and Westchester) where “Clothing Stores” breaks into the Top 5. One of the mostvisible trends in many counties is the impact of gasoline prices. When gasoline prices hovered nearfour dollars a gallon during 2011, 2012 and 2013, taxable sales from gasoline stations became the 13
2019 NYSAC Sales Tax Reporttop source of sales tax in most upstate counties or finished a close second. As prices have fallen, sohas the ranking for gasoline stations. Categories (like gasoline stations) that are heavily impactedby changes in commodity prices tend to be more volatile and will move up and down a county’s listaccordingly. Grocery stores, electric power generation and natural gas distribution fall into thisgroup as well.Another major trend is related to changes in consumer behavior that are often directly link to theemergence of new technologies and retail platforms. Over the last decade, retail transactions overthe internet have grown dramatically, impacting local retailers and county sales tax receipts. Whilewe will devote more time to internet retail later in this report, Exhibit 13 provides a breakdown ofhow the Top 10 taxable sales categories have evolved from 2014 to 2019 with “Electronic Shopping& Mail Order” moving into the Top 10 for the Rest of State counties.Exhibit 13Change in Taxable Sales from 2014 to 201957 Counties Outside of New York City20142014 Rank12345678910DescriptionAuto DealersGasoline StationsRestuarants and Other Eating PlacesGeneral Merch. Stores and Warehouse ClubsBuilding Material and Supplies DealersClothingGrocery StoresElectric Power Generation, Trans. & DistributionWired & Wireless Telecommunications (except Satellite)Department Stores (drops out of Top 10 by 2019)Subtotal Top 10 Taxables Sales (54.6% of total sales)Amount 20,078,860,284 15,608,312,020 14,143,509,026 9,882,562,130 8,
According to the New York State Comptroller's office, in 1947, the state authorized cities and counties to impose locally administered sales tax¹. In 1965, New York State modified its sales tax model by establishing a 3 percent state sales tax, while replacing the locally administered sales tax with a local option sales tax to be administered by