Transcription
An AMCOW Country Status OverviewWaterSupply andSanitation inSouth AfricaTurning Finance intoServices for 2015and Beyond
The first round of Country Status Overviews (CSO1) published in 2006 benchmarked the preparedness of sectors of16 countries in Africa to meet the WSS MDGs based on their medium-term spending plans and a set of ‘successfactors’ selected from regional experience. Combined with a process of national stakeholder consultation, this promptedcountries to ask whether they had those ‘success factors’ in place and, if not, whether they should put them in place.The second round of Country Status Overviews (CSO2) has built on both the method and the process developed inCSO1. The ‘success factors’ have been supplemented with additional factors drawn from country and regional analysisto develop the CSO2 scorecard. Together these reflect the essential steps, functions and results in translating financeinto services through government systems—in line with Paris Principles for aid effectiveness. The data and summaryassessments have been drawn from local data sources and compared with internationally reported data, and, whereverpossible, the assessments have been subject to broad-based consultations with lead government agencies and countrysector stakeholders, including donor institutions.This second set of 32 Country Status Overviews (CSO2) on water supply and sanitation was commissioned by the AfricanMinisters’ Council on Water (AMCOW). Development of the CSO2 was led by the World Bank administered Water andSanitation Program (WSP) in collaboration with the African Development Bank (AfDB), the United Nations Children’sFund (UNICEF), the World Bank and the World Health Organization (WHO).This report was produced in collaboration with the Government of South Africa and other stakeholders during 2009/10.Some sources cited may be informal documents that are not readily available.The findings, interpretations, and conclusions expressed in this volume do not necessarily reflect the views of thecollaborating institutions, their Executive Directors, or the governments they represent. The collaborating institutionsdo not guarantee the accuracy of the data included in this work. The boundaries, colors, denominations, and otherinformation shown on any map in this work do not imply any judgment on the part of the collaborating institutionsconcerning the legal status of any territory or the endorsement or acceptance of such boundaries.The material in this publication is copyrighted. Requests for permission to reproduce portions of it should be sent towsp@worldbank.org The collaborating institutions encourage the dissemination of this work and will normally grantpermission promptly. For more information, please visit www.amcow.net or www.wsp.orgPhotograph credits: Cover photograph by The Department of Water Affairs (South Africa)Photograph on inside back cover by Lani van Vuuren-WRC 2011 Water and Sanitation Program
Water Supply and Sanitation in South Africa: Turning Finance into Services for 2015 and BeyondAn AMCOW Country Status OverviewWaterSupply andSanitation inSouth AfricaTurning Finance intoServices for 2015and Beyond1
An AMCOW Country Status OverviewStrategic OverviewReform overview. South Africa underwent a majortransition to a full democracy in 1994. The new governmentembarked on an ambitious program to eradicate backlogs inwater supply and sanitation, underpinned by developmentof sound sector policy and legislation. Initially, thisprogram was driven by the central government. In 2003responsibilities for service provision were devolved to localgovernment in line with the constitutional allocation offunctions. Although much has been achieved, significantchallenges remain. There is a need to build and sustaincapacity at the local government level to continue to investin, operate, and maintain services; to innovate and createmore effective delivery pathways to reach the “hard toreach”; and, to improve the sustainability of services alreadydelivered.Progress. South Africa has met the MillenniumDevelopment Goal targets for water supply and sanitation,according to its own service level definitions (whichare higher than those used internationally by the JointMonitoring Programme). South Africa has its own ambitiousservice coverage targets of 100 percent coverage for bothwater supply and sanitation by 2014. These targets areunlikely to be met for reasons elaborated below.Financial resources. South Africa has mobilized extensiveresources to meet its service delivery targets. These areprimarily through government capital grants, to providenew infrastructure, and operating grants, to support theongoing provision of services to poor households and thegovernment’s Free Basic Water policy. Government grantallocations to water supply and sanitation have increasedsignificantly in real terms over the period. The use of grantsfrom donors and external loans is insignificant in thecontext of the overall scale of government investment andlocal mobilization of resources. Anticipated investments aresignificant but are not sufficient to achieve universal accesswithin the planned timeframe. This is partly due to the highcost of providing bulk water services (through regionalschemes) to the remaining remote rural households andthe high cost of urban sanitation (provision of waterbornesystems is the accepted standard in cities and towns). Theexisting cost model does not cater adequately for theregional bulk infrastructure required for rural water supplyschemes in areas where groundwater resources are deemedto be inadequate or unreliable.2Learning and ImprovingNotwithstanding these impressive achievements, SouthAfrica has demonstrated a willingness to seek ongoingimprovements and to meet new challenges.There remain three areas of service backlogs that are “hardto reach”: sanitation in informal settlements; water supplyin deep rural areas; and rural sanitation. There is evidencethat the pace of delivery in these three areas has slowed.1Participatory approaches for the development of rural watersupply and sanitation projects, piloted and implementedin the early 1990s by nongovernmental organizations(NGOs), were largely overtaken by a government-led driveto supply new infrastructure from about 1995 onwards.Responsibility for investment and operation was laterdecentralized to local government in 2003. It is possiblethat a supply-driven and infrastructure-focused approach isless suited to addressing the remaining challenges and thatdelivery pathways that are more demand driven and involvecommunities more closely may be needed.Although progress with investing in new infrastructure toreduce service backlogs has been impressive, this is notthe whole story. Where infrastructure exists, not all poorhouseholds experience the benefits of this infrastructure asa result of a large number of poorly functioning systemsin rural areas2 and, in some cases, having access restrictedin urban areas as a result of affordability or technicalproblems.3There are also concerns related to the sustainability of theinfrastructure (both the new infrastructure that has beenbuilt as well as the aging infrastructure which has beenneglected in favor of extending services). The evidence forthis comes from multiple sources: a significant proportion ofrural water supply schemes are not functional; maintenancebudgets are inadequate;4 many ventilated improved pit(VIP) latrines are full and are not being emptied;5 manywastewater treatment works are operating over capacityand/or performing poorly;6 there are drinking waterquality risks in small towns and rural areas;7 the full costsof providing services are often not fully accounted for;and insufficient resources are available to the sector fromuser fees and government grants to maintain and sustainservices over time.
Water Supply and Sanitation in South Africa: Turning Finance into Services for 2015 and BeyondThere is a shortage of the necessary skills and experienceat the artisan, technical, engineering, and managementlevels to operate, maintain, and manage water servicesappropriately in many municipalities.8 The replacementof the old apprenticeship training for artisans with a newapproach has not been a success and there has been aserious loss of good artisan skills in the sector. There hasbeen a serious reduction in the number of engineers activein municipalities to manage large infrastructure investmentprograms and many managers lack the necessary skills andexperience.The performance of water boards acting in support of localgovernment has been mixed, and water boards themselveshave been subject to governance instability with rapidturnover at the board and senior management levels.10There are also governance failures within local government,the tier of government responsible for water servicesprovision to households in terms of the constitution.This has led to inappropriate appointments of staff andinterference in the day-to-day operations of the service, tothe detriment of the overall functioning and sustainability.9This second Country Status Overview (CSO2) wascommissioned by AMCOW and has been produced incollaboration with the Government of South Africa andother stakeholders. Agreed priority actions to tackle thesechallenges, and ensure finance is effectively turned intoservices, have been identified here.In order to address these challenges, the South Africangovernment, through collaboration between theDepartment of Cooperative Governance and TraditionalAffairs, the Department of Water Affairs and othergovernment departments, is implementing an intensiveturnaround strategy for local government.11Agreed priority actions to tackle these challenges, and ensure finance is effectivelyturned into services, are:Institutional framework Clarify the respective roles and responsibilities of the Departments of Cooperative Governance and Traditional Affairsand the Department of Water Affairs with respect to an effective turnaround in the performance of water services inmunicipalities, and clarify the respective roles of the departments of Human Settlements and Water with respect tosanitation.Strengthen accountability by allocating responsibility for water services from district municipalities to localmunicipalities where local municipalities are performing this function.Initiate an open debate on the respective merits of decentralized delivery of services versus regionalized deliverytaking into account local circumstances.Strengthen mechanisms to enforce compliance with legislated standards.Introduce minimum competency requirements for municipal water management.Financing Initiate a study to understand the reasons for high capital costs and to make recommendations for improving valuefor money in water and sanitation investment.Increase support to NGOs active in the sector.Actively increase the use of loan finance in the sector.Monitoring and evaluation Develop a clearer understanding of recent trends in access to services.Simplify and rationalize local government reporting requirements for water supply and sanitation.Improve understanding of service outcomes, particularly health-related outcomes in relation to water and sanitationinvestments.3
An AMCOW Country Status OverviewRural water supply Undertake more regular surveys on the functionality and performance of rural water supply schemes.Develop a better understanding of the factors constraining the sustainability of rural water supplies and how thesecan be addressed.Urban water supply Improve the quality of urban water management with a view to sound asset management, best practice networkmanagement, and appropriate pricing to ensure adequate maintenance, timely replacement of infrastructure,reduced nonrevenue water (water losses and unaccounted-for water), and wise and effective use of public resources.Implement a sound management development program for water managers.Rural sanitation and hygiene Pilot a more demand-orientated approach to the provision of rural sanitation.Investigate the extent and seriousness of VIP latrine emptying challenges and the implications of these for policy,technology choice, and future investment programs.Urban sanitation and hygiene 4Develop a priority national initiative on sanitation in informal settlements, particularly in large cities, pilot newapproaches and seek to take these to scale.Explore new service delivery models for high density settlements where insecurity of tenure makes planning andimplementing standard waterborne sanitation solutions difficult.
Water Supply and Sanitation in South Africa: Turning Finance into Services for 2015 and BeyondContentsAcronyms and Abbreviations. 61.Introduction. 72.Sector Overview: Coverage and Finance Trends. 83.Reform Context: Introducing the CSO2 Scorecard. 114.Institutional Framework. 145.Financing and its Implementation. 166.Sector Monitoring and Evaluation. 187.Subsector: Rural Water Supply. 208.Subsector: Urban Water Supply. 229.Subsector: Rural Sanitation and Hygiene. 2410.Subsector: Urban Sanitation and Hygiene. 26Notes and References. 285
An AMCOW Country Status OverviewAcronyms and kll/c/dM&EmMDGMICAfrican Development BankAfrican Ministers’ Council on WaterCapital expenditure(Department of) Cooperative Governance andTraditional AffairsCountry Status Overviews (second round)Department of Water AffairsGross domestic productGross national incomeHouseholdJoint Monitoring Programme (UNICEF/ WHO)kilo literliters per capita per dayMonitoring and evaluationmeterMillennium Development GoalMiddle income countryExchange rate: US 1 7.34 South African vernmental organizationOperations and maintenanceOperations expenditureRural sanitation and hygieneRural water supplySouth African Local Government AssociationSector-Wide ApproachUnited Nations Children’s FundUrban sanitation and hygieneUrban water supplyVIPWASHWHOVentilated improved pit (latrine)Water, sanitation and hygieneWorld Health OrganizationWSPWater and Sanitation Program
Water Supply and Sanitation in South Africa: Turning Finance into Services for 2015 and Beyond1. IntroductionThe African Ministers’ Council on Water (AMCOW) commissioned the production of a second round of Country StatusOverviews (CSOs) to better understand what underpins progress in water supply and sanitation and what its membergovernments can do to accelerate that progress across countries in Sub-Saharan Africa (SSA).13 AMCOW delegated thistask to the World Bank’s Water and Sanitation Program and the African Development Bank which are implementingit in close partnership with UNICEF and WHO in over 30 countries across SSA. This CSO2 report has been produced incollaboration with the Government of South Africa and other stakeholders during 2009/10.The analysis aims to help countries assess their own service delivery pathways for turning finance into water supply andsanitation services in each of four subsectors: rural and urban water supply, and rural and urban sanitation and hygiene.The CSO2 analysis has three main components: a review of past coverage; a costing model to assess the adequacy offuture investments; and a scorecard which allows diagnosis of particular bottlenecks along the service delivery pathway.The CSO2’s contribution is to answer not only whether past trends and future finance are sufficient to meet sectortargets, but what specific issues need to be addressed to ensure finance is effectively turned into accelerated coverage inwater supply and sanitation. In this spirit, specific priority actions have been identified through consultation. A synthesisreport, available separately, presents best practice and shared learning to help realize these priority actions.7
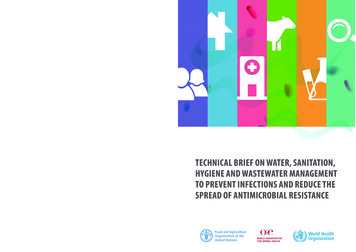
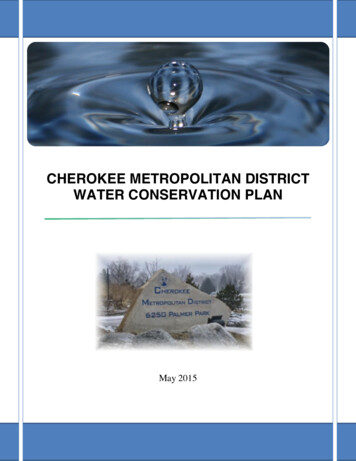
An AMCOW Country Status Overview2. Sector Overview:Coverage and Finance TrendsCoverage: Assessing Past ProgressThe CSO2 compares countries’ own estimates of coveragewith data from the UNICEF/WHO Joint MonitoringProgramme (JMP).14 The impact of these different coverageestimates on investment requirements is also assessed.According to South African data and definitions, accessto water infrastructure in South Africa improved from 58percent in 1994 to 91 percent in 2009. Access to sanitationinfrastructure, starting from a lower base, improved from34 percent to 76 percent in the same period (Figure1).* Accordingly, South Africa has met the MillenniumDevelopment Goal (MDG) targets for water supply andsanitation.This report accepts that South Africa has met the MDGtarget with respect to water supply even though theJMP data differs from the South African data. In termsof the JMP data, South Africa started from a highercoverage base in 1990 and has made slower progress. Theconclusion from this data set is that South Africa has notmet the MDG targets. The key reason for the difference isthat the South African data uses different definitions foran acceptable service compared to the JMP data. For theSouth African government, an acceptable basic level ofservice is a piped water supply within 200 m of a dwellingand a basic sanitation facility is regarded as a VIP latrine(or equivalent). These definitions are for a higher level ofservice compared to the JMP definitions which refer toonly improved water sources and improved sanitation(including ordinary pit latrines).Investment Requirements: Testing theSufficiency of FinanceMethodology. South Africa has set itself ambitiouscoverage targets, aiming for universal coverage for bothwater supply and sanitation by 2014. The required capitalinvestments (including major rehabilitation) have beencalculated using a target of 2015 (rather than 2014)to align with the approach used in other countries andfor ease of comparison between countries. The CSO2costing model has been used, incorporating local unit costFigure 1Progress in water supply and sanitation ter supply60%40%20%60%40%20%0%1985 1990 1995 2000 2005 2010 2015 20200%1985 1990 1995 2000 2005 2010 2015 2020Government estimatesGovernment targetGovernment estimatesGovernment targetJMP estimatesMDG targetJMP estimatesMDG targetSources: JMP 2010 Report and Department of Water Affairs (DWA).* Official update 2010 report: 59 percent in 1994 to 93 percent in 2010 for water and 48 percent in 1994 to 79 percent in 2010 for sanitation.8
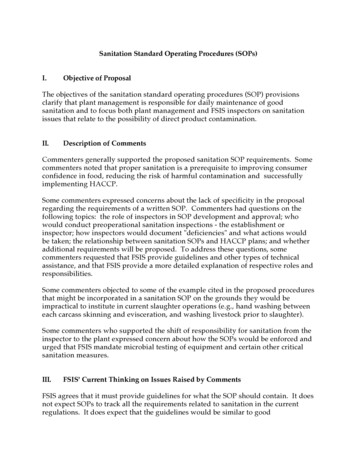
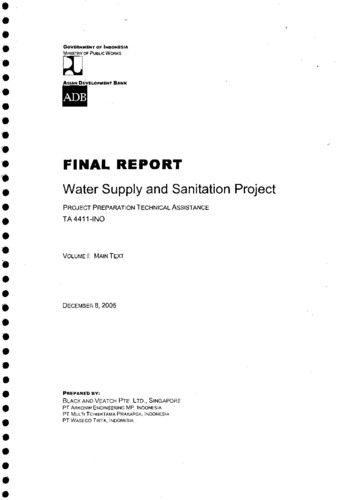
Water Supply and Sanitation in South Africa: Turning Finance into Services for 2015 and Beyondestimates (based on a recent cost survey of engineeringconsultancies) and a technology mix assumed to remainconstant over the period. There is a concern that theCSO2 model does not adequately account for the waterresource development costs (dams and regional schemecomponents) for rural water supply investments, leadingto an underestimation of investment requirements forrural water supply. This issue is not as pronounced forurban water supply because coverage is already veryhigh. However, the country requires major investmentsin new large urban water augmentation schemes overthe next 20 years. These investments have not beentaken into account in the model. Lastly, in the case ofsanitation, it is government policy to provide only flushtoilets in urban areas. At the same time there is a need torehabilitate, upgrade, and expand wastewater treatmentworks. This results in high investment requirements forurban sanitation. Anticipated investments were obtainedfrom government medium-term (three-year) budgetsextrapolated into the future (Figure 2).Water CAPEX. Anticipated capital investment (CAPEX)for water supply is just under US 1 billion per year,compared to a calculated required investment of US 857million per year (CSO2 estimate). Although this indicatesthat the anticipated investment is sufficient, the requiredinvestment calculation does not adequately cater forthe future higher costs of rural water supply schemes.Consequently, it may be concluded that the requiredinvestments are likely to be underestimated and hence thatanticipated investments are inadequate. The South Africangovernment estimates that the required investment tomeet the total backlog (including the upgrading of waterservices in informal settlements in association with thehousing program) by 2014 is R82 billion (US 10.2 billion),including an investment in bulk regional infrastructure ofR36 billion (US 4.5 billion).15Sanitation CAPEX. In the case of sanitation, theanticipated CAPEX is US 546 million per year, comparedto a calculated required investment of US 1,218 millionper year, revealing a gap of US 672 per year. TheSouth African government estimates that the requiredinvestment to meet the total backlog (including theupgrading of sanitation in informal settlements inassociation with the housing program) by 2014 isR67 billion (US 8.5 billion).16It should be noted that the calculated investmentrequirements are to provide universal access by 2015 (andnot the MDG targets which have already been met). Thesetargets are ambitious.For these investments to be sustainable, the resourcesnecessary to operate and maintain assets need tobe mobilized on an ongoing basis. In South Africa,municipalities are responsible for operating andmaintaining assets (in most cases). Municipalities areFigure 2Required vs. anticipated (public) and assumed (household) expenditureSanitationWater supplyRequired CAPEXRequired 5002000US million/yearUS million/yearPublic CAPEX (anticipated)Public CAPEX/software (anticipated)Household CAPEX (assumed)Household CAPEX (assumed)CAPEX deficitSource: CSO2 costing.9
An AMCOW Country Status OverviewTable 1Coverage and investment figuresCoverage Target PopulationCAPEXAnticipatedrequiring requirementspublic CAPEXaccess1990 2009 2015Rural water supplyUrban water supplyWater supply totalRural sanitationUrban sanitationSanitation 0%100%100%100%100%Total Public Domestic ExternalAssumed TotalHHdeficitCAPEXTotal‘000/year US 3114245179421703395080575703838235437672Sources: For coverage, JMP and DWA.17required to set aside money for the depreciation of theassets, and to budget appropriately for the operation andmaintenance (O&M) of the assets.The total annual operating and maintenance costs areestimated to be US 530 million per year for water supplyand US 493 million per year for sanitation (Table 2). TheSouth African government supports municipalities toprovide services to poor households through the equitableshare grant (an operating grant). The total grant amountedto around US 3.2 billion in 2009. Reliable estimates onthe share of this allocated to water supply and sanitationby municipalities are not available. As coverage and levelsof service increase, the level of government supportnecessary to maintain viable municipal services will alsoincrease. This will place additional demand on the centralgovernment budget.South Africa has a free basic water policy. The soundintention of this policy is to supply all poor households witha basic water supply (25 l/c/d) at no cost to the household.Unfortunately, the unintended consequence of this policyis a frequent expectation on the part of households toreceive free water. Consequently, municipalities receivealmost no revenue from households living in rural areas,even where the level of service provided may be a yardconnection. This situation creates a very high dependenceon government grants to sustain the service.10Table 2Annual OPEX requirementsSubsectorRural water supplyUrban water supplyWater supply totalRural sanitationUrban sanitationSanitation totalOPEXUS million/year14938153093400493Source: CSO2 costing.The investment requirements for sanitation could belowered if different assumptions were made with respectto service levels.These considerations are only part of the picture.Bottlenecks can in fact occur throughout the servicedelivery pathway—all the institutions, processes, and actorsthat translate sector funding into sustainable services.Where the pathway is well developed, sector fundingshould turn into services at the estimated unit costs.Where it is not, the above investment requirements maybe gross underestimates. The rest of this report evaluatesthe service delivery pathway in its entirety, locating thebottlenecks and presenting the agreed priority actions tohelp address them.
Water Supply and Sanitation in South Africa: Turning Finance into Services for 2015 and Beyond3. Reform Context:Introducing the CSO2 ScorecardPrior to 1994, municipalities were responsible for providingwater supply and sanitation (sewerage) services in cities andtowns. The traditional rural areas were the responsibility ofsatellite ‘homeland’ governments set up by the apartheidstate. In 1994, the new democratic government assumedresponsibility for water supply and sanitation nationallyand embarked on an ambitious program of delivering basicservices, primarily in rural areas. A national CommunityWater Supply and Sanitation Program was establishedwith dedicated funding from the national government.The program—built on the experience of the NGO, MvulaTrust, established a few years previously—had strongelements of community consultation and participation,required community contributions, used local labor tobuild schemes, and involved communities in the O&M ofschemes.18Political and social pressures to accelerate deliveryincreased over time. In response to these pressures, theprivate sector was used in regional large-scale buildoperate-train-transfer contracts. The pace of delivery wassubstantially increased, but at a high cost per householdserved. In 2000, a free basic water policy was introduced aspart of a broader commitment by government to providefree basic services. In 2003, rural water services assetswere transferred to local government. This was in linewith the constitutional allocation of powers and functionsbetween national and local government, following theprinciple of subsidiarity contained within the Constitution.Meanwhile, local government had undergone its ownrestructuring, with the boundaries of local governmentreconfigured to span both urban and rural areas. In parallelto this, government’s funding policies were reformed. Thededicated water supply and sanitation funding (previouslyallocated to the national department responsible for water)was aggregated with other grants into a two-channelmunicipal grant system: a conditional capital grant and anunconditional operating grant. The capital grant, called theMunicipal Infrastructure Grant, was intended to supportinvestment in municipal infrastructure serving poor people.The role of national government thus changed from directinvolvement in project design and implementation, to thatof sector leader, supporter, and regulator.This recent history puts the service delivery pathway incontext, which can then be explored in detail using theCSO2 scorecard, an assessment tool providing a snapshotof reform progress along the service delivery pathway. TheCSO2 scorecard assesses the building blocks of servicedelivery in turn: three building blocks which relate toenabling services, three which relate to developing newservices, and three which relate to sustaining services.Each building block is assessed against specific indicatorsand scored from 1 to 3 accordingly.19A major driver for sector reform has been the nationalpolitical priority to rapidly provide basic services tohouseholds previously disadvantaged under the apartheidgovernment. A second driver of reform has been theConstitutional imperative to devolve the responsibility ofwater services to local government. A third driver of reformhas been the reform of inter-governmental funding,moving from dedicated and project-based funding to anapproach of “budget support” between national and localgovernment, within a stable and predictable medium-term(three-year) budgeting framework.The enabling environment for facilitating servicedelivery in South Africa is well developed. The policiesand legislation were developed early in the reformprocess (with sanitation policy lagging a little behind),and provided a sound basis on which to proceed. Forexample, the Community Water Supply and Sanitationprogram was accompanied by a White Paper, one ofthe first policy papers of the new government. Sectorlegislation was promulgated within four years of the newgovernment coming
Monitoring Programme). South Africa has its own ambitious service coverage targets of 100 percent coverage for both water supply and sanitation by 2014. These targets are unlikely to be met for reasons elaborated below. Financial resources. South Africa has mobilized extensive resources to meet its service delivery targets. These are