Transcription
REPSOL SINOPECRESOURCES UK LIMITED2021 ENVIRONMENTAL STATEMENT
CONTENTS01INTRODUCTION02UK OPERATIONSFields & InstallationsOil & Gas ONMENTALPERFORMANCEEmissions to Atmosphere ofGreenhouse GassesDischarges to SeaOil in Produced WaterProduction ChemicalsDrilling & Pipeline ChemicalsAccidental ReleasesWaste Management18APPENDICESGlossaryData Table
Repsol Sinopec Resources UK Limited strives to provide a reliable, safeand efficient energy supply; to continuously improve to meet currentchallenges within the oil and gas industry and deliver environmentalperformance that meets or exceeds regulation.The new processes we put in place at the start of2020, and the continued resilience of our workforce,enabled us to successfully navigate the global COVID-19pandemic. Throughout this period, Repsol SinopecResources UK Limited remained committed to protectingthe environment, whilst providing a reliable and efficientenergy supply.In 2021 we further reduced our greenhouse gas emissions(expressed as CO2 equivalent) by 300,000 tonnes, whichis in line with Phase 1 of our Emissions Road Map toNet Zero. For 2022, we aim to reduce CO2e by a further190,000 tonnes.Our total mass of oil and produced water dischargedto sea reduced in 2021 and our overall oil in waterperformance remains well below regulatory limits. Inparallel, we are implementing further improvementsto continuously improve produced water managementacross our assets. Chemical use and discharge acrossour production operations remained consistent with theprevious year.Despite seeing year on year improvements through someof our key environmental indicators, we continue to setourselves demanding targets for improvement, ensuringprotecting the environment remains central to ourbusiness.Darren StokerChief Technical OfficerDuring 2021 we commenced platform-based drillingoperations at two of our sites; namely Claymore andPiper, with the first new wells being delivered on theseassets in 10 years and 20 years respectively.We reduced the number of accidental oil and chemicalspills in 2021, including a halving of oil spill events. Ourlargest spill for the year was from our Scapa subseafield, which was rectified via a Dive Support Vessel (DSV)campaign in Q2.Throughout 2021 we continued to work closely with ourwaste management vendor and their subcontractors todrive improvements and awareness at all our operatedinstallations. Overall waste generated in 2021 significantlydecreased from the previous year. Furthermore, year onyear, we continued to reduce the volume of waste sent tolandfill, achieved through onshore sorting.2021 ENVIRONMENTAL STATEMENT1
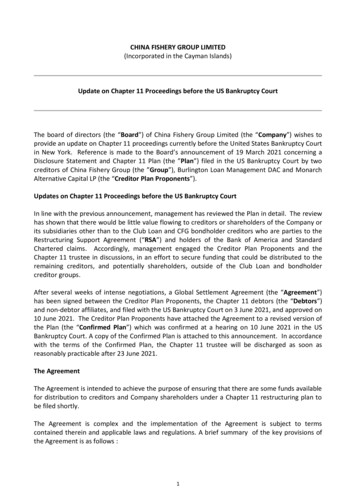
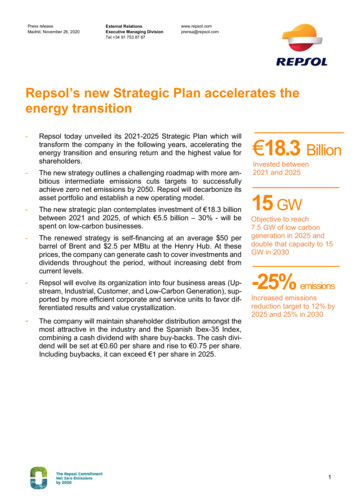
UK OPERATIONSFields and InstallationsOur principal UK operating areas, (shown below) encompass a total of 49 fields,11 operated assets and two onshore teminals detailed in Tables 1 and 2.FLOTTAPIPERCLAYMORESALTIRETARTANBEATRICEBLEO HOLMNIGGMONTROSEARBROATHABERDEENFULMARAUK2CLYDE
Oil & gas productionFIELDS & INSTALLATIONS Table 2Oil reservoirs contain a mixture of oil, water and natural gas.A primary purpose of an offshore production platform is toseparate out the extracted ‘well fluids’ into these three separatecomponents using separation vessels. Once the oil has beenseparated from the gas and water, it is pumped to shore viasubsea pipelines; or, in the case of oil from the Ross and Blakefields, shipped to shore. The gas is dried and then compressed.Some of the gas, where possible, is used to generate power torun the process equipment on site and the remainder of thegas is exported via pipeline to the UK mainland (see Table 1),used for gas lift, or 23aArbroathAuk30/16AukAuk North30/16n,tFulmarThe proportion of oil, gas and water produced from reservoirschanges over time. Oil and gas production will decrease andthe volume of water will increase. The separated water, knownas produced water, is managed, cleaned and processed toreduce oil droplets prior to discharge to sea.DrillingAs the fields mature and more information about the reservoirsbecomes available, more wells may be drilled or existing wellsrevisited. This can be done either from the platform, or withmobile drilling rigs. Geological information and productiontests determine how many wells are needed to produce the oiland gas efficiently.HYDROCARBON EXPORT ROUTES Table 1INSTALLATIONBeatrice11/30aBeatrice Complex1Beauly*16/21Balmoral*#Blake13/24bBleo HolmBrechin22/23MontroseBuchan21/01Buchan yley22/17sMontroseChanter15/17Piper BClaymore 14/1914/19ClaymoreClaymore tan 1Enoch*16/13aBrae*Flyndre 330/13 & 30/14ClydeFulmar30/16FulmarGalley15/23Tartan 1Godwin22/17n & 22/17sArbroathHalley30/12bFulmarHannay20/05cBuchan #Highlander14/20Tartan 1Iona15/17Piper 20Tartan 1Piper15/17Piper BRoss13/29Bleo tionOilGasShaw22/22aMontroseArbroathVia MontroseVia MontroseTartan 115/16Tartan 1AukVia FulmarN/ATartan North Terrace15/16bTartan 1Beatrice1Nigg Oil Terminal2 N/ATweedsmuir21/01aPiper BBleo HolmShuttle TankerFrigg PipelineWood22/18MontroseBuchanForties PipelineN/AAndrew*16/27aAndrew*Flotta bNorth Sea Producer*#16/21b,cBalmoral*#ClydeNorpipe PipelineSEGAL SystemFulmarNorpipe PipelineSEGAL SystemMontroseForties PipelineCATS PipelineStirling*Piper BFlotta PipelineFrigg PipelineWareham*98/06a,07aOnshoreSaltire1Via Piper BVia Piper BWytch Farm*98/06a,07aOnshoreTartan1Flotta PipelineFrigg Pipeline* Not operated by the company therefore data is not included in this report.#Installation no longer at location1Installation Not Normally Attended (NNA)2Within Decommissioning Phase3Assumed Operatorship 24th November 20212021 ENVIRONMENTAL STATEMENT3
ENVIRONMENTAL MANAGEMENTThe company has an integrated Safety and Environmental Management System (SEMS). Theenvironmental elements of the system have been independently verified as meeting therequirements of the Oslo-Paris Convention (OSPAR) Recommendation 2003/5 to promote theuse and implementation of Environmental Management Systems by the offshore industry.Minimise impact and continuousimprovementOur environmental commitment, as outlined in our corporate HSEpolicy, is to minimise our impacts and always comply with the lawor the company’s standards, whichever are higher. All environmentalaspects including climate change, air quality, water quality andwaste are issues that receive constant attention to minimise ourenvironmental impacts. The environmental impacts from oil and gasexploration and production activities have been minimised as far aspracticable through the design of the installations and subsequentmodifications made to plant and process.LEADERSHIP EXCELLENCACCOUNTABILEITY POSITIVITYThe CompanyPolicy isto cond causuct oure no habusinesrm to pes in a m minople;anner thimise ouat ensur impact comres we:on theply withenvironmenregulato choot;ryrequiremse safeentytsov;er maioperationtain analrestate ofsults;emergency prepThe obarednejectivesss.of this Poalwayslicy arecomplyto ensuwith there we:law or CooperatempouranyWe follow a two phase environmentalmanagement strategybusinessstandardto ensus, whichset goalsre proacever is ofand tartive riska highegets, anmitigatir standardd measuon andcommun;continure perfoicate opous imprormanceenly withagvement;ainst thethose whstrive tom;o may bepreventall accideaffectednts andbyare ableour activitieincidentsto respos;, prevennd to ant pollutioy foresen, use reseable emources susergency.tainablySAFE Oand capPERATitalise onThe first phase consists of the identification and characterisation ofour environmental impacts to determine their significance and howto manage them. This considers local environmental sensitivities,company and legislative performance standards and stakeholderconcerns.The second phase involves the development and implementationof environmental management strategies that are integrated withbusiness and operational systems, and are integral to all companyperformance improvement objectives: such as safety, installationintegrity and security of supply.HEA& ENVI LTH, SAFETYRONMENT POLICYIONS INlessonsIf operatlearned;ionALL COthis Polic al results everMPANYy over opcoACTIVIeration nflict with thisTIES ISal resultsPolicy,we all haA COREand Repsve a respol SinopVALUEonec Resources UK sibility to chooseLimitedwill supp compliance withort thatchoice.Jose Luis MoñozCEOIMS-POS-001, April 2020Our Corporate HSE PolicyTargets and objectivesOur Executive Committee sets annual environmental targets againstwhich performance is tracked. Each is set with a view to achieving theoverarching objective of continuous improvement. To ensure all ofour installations work towards achieving the targets, a performancecontract is agreed with the site leadership team and companypersonnel.Permits and consentsOur conduct in the North Sea is governed by a range of legislationand we are required to hold a number of permits and consents thatauthorise our operations. These permits and consents come withdetailed operating conditions to which we must adhere.We track and investigate non-compliance (permit breaches) tomeasure and continually improve the effectiveness of our systems,processes and procedures.4
ENVIRONMENTAL MANAGEMENTBY DESIGN AND MAINTENANCEOur installations are designed and maintainedto minimise their environmental impact.Primary impact mitigation measures have been integratedinto the design of the facilities and include:Closed system processes to safely contain reservoir fluids in vesselsand flow lines under all process conditions.Pressure, temperature, flow control and shutdown systems tomaintain safe operating conditions at all times.Bunding of areas with a potential for spills.Secondary defence measures are those that relate to the operationof the facilities and include:Corrosion prevention and monitoring programmes and preventativemaintenance programmes ensure that vessels, flow lines, valves,fittings and equipment remain in a safe operating condition.Consideration of all potential accident/emergency scenarios toensure procedures and resources are in place for prevention, controland mitigation.Procedures to minimise operational leaks and spills and ensureavailability of clean-up equipment to deal with spillages.Training of personnel to operate and maintain the above safeguardsin good working order.2021 ENVIRONMENTAL STATEMENT5
ENVIRONMENTAL PERFORMANCEEMISSIONS TO ATMOSPHEREOF GREENHOUSE GASSES
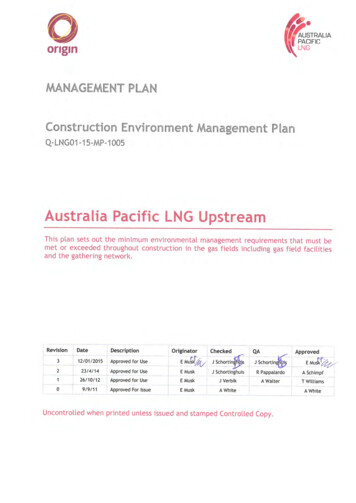
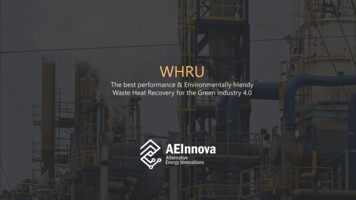
The Company recognises the importance of emissions management and reducing thecarbon intensity of its operations. The Company has developed an Emissions ManagementPlan which provides clear and demonstrable commitment to emissions reduction andpathway to 2050 Net Zero.The Company has developed its own road map to the 2050 Net Zero emissions goal. Whilst this is aligned to the Offshore EnergiesUK’s Road Map to Net Zero, it details the key steps the Company believes it will need to take in order to achieve Net Zero.100%90%80%70%60%1.6 millionTe CO2ePublishEmission PolicyGHG Trackingand KPIsDevelop OffsettingStrategyExplore use ofBiofuelsPhase 1 - Operational Improvements:- Auk power delivery- Auk gas venting improvement plan- Fulmar flare simplification- Improved Cyde gas export route availability- Claymore site lead reductions1.1 millionTe CO2eCreate EmissionReduction Hopper0.8 millionTe CO2eEstablish site EmissionReduction Focal Points50%Conduct reviewof site operationsOptimise flare and vent40%Develop and enact routine fibre strategyin line with World Bank Initiative30%20%10%0%Fugitive detect and repair strategyPhase 2 - Plant Improvements:- Flotta move to grid power study- Turbine upgrade Claymore and Piper study- BLP / Montrose A interconnector study- Bleo Holm flare reduction studyPhase 3 - Step Change Improvements:- H2 production and use at Flotta- Claymore / Piper wind power study- BLP to Arbroath power cable- Offshore electrification studies- Fulmar bypass- Bleo Holm bypass0.16 millionTe CO2ePhase 1 - Operational ImprovementsPhase 2 - Plant ImprovementsPhase 3 - Step Change ImprovementsPhase 4 - Business Diversification2018 2019 2020 2021 2022 2023 2024 2025 2026 2027 2028 2029 2030 2031 2032 2033 2034 2035 2036 2037 2038 2039 2040 2041 2042 2043 2044 2045 2046 2047 2048 2049 2050Figure 1Emission Road Map to Net Zero 2050One such step has been the development and publication of aGreenhouse Gas (GHG) emissions management policy, whichhas a purpose to establish and communicate the leadershipcommitment to Emissions Management and the 2050 Net Zeroemissions goal by the board, Executive Committee (ExCom),Executive Management Team (EMT), Senior Management,Employees and key Contractors.Since 2018 the Company has executed a number of emissionreduction initiatives which have helped reduce emissions. Asummary of the most notable are as follows:InitiativeEmissions Saving(Tonnes CO2e)Clyde flare reduction plan 100,000Piper flare optimisation 60,000Fulmar flare and vent reduction plan 35,000Installation of Fulmar to Auk powerinterconnector 25,000Montrose single export compressoroperations and flare optimisation 30,000Bleo Holm compressor valve tuning, pumpoptimisation and cold vent management 20,000The Company continues to explore opportunities for emissions’reductions across our portfolio, these opportunities fall into 4broad improvement categories:2021 ENVIRONMENTAL STATEMENTPhase 1 - Operational Improvements: Delivering emissionsreductions by changing the way we operate our existing plantand equipmentPhase 2 - Plant Improvements: Delivering emissions reductionsby plant upgrades and operational philosophiesPhase 3 - Step Change Improvements: Delivering emissionsreductions by larger scale changes such as platformelectrification, deployment of renewable power sources, CCSand hydrogenPhase 4 - Business Diversification: Delivering emissionsreductions by diversifying from oil and gas production2021 Emissions Performance:The extraction and processing of oil and gas is energy intensive.During normal operations, installations burn natural gas anddiesel for power. In addition, any natural gas extracted fromthe reservoir, that cannot be used or exported, has to be flaredfor safety reasons.The level to which different GHG’s contribute to Climate Changedepends on the gas. For example, 1 tonne of methane (CH4)has a much higher global warming potential than CO2. To fullyreflect the impact of our operations, GHGs are combined andexpressed as tonnes of CO2 equivalent (CO2e). In this reportall references to CO2e figures assume one tonne of CH4 tobe equivalent to 25 tonnes of CO2. We also use ProductionCarbon Intensity, that is, the tonnes of CO2e produced per unit7
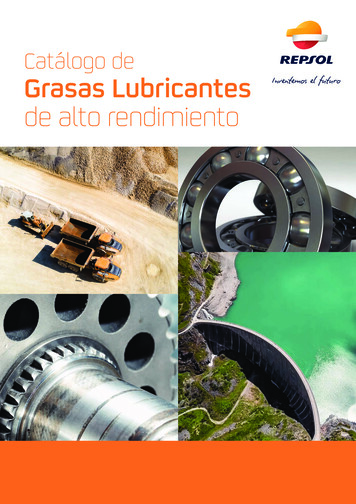
EMISSIONS TO ATMOSPHERE OFGREENHOUSE GASSES350,000of production (1000 Barrels Oil Equivalent (BOE)) as a measure ofproduction efficiency from a climate change 0,00040600,00020182019202002020Production Carbon IntensityFigure 2CO2 Equivalent emissions and production intensity annual trend (2018 - 2021)1,000,0002018800,000CO2e Emissions ,000Fuel GasFlareDieselOtherFigure 3CO2 Equivalent emissions by source stream (2018 - 2021)Figure 3 shows the contribution of CO2e from each source streamover the last 4 years. The company continues to optimise the useof fuel gas and avoid using diesel, however a number of unplannedshutdowns over the course of the year has contributed to thereduction in emissions from fuel gas and the increase in emissionsfrom diesel. As with previous years emissions from flare performancecontinues to improve, whilst the previously mentioned unplannedshutdowns contributed to this, across the assets there has been acontinued focus on minimising flare, through compressor tuning,identifying flare sources and reducing where possible, improvedperformance of gas sweetening plant. “Other” includes emissionsfrom venting and fugitive emissions also continue to decrease, againthis is due to maintaining steady operations, reducing cold flaring /venting in favour of hot flaring (whilst hot flaring continues to havea CO₂ emission, the amount of CH₄ emitted is much less than coldflaring / yClHolm0eo10Absolute CO2e Emissions8150,000Bl20200,0000200,00030400,00002021 NAP AllowanceAukCO2e (Te)60CO2e (Te)/mBOE701,200,0002021 CO2 Mass (t)250,000CO2 Emissions (Tonnes)1,800,0002020 CO2 Mass (t)300,000Figure 42021 / 2020 UK ETS CO2 emissions and free allowance per installationThe UK Emissions Trading Scheme (UK ETS) came into force in2021 after the withdrawal of the UK from the European Union. Thepremise of the UK ETS is fully aligned with that of the EuropeanUnion Emissions Trading Scheme (EU ETS) which was compliedwith prior to 2021. The UK ETS is the primary financial means usedto incentivise the reduction of CO2 emissions from larger industrialinstallations. The basic principal is that at the end of each yearqualifying installations must surrender an “emissions allowance”for each tonne of CO2 emitted. Some emission allowances are issuedfree of charge to the installation at the beginning of the year with theremainder required to be purchased.Figure 4 shows the total installation emissions against the totalfree allowance provision (National Allocation Plan (NAP)). UK ETSqualifying emissions relate to CO2 resulting from combustion onlyand does not take into account the CO2 equivalency for methaneand other uncombusted GHG’s. As can be seen not all sites qualifyfor a free allowance allocation, our onshore terminal, Flotta,is deemed as an electricity generator as it exports to the grid.Additionally, at the time of applying for free allocation under PhaseIV of the ETS Fulmar’s operational mode was changing and it wasdetermined that the installation would qualify for very little if anyat all, therefore a decision was made not to apply and hence it doesnot receive an allocation.In Q3 2020 the Tartan Installation ceased production withpreparatory works progressed to air gap and mothball equipmentprior to the installation formally becoming Not Normally Attended(NNA) in December 2021. This resulted in Tartan ultimately fallingout of the EU ETS at the end of 2020 as the installed combustionequipment fell below the 20 MWth threshold. As a result, there wasno longer a regulatory requirement to monitor and report emissionsannually via the UK ETS hence there is no 2021 CO2 emissions datareported in Figure 4.Figure 4 also highlights that the majority of installations havereduced the quantity of UK ETS qualifying CO2 emissions emitted in2021 compared to 2020. Piper had a significant improvement in itsCO2 emissions emitted in 2021 which were down to the rectificationof an issue with its amine plant which resulted in an extended period
EMISSIONS TO ATMOSPHERE OFGREENHOUSE GASSESof elevated flaring in 2020. The reduction in CO2 emissions fromClaymore in 2021 when compared to 2020 is a result of the extendedshutdown and the prolonged shut-in of the Scapa field resulting in asignificant drop in fuel gas use across the year.300,0002021 CO2 Mass (t) DieselCO2 Emissions (Tonnes)250,0002021 CO2 Mass (t) Flare2021 CO2 Mass (t) Fuel ttaFlydeClClaymorelmHoBleoAuk0Figure 52021 UK ETS CO2 emissions by source stream split per installationAs the above graphs demonstrate, the majority of assets havereduced the quantity of UK ETS qualifying CO2 emissions emittedin 2021 when compared to 2020. Figure 5 highlights the individualsource streams per installation that contribute to the total CO2emissions. The company is continually striving to optimisehydrocarbon fuel use and flaring activities in order to proactivelyreduce CO2 emissions in line with our GHG Emissions ManagementPolicy and drive to ensure a more sustainable business movingforward.2021 ENVIRONMENTAL STATEMENT9
ENVIRONMENTAL PERFORMANCEDISCHARGESTO SEA
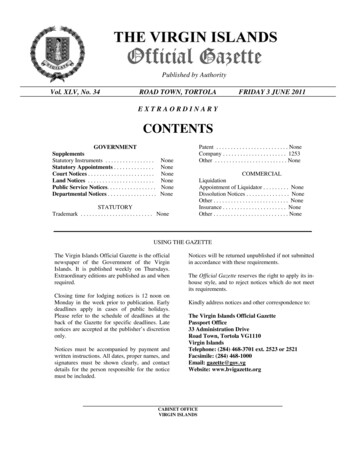
OIL IN PRODUCED WATER (OIW)The fluid extracted from our oil wells contains a mixture of oil, entrained gas and water. Theprimary function of our offshore installations is to separate the oil, gas and water beforesending the oil onshore and either reusing the produced gas as fuel, using it to aid lift in wells,or combusting it in the flare. The water is treated before it is safely discharged to 20151020182019Oil Discharged202020210Average OIW ConcFigure 6Annual Average Oil in Water Concentration and Total Mass ofOil Discharged to SeaFigure 7 illustrates the annual average OIW concentrations for eachoperating installation in 2021 with 2020 as a comparison. With theexception of Bleo Holm and Montrose, all other installations achievedbetter than the 30 mg/l threshold for discharges to sea in 2021.The North Sea is a harsh environment and inclement weather/seastates are not uncommon, during such instances the Bleo Holm FPSOexperiences vessel rolling. The rolling motion has a consequence onthe effectiveness of the separation system resulting in the inabilityto efficiently polish the discharge stream. As a result, during suchperiods, higher than normal concentrations of oil are dischargedwithin the produced water stream. This ultimately has a knock-oneffect to the annual average OIW concentration for the installation,which for 2021 was 39.3 mg/l.2021 ENVIRONMENTAL gure 7Installation Oil in Produced Water PerformanceMontrose and the Montrose BLP experienced OIW issues throughout2021 that were attributed to the 1st stage separator and level controlissues. The overall OIW figure for Montrose for 2021 was 43.3 mg/l.The Company proactively monitors OIW compliance across the sitesand where relevant Produced Water Improvement plans are generatedto support the return of sites into compliance. Such improvementplans are in place for both Bleo Holm and Montrose.2535025015200150101005Oil Discharged (Tonnes)PW Discharged (Million m3)3002050002019PW Discharged50OIW Limit (mg/l)352018Oil Discharged (Tonnes)Average OIW Conc (mg/l)30.0202040The total amount of produced water discharged from our assets during2021 was 12,881,466 m3. This discharge contained 324 T of dispersedoil at an average concentration of 25.13 mg/l.Figure 6 shows a 4.7 % decrease in the total mass of oil dischargedto sea in 2021 relative to 2020. This decrease in mass is directlylinked to not only the volume of produced water discharged, but alsothe concentration of oil within each discharge stream. Across ourinstallations we saw a modest 17 % decrease in produced water volumeon the previous year. This can be linked back to shut-in productionfrom some fields e.g. Scapa, an extended shutdown on Claymore andthe cessation of production (COP) from the Tartan Alpha Installationin August 2020. Figure 6 also shows a 14 % increase (3.25 mg/l) inthe Company average discharge concentration for 2021 compared to2020. This increase can be attributed to the accumulation, throughoutthe year, of numerous instances where sample discharges of morethan 100 mg/l were recorded. Such discharges were notified to theenvironmental regulator as OPPC non-compliances and are generallyattributed to process upsets and/or poor separation facilities linked todeteriorating weather in the case of Bleo Holm FPSO. In addition, Clydeexperienced OIW issues when Flyndre fluids were routed through theClyde process. The decrease in produced water volume would alsohave had a slight detrimental effect on the efficiency of the oil in waterseparation equipment. Although there was an increase in the annualaverage OIW discharge concentration, at a Company level, the averageconcentration remains below the permitted limit of 30 mg/l (av).202145OIW Concentration (mg/l)To protect the marine environment, industry regulators place strictlimitations on both the concentration and quantity of oil dischargedin produced water, with a drive towards minimising these dischargeconcentrations. At these low concentrations, the entrained oil quicklydisperses and is broken down by weathering and biodegraded bymarine microorganisms. The UK government enforces a standard,internationally agreed, emission limit value of 30 mg of oil per litre ofproduced water discharged (flow weighted average over one month),to which all our offshore installations must adhere to.20202021Oil DischargedFigure 8Annual Discharge Mass of Oil and Volume of Produced WaterAs outlined with Figure 6, the mass of oil discharged to sea is directlycorrelated to the volume of water and the concentration of oil withinthe discharge stream. Higher than normal concentrations of oil in thedischarge stream result in increased oil mass discharged to sea.Figure 8 highlights a decrease in mass of oil discharged to seathroughout 2021 in comparison to 2020 of 16 tonnes. Correlated to thisis a 17 % reduction (2,650,109 m3) of produced water discharged in2021 compared to 2020. This perceived drop when comparing against2020 can be attributed to a prolonged shutdown of the ClaymoreInstallation and the COP of the Tartan Alpha Installation in Q3 of 2020.Due to the nature of produced water, discharges can occasionallygive rise to an oil sheen on the sea surface around the installation.Periodically, either due to poor plant performance resulting insustained higher oil in waters, or calm weather, sheens can extendsome distance from the discharge point. Any notifications of sheensreported on our installations are investigated, and, if necessary, stepstaken to rectify the cause. Where these sheens are considered moresignificant than normal, and extend outside the Installation 500 mzone, we are required to notify the environmental regulator via a PON1Permitted Discharge Notification (PDN). During 2021 the Companyraised four such notifications which were attributed to significantsheens extending beyond the 500 m zone of the Montrose and ClydeInstallations.11
PRODUCTION CHEMICALSThe Company utilises a variety of chemicals within the offshore production process. Chemicalsare used to maintain and operate subsea infrastructure, improve the flow of fluids from thereservoir, aid separation, prevent corrosion and remove deposited solids within vessels.Production chemicals are then either exported with oil to shore, degraded within a closed loopsystem or discharged to sea from the produced water stream.7,000UsedMass of Chemicals (Tonnes)6,000Discharged5,000Some production chemicals used have a substitution (SUB) warning,meaning they contain a component that may present a hazard to themarine environment. An important part of the HMCS is the phasedreplacement of these harmful ure 103,000Usage of Chemicals with Substitution Warning 2018 - 20212,0001,00002018201920202021Figure 9Tonnage of Production Chemicals Used and Discharged per yearFigure 9 illustrates that there has been a slight decrease in productionchemical use in 2021 and the mass discharge of production chemicalsis comparable with that of 2020. This minor decrease could primarilybe linked to the Cessation of Production (COP) of the Tartan AlphaInstallation in Q3 2020 and there may be some correlation withsteady operations with less plant trips on the other installationswhere chemical use will have been optimised accordingly. Activityon all the installations throughout 2021 was similar to that of 2020where only essential works were carried out as a result of the ongoingGlobal Pandemic and availability of personnel. The slight increase inproduction chemicals discharged could be associated with a return tonormal production on Bleo Holm after a prolonged shutdown in 2020and increased usage of chemicals on Piper due to the unavailabilityof the amine plant. There were also observed decreases in overallinstallation usages of production chemicals on Claymore as a result ofa planned shutdown and the Scapa field being offline for most of 2021and Clyde experienced operational problems with flowing the Flyndresubsea field.As per 2020, the Company maintained steady production uptimeacross the fleet, which leads to a reduction in inefficient chemical uselinked to start-ups and shutdowns, during which large quantities ofchemicals are often utilised to maintain or help stabilise the process.12Throughout 2021, the Company expanded its Decommissioningportfolio, with the Tartan installation transitioning to COP in Q3 2020and becoming Not Normally Attended (NNA) by mid-December 2021.As a result of the change in mode of operation and all the preparatorywork to engineer down and clean systems onboard prior to formaltransition to NNA this led to a reduction in production chemical useacross this installation.Sub Chemical Usage (Tonnes)The use and discharge of production chemicals offshore is heavilyregulated through the approval of a chemical permit for eachinstallation, as well as the use of pipeline or well intervention chemicalpermits, which incorporate regulatory limits for each chemical used anddischarged. Chemical use and discharge offshore is regulated throughthe Offshore Chemicals Regulations (OCR) 2002 (as amended). Theseregulations implement the OSPAR Decision 2000/2 on a HarmonisedMandatory Control System (HMCS) for the Use and Reduction of theDischarge of Offshore Chemicals on the UK Continental Shelf. The HMCSdetails requirements for the comprehensive testing, ranking, hazardassessment and risk management of chemicals and, in addition, thesubstitution of certain chemicals by less hazardous alternatives. TheCompany ensures all production chemicals used during our offshoreoperations are covered, including the use and
The company has an integrated Safety and Environmental Management System (SEMS). The environmental elements of the system have been independently verified as meeting the requirements of the Oslo-Paris Convention (OSPAR) Recommendation 2003/5 to promote the use and implementation of Environmental Management Systems by the offshore industry.