Transcription
Eindhoven University of TechnologyMASTERMulti-echelon safety stock optimization under supply, process and demand uncertainties as apart of operational risk managementa case study in the pharmaceutical industryvan Cruchten, A.P.M.Award date:2016Link to publicationDisclaimerThis document contains a student thesis (bachelor's or master's), as authored by a student at Eindhoven University of Technology. Studenttheses are made available in the TU/e repository upon obtaining the required degree. The grade received is not published on the documentas presented in the repository. The required complexity or quality of research of student theses may vary by program, and the requiredminimum study period may vary in duration.General rightsCopyright and moral rights for the publications made accessible in the public portal are retained by the authors and/or other copyright ownersand it is a condition of accessing publications that users recognise and abide by the legal requirements associated with these rights. Users may download and print one copy of any publication from the public portal for the purpose of private study or research. You may not further distribute the material or use it for any profit-making activity or commercial gain
Eindhoven - March 20, 2016Multi-Echelon Safety Stock Optimization underSupply, Process and Demand Uncertainties as a partof Operational Risk Management:A Case Study in the Pharmaceutical IndustrybyArjan Pierre Marie van CruchtenABSc Industrial Engineering & Management ScienceStudent identity number 0738159in partial fulfillment of the requirements of the degree ofMaster of Sciencein Operations Management and LogisticsSupervisors:Prof. dr. A.G. de Kok, Eindhoven University of Technology, OPACDr. W.L. van Jaarsveld, Eindhoven University of Technology, OPAC
TUE. School of Industrial Engineering.Series Master Theses Operations Management and LogisticsSubject topics: supply chain management, supply chain risk management, operational risks, inventorymanagement, multi-echelon safety stock optimization, supply uncertainty, process uncertainty,demand uncertainty, seasonality, pharmaceutical, case study
I. PrefaceI. PrefaceThis report is the outcome of my graduate internship and symbolizes not only the end of this project,but also the completion of the master Operations Management & Logistics at Eindhoven University ofTechnology. All in all, my professional and personal competences developed through my study andgraduation project and right now I feel well-prepared to start my professional career. Therefore, I wouldlike to thank the many people who have supported me.I would like to thank Ton de Kok in particular. Ton fulfilled the role as first mentor and I did not onlyget to know Ton as an extremely knowledgeable and experienced expert in the field of Supply ChainManagement (SCM), but also as a social, ambitious and friendly mentor with a good sense of humor.During the graduation project, I more and more appreciated his “know-how”, commitment and hisinspiring enthusiasm about SCM-related topics. Despite his busy schedule, Ton took time to superviseand he even visited me at LSC. I am glad that Ton encourages students to conduct their graduationproject in collaboration with industry, because it is both professionally and personally a valuableexperience. Ton, thanks for the opportunity to graduate under your supervision within the field of SCM!Willem van Jaarsveld supported me as second mentor and gave me trust in my approach and my results.Thanks to Willem for those valuable moments, because it increased my motivation during tough phases.Next, I would like to thank my supervisors from LSC for both the opportunity to conduct my graduateinternship at LSC and their time to supervise. At forehand, I was told about stereotypes in the Germanworking culture, such as hierarchy, extremely serious and an exclusive focus on content. However, myexperience is that the Dutch and German culture is more similar than both of us would like toacknowledge. Both of you were interested in my research and your trust increased my motivation andmade me feel responsible. Both of you tried to offer support in case it was needed and both of youshowed me that the stereotypes did not apply at all.I also would like to thank my colleagues (from other divisions), who showed interest in the multiechelon safety stock optimization project and helped me, where necessary. Opinions in favor ofLLamasoft challenged me and increased my motivation to pursue my comparative study.Then, I would like to thank my friends from my hometown and my friends in my student cityEindhoven, who sometimes complained that I was away for such a long time. As a result, the momentswe met became even better and I truly believe that this will stay the same after my graduation.I also would like to thank my parents, who encouraged me to study and supported me during mygraduation project and stay in Germany. It is great that you gave me the freedom to pursue my dreams.Last but not least, I would like to thank Sophie, with whom I experienced my German journey from thebeginning onwards. Sophie, although you were living 700 kilometers away, you supported me. When wewere together in “our city” Munich, it was easy to forget about the project, which dominated my stayhere. Let us all see how my German journey continues Arjan van Cruchteniii
II. AbstractII. AbstractThis research project contains a qualitative and quantitative assessment of the company’s currentrisk management methodology and two multi-echelon safety stock methods, which are based on theGuaranteed Service Time (GS) Approach and the Synchronized Base Stock Policies (SBS) Approach. Thecase study is conducted for a primarily convergent supply chain at a pharmaceutical company in a nonstationary environment under supply, process and demand uncertainties in a challenging batch/mixenvironment. The qualitative assessment lists the pros and cons of the company’s current supply chainrisk management approach. The qualitative assessment also lists the pros and cons for the selectedmulti-echelon safety stock methods and tools. The quantitative analyses show again the moreconservative safety stock allocation for convergent network structures according to the GS approach incomparison to the SBS approach. That seems to complement the finding about more conservativeaverage stocks according to the GS approach in convergent networks in De Kok & Eruguz (2015).Although this research shows that the downstream safety stocks of GS are smaller than for SBS, it offersthe insight that GS puts relatively most of its safety stocks downstream in the considered convergentnetwork. Based on the case study, doubts have grown about the empirical validity of LLamasoft’s safetystock optimization module. LLamasoft’s optimized safety stock levels only achieve, according toChainScope’s validated base model with item-based random yield and inventory constraints, a 57.5%instead of 97.5% service level. This is explained by LLamasoft’s end-item inventories, which are 50%lower, and that is most likely caused by other methodological assumptions about, for example, materialavailability. A further evaluation shows that these substantial service level deviations do not occur forsingle- and two-stage serial networks, but do occur for the company’s convergent network. Anevaluation of a reduced supply chain –the three most downstream stages- even shows that thedownstream assembly step contributes to the majority of the service level decrease (60.4%). Theresearch also shows that for ChainScope the inclusion of yield ratios smaller than 1 increasessignificantly the overall safety stock allocation and changes the distribution among product types.Another investigation shows that the inclusion of inventory constraints increases finished good safetystock levels and reduces component safety stock levels with respect to ChainScope. LLamasoft appearsto be indifferent for both yield and inventory constraints.In addition, the study confirms again the empirical validity of ChainScope. Furthermore, the studyidentifies common causes for deviations during model validation, such as human behavior that affectsnorm settings. Finally, the project contributes to the observed gap that safety stock optimizationprocedures are often not described in detail. This report explains both GS’s and SBS’s solutiontechnique, defines the input of both models mathematically and proposes a procedure to deal withseasonality.iv
III. Management SummaryIII. Management SummarySupply chain (SC) risks form an increasing concern for Life Science Company (LSC). Therefore, LSCrequested an evaluation and improvement of the SC risk management approach and their safety stockallocation method, which should buffer against operational risks:Main research question: What is for LSC’s business environment qualitatively and quantitatively the“best” risk management methodology, which is able to assign multi-echelon safety stock levels?SRQ1: What is the qualitative performance of LSC’s current supply chain risk management method?Although the current approach is a complete, quantitative, multi-disciplinary strategic riskmanagement tool that is suited to identify both demand and supply risks, the LSC Method is undesireddue to its single-echelon approach, stage-level granularity, excluded product types, parameter usage,yearly periods and the lack of supplier and country involvement in the risk management process. Thisdisaffects the quality of the safety stock settings among product types.SRQ3: What is the qualitative performance of LSC’s and ChainScope’s and LLamasoft’s multi-echelonsafety stock optimization method?In contrast to LSC’s method that is discussed above, ChainScope and LLamasoft have an academicbasis, are multi-echelon, can deal with shelf life and product changes, and allow for safety stock settingfor all items on an item level, which can be directly implemented in SAP.Specifically for ChainScope: It is empirically valid, concise and offers the possibility to deal with itembased random yield. However, ChainScope is not able to deal with very small BOM quantities and multiperiod models at once. Item-based yields are restricted to be smaller than or equal to 1.Specifically for LLamasoft: It relies on an advanced demand pattern analysis, which should give abetter density function. Furthermore, LLamasoft performs multi-period optimization runs at once.However, except from the operational flexibility assumption and the ignorance of yield, the majordrawback of LLamasoft’s optimization is the lack of transparency about the formulae as well as theheuristics for the recommended lead time demand distributions and inventory control policies.SRQ2: What is the quantitative performance of LSC’s and ChainScope’s and LLamasoft’s multi-echelonsafety stock optimization method under different scenarios?Before one can judge about the quantitative performance, one should first validate with LSC’s datathe ChainScope model, which is based on Synchronized Base Stock Policies (SBS), and the LLamasoftmodel, which is based on the Guaranteed Service Time (GS) Approach. ChainScope is validated with itsanalytical evaluation mode and appeared to be valid. It achieved a service level of 97.5%, where inpractice 100% is reported. LLamasoft’s (GS) optimization model input is validated with its built-indiscrete event simulation. The simulated service level matched the reported service level. Althoughdeviations occurred between the simulated and historical finished goods inventory levels, the model isconsidered as valid. Table 3 explains valid reasons for those deviations, such as human interventions.From the “Actual” safety stocks, it is known that the reported service level is 100%. Unfortunately,the service level of the LSC Methods could not be assessed with ChainScope’s evaluation mode due tothe brand-stage level granularity.v
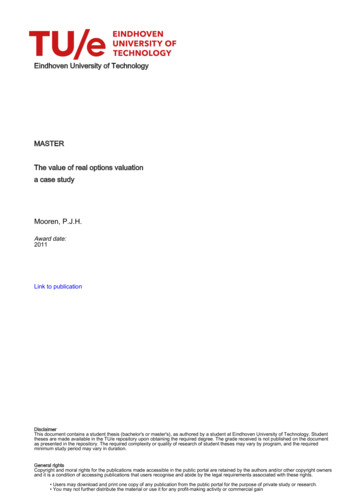
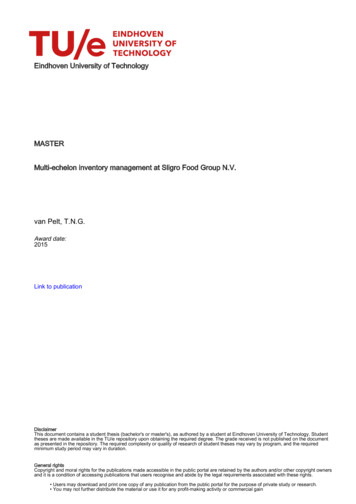
III. Management SummaryChainScope is empirically valid for LSC’s data and it has been used to evaluate the service level ofLLamasoft’s optimized inventory levels. LLamasoft optimized the safety stocks under a 97.5% servicelevel constraint and only achieved a 57.5% service level according to ChainScope’s evaluation. Jongenelis(2014) reported a similar service level decrease based on LLamasoft’s safety stocks in his simulationstudy within LLamasoft. Strong doubts exist about the empirical validity of LLamasoft’s safety stockoptimization, because i) ChainScope is empirically valid and only the average inventory has beenchanged and ii) a verification within LLamasoft in Jongenelis (2014) also showed large deviations.The service level difference is explained by 50% less end-item average inventory, which is caused bymethodological assumptions, such as 100% material availability at predecessors. Furthermore, De Kokand Eruguz (2015) and this study found evidence that it is related to the convergent network structure.Although yields and inventory constraints increase ChainScope’s safety stock levels, they do notsignificantly affect the service level in ChainScope’s evaluation: users namely specify the averageinventory and ChainScope’s algorithms search the best control parameters. In case yield and inventoryconstraints are given, the control parameters change, such that the average inventory remains similar.Where inventory constraints are considered as essential to reflect shelf life and frequent productchange considerations, one can discuss about the need of random yields (Y 1). Therefore, Figure 1shows in the first two bars a ChainScope (CS) model with yield respectively without yield underinventory constraints (ST). The colored stacked bars represent the 7 defined product types. A modelwithout yield (Y 1) reduces the average safety stock days of supply by roughly 30%, which is a 35%safety stock product value reduction that can be used for yield improvement programs. Although thedifference with LLamasoft (LL) tends to decrease, the difference remains significant and is also partiallycaused by ChainScope’s sensitivity to inventory constraints (Chapter 4.1.3).Figure 1, The Impact of Item-based Random Yield on Safety Stocks in ChainScopeThe results of the quantitative comparison between product types, methods and over time areshown in average safety stock days of supply in Figure 2. The key findings are summarized in Table 1.Figure 2 shows the safety stocks of ChainScope’s defined base model, which are substantiallyincreased and shifted by item-based random yield and inventory constraints.The first four striped bars represent the average yearly LSC values (PC Pipeline controller’sadjustment), the mottled bars represent ChainScope’s (CS) optimized monthly values, and thecheckered bars represent LLamasoft’s (LL) optimized monthly values.The big red arc on the right side represents an “infeasibility gap”: LLamasoft’s safety stocks aresubstantially lower than ChainScope’s base model, but they do not meet the desired service level of97.5% according to ChainScope’s evaluation. Therefore, ChainScope is preferred over LLamasoft asmulti-echelon safety stock optimization tool and LLamasoft’s cost advantage is ignored.vi
III. Management SummaryFigure 2, Average Safety Stocks between Product Types and Methods over TimeChainScope’s results are also more trustworthy in comparison to Actual and System Settings, whichpartially contain safety stock against supply uncertainties. However, it is considered infeasible to removethose stocks from the comparison. Next, LLamasoft’s and ChainScope’s base model results are withoutany exception-based material and resource flexibility measures, such as described in Table 3, which canmake them in practice even less expensive. Furthermore, Figure 1 has shown the safety stock inflatingimpact of yield in ChainScope, which makes ChainScope even less expensive under stable yield.The LSC Method is not the preferred approach, because it is single-echelon, the service level couldnot be assessed due to its granularity and the allocations deviate from ChainScope’s and LLamasoft’s. AsChainScope’s base case model is empirically valid, multi-echelon, expected to be less expensive thanActual and System Settings and suggests safety stocks that deviate the least from the in practice seensafety stocks, which make a service level maintenance likely, it is the preferred multi-echelon method.Table 1, Key Findings from the Quantitative ComparisonKey Findings1 Although ChainScope’s total and product type allocation structurally exceeds LLamasoft’s, thedirections of change are often similar.2 Where ChainScope allocates relatively more SS DOS upstream, LLamasoft does the opposite at FGs.3 Although ChainScope and LLamasoft are modelled without any exception-based material andresource flexibility measures, Actual and LSC’s System Settings are still expected to be higher.4 The comparison between Actual and System Settings is disturbed by seasonal stocks, minimumorder quantities, large lot sizes, forecast bias and accuracy, and scrapping policies.5 The LSC Method significantly deviates from LLamasoft’s and ChainScope’s product type allocation.6 Pipeline controller’s higher allocations on FGs lead to product value convergence with ChainScope.7 Safety stocks are dynamic over time, but are not mainly driven by seasonality.8 Decreasing order of costs: System Settings Actual ChainScope LSC (both) ( LLamasoft)9 Zero safety stocks at TUB and FG at SC GER can be explained by a flow concept to the next stage.10 Although ChainScope exploited SS DOS at all stages, LLamasoft only at PACK, FOIL, BULK and FG.vii
III. Management SummarySRQ4: What is the overall most desired safety stock optimization method?ChainScope is based on the qualitative and quantitative evaluation the recommended multi-echelonapproach. Important aspects are the method’s empirical validity at LSC and other companies, the safetystocks that better approach the current safety stock levels and give confidence about the claimedservice level, and the expected costs benefits compared to Actual and System Settings. Moreover, costdifferences tend to increase when yield appears to be stable.SRQ5: How should LSC implement the overall best supply chain risk management methodology?The implementation is answered by a strategic, tactical and operational recommendation as well as agraphical representation of the redesigned strategic and operational risk management approach:R1: Invest in more quantitative and advanced risk management methodologiesThe SC and Risk Management Maturity Model showed that mature stages differ from immaturestages by using more extensively quantitative risk management techniques. Simchi-Levi (2015) foundthat mature companies outperform immature companies on all surveyed operational and financial KPI’s.The assertion is that LSC can improve its maturity by more quantitative and advanced risk managementmethodologies. This positively affects KPI’s, such as delivery performance, cycle time and inventory DOS.R2: Slightly extend the current approach and include multi-echelon safety stock optimization modelsAlthough the qualitative and quantitative evaluation show the acceptable quality of the currentapproach, the qualitative and quantitative evaluation also show the more preferred benefits of multiechelon safety stock models. In fact, multi-echelon methods characterize the highest stage of inventorymanagement professionalism. This stage leads to the highest cost savings and service level potential andwould be the logical next step for LSC. Besides the inclusion of multi-echelon safety stock optimization,some slight extensions, such as a change in the granularity, are included in the redesign (Figure 3).Therefore, this redesign leads to an integrated strategic and operational risk managementmethodology.R3: Apply ChainScope to benefit from a risk-free cost reduction and service level maintenanceAs found in the quantitative and qualitative analyses for the multi-echelon models, ChainScopeshould be deployed, because it is expected to maintain the service level and to reduce the inventoryholding costs in comparison to Actual and System Settings. In case management decides to applyChainScope, LSC should update the models with forecasts, automate the data pre-processing, andextend the scope to more pipelines and countries. LSC should also reassess the safety stocktransformation formula that caused some unexpected directions in the scenario analysis. Furthermore,special attention needs to be paid to the exact yield modeling technique and the item-level inventoryconstraints that both heavily increase safety stocks. Furthermore, LSC should follow the described stepsin the redesign.As some factors, such as inventory targets, budgets for licensing and human resources, are notincluded in the qualitative and quantitative assessment, the operational implications for implementationare given in Chapter 7.2 for i) the multi-echelon tools and ii) an improvement of the current safety stocksetting method.viii
III. Management SummaryRedesigned Operational Risk Management MethodologyBefore WorkshopPreparationBrainstormRisk Acceptance6. Identify TheFailure Modes PerSegment8. Determine TheYearly FrequencyPer Failure Mode13. Standardize TheYearly Impact In“API Quantity” Or“financial Value”14. Accept/RejectThe SuggestedFailure ModesSafety StocksAgainst SupplyAnd DemandUncertaintySafety StocksSafety StocksAgainst Demand Against SupplyUncertaintyUncertainty15a. CommunicateAccepted Disruptive RiskMitigation Strategies ToProcess Owner(s)Approval,Communication,Implementation, Monitoring,ReportingOperational Risks7. Determine TheImpact Per FailureMode In “Time” Or“Quantity Affected”15b. Select TheAccepted OperationalRisks That Are BufferedBy Safety Stock17b. Assess Non-StationarityAnd Determine TheAppropriate (Stationary)Bucket Length21. Take The MaximumOf The Safety StocksAgainst Demand AndSupply Risks24.Approval Of SafetyStock Proposal By HQ, SiteManagement And CountryRepresentative(s)16a. ImplementMitigationStrategies4. Segment TheMapped SC9. Classify RisksBased On FrequencyAs Operational OrDisruptive Risks17a. Monitor And ReportThe Effectiveness AndPossibly Adapt The Mit.Strategy5. Invite A MultidisciplinaryGroup Of Experts Along TheEnd-To-End Supply Chain10. Brainstorm ForAppropriate MitigationStrategies AgainstDisruptive Risks18a. Communicate Identified DisruptiveRisks, Estimated Impact And FrequencyAnd The Mitigation Strategies To TheEnterprise Risk Management Team16b. Convert The Brand-StageImpact And Frequency ForOperational Risks To IndividualSafety Stocks18b. Validate The Model In TheEvaluation Mode In“ChainScope” And Correct IfNecessary22. Assess The ProductionFeasibility And ReceiveFeedback From Local SitesAnd CWs25. CommunicateAccepted SafetyStocks To LocalSite(s) And CWs19. Acquire AndCalculate InputData For“ChainScope”20. Run ChainScopeFor All Time BucketsWithin The TimeHorizon23. Make A ProposalFor Safety Stocks AndScheduled Margin Keys26. Implement TheSafety Stock LevelsLocally In The SAPModuleFigure 3, Redesigned Operational Risk Management Approachix27. MonitorMonthly TheActual Vs NormPerformance28. Report ThePerformanceQuarterlyChapter 2.1.511. Assign ProcessOwners Per FailureModeChapter 2.1.5//Run At Once For All Products From All PipelinesAfter WorkshopDisruptive Risks12. Validate ExpertEstimations ByHistorical Data3. Map TheComplete SC2. Select A PipelineRepeat For All Selected Product Groups And Pipelines1. Select A ProductGroupDuring WorkshopAdditional Info:/Chapter 3.1.2Chapter 3.1.3Chapter 3.1.4Chapter 2.1.5Chapter 4.1.3/
III. Management SummaryAcademic question: What has been the contribution of this project to academia?First, the results proof again the more conservative safety stock allocation for convergent networkstructures with the GS approach, which seems to complement the finding about average stocks in DeKok & Eruguz (2015). In addition, this research shows that GS/LLamasoft puts the majority of itsallocated safety stocks downstream for this convergent network structure. However, the describedservice level performance of LLamasoft in ChainScope’s evaluation raises questions about its empiricalvalidity. An evaluation has also shown that such a service level deviation does not occur for single- andtwo-stage serial networks (99%), but does occur for LSC’s convergent network (57.5%). The evaluationhas also shown that the largest contribution to the service level decrease is caused by the mostdownstream packaging step (60.4% for the reduced downstream network). All in all, LLamasoft appearsto propose for this network an empirically invalid result. Further research is required for other networktopologies.Additionally, the tested sub hypotheses and scenario analysis also provide insights in the safety stockdynamics (Table 2).Second, the project proofs again the empirical validity of ChainScope for networks similar to that ofLSC. The report also identifies generic difficulties of model validation (Table 3).Third, the project partially contributes to the lack of safety stock optimization procedures by adetailed explanation of the input parameters and a proposed approach to deal with non-stationarydemand. In fact, it provides a generic redesigned operational risk management approach (Figure 3).Table 2, Summary of Sub Hypotheses and Scenario AnalysisSub HypothesesA) Multi-echelon models allocate less safety stock than LSC’s single echelon methodB) LLamasoft’s safety allocation in assembly networks is more conservative –which refersto less safety stocks- than ChainScope’sC) Relative differences between LLamasoft and ChainScope decrease in terms of safetystock value in comparison to safety stock days of supplyD) ChainScope’s and LLamasoft’s safety stock allocations in contrast to LSC’s are relativelydynamic over timeE) ChainScope’s, LLamasoft’s and LSC’s safety stock allocations show always a similardirection, but a different magnitude for different jectedTable 3, Reasons for Deviations During Model ValidationToolChainScopeand LLamasoft(common)Identified ReasonsHuman interventionsaffect norm valuesData tionOther definitionsOther limitationsExample(s)Humans steer with lead time reducing activities, such as rushlead times (priorities, air instead of sea freight) and combinedshipmentsHistorical data, estimations, deviation between SAP andActualStochastic demands with limited inventory can never reach a100% service levelThe amount of lost sales is estimated by humans instead ofcountedBuilt-in decision rule functionalities in the tool(Fixed s,S-DOS levels, FIFO, Transport Modality)x
IV. List of AbbreviationsIV. List of iidkgKPILPLSCMESMRP IMTFPCPRODUCTSBSSCSCSC GERSCMSCOPSCRMMSKUSRQSSSSSS DOSSSOSSPVUSWIPActive Pharmaceutical IngredientAmerican Production and Inventory Control SocietyAdvanced Planning SystemBill of MaterialCustomer Order Decoupling PointCoefficient of VariationCountry WarehouseDays of SupplyForecast AccuracyFinished GoodGuaranteed Service Time ApproachGlobal Supply Chain ManagementIndependent and Identically DistributedKilogramKey Performance IndicatorLinear ProgrammingLife Science CompanyManufacturing Enterprise SystemMaterial Requirements Planning IMake-to-ForecastPipeline ControllerConfidentialSynchronized Base Stock PoliciesSupply CenterSupply ChainSupply Center GermanySupply Chain ManagementSupply Chain Operations PlanningSupply Chain Risk Management MethodologyStock Keeping UnitSub Research QuestionSafety Stock in UnitsStochastic Service ApproachSafety Stock Days of SupplySafety Stock OptimizationSafety Stock Product ValueUnited States of AmericaWork In Processxi
V. List of SymbolsV. List of TMmMax InvMax SS DOSMLSmmnOActual Production DateActual Start DateActual Subset Yearly DemandAdded ValueBasic End DateBase QuantityCleaning TimeCalculated Lot SizeOn-Hand StockDemandDays Between ProductionsDays Between ReplenishmentsDaily DemandDaily Demand Standard DeviationDays of Supply Planned Lead TimeDelivered QuantitySet of End ItemsSet of External ItemsFractionForecast AccuracyForecast InaccuracyFixed Lot SizeForecasted Total Yearly DemandGoods Issue TimeGoods Receiving TimeStandard Loss FunctionInventory Holding CostsItemSet of Intermediate ItemsSet of Internal ItemsImmediate Lead TimeLocal Inventory PositionShipments during the lead timeLocal On-Hand Stock LevelSafety FactorLead TimeSet of Yearly MonthsMarginMaximum InventoryMaximum Safety Stock in Days of SupplyMinimum Lot SizeMonthNumber of Production/Procurement OrdersCumulative Outstanding Ordersxii
V. List of SOLTspSPSSSSASS DOSSS MOSSTsuttTTTUSUTWDWDSTDxXyYYDµ𝛔Order SizeOrdered QuantityPurchasing Price or Internal ValuePlanned Delivery TimePlanned Lead TimeProportion of Subset from Total DemandProduction TimeTotal Production Time (incl. set-up)Production QuantityBOM QuantityLot SizeReview PeriodReplenishment Lead TimeReorder pointOrder-up-to-levelSet of Shipped Items(Actual) Service LevelService Level TargetScheduled Margin Key BeforeScheduled Margin Key AfterSource Lead TimeStock PointSelling PriceSafety Stock in UnitsActual Safety StocksSafety Stock Days of SupplySafety Stock Months of SupplyService TimeSet-up TimeTimeNumber of Time PeriodsTransportation TimeUnits ShortUnit TimeWeekly DemandWeekly Demand Standard DeviationProduction MomentEchelon On-Hand Stock levelYield RatioEchelon Inventory PositionYearly DemandMean Daily DemandStandard Deviation of Demandxiii
VI. List of FiguresVI. List of FiguresFigure 1, The Impact of Item-based Random Yield on Safety Stocks in ChainScope . viFigure 2, Average Safety S
drawback of LLamasofts optimization is the lack of transparency about the formulae as well as the heuristics for the recommended lead time demand distributions and inventory control policies. SRQ2: What is the quantitative performance of LSs and hainScopes and LLamasofts multi-echelon safety stock optimization method under different scenarios?