Transcription
Data Min Knowl Disc (2009) 18:140–181DOI 10.1007/s10618-008-0114-1Controlled experiments on the web:survey and practical guideRon Kohavi · Roger Longbotham ·Dan Sommerfield · Randal M. HenneReceived: 14 February 2008 / Accepted: 30 June 2008 / Published online: 30 July 2008Springer Science Business Media, LLC 2008Abstract The web provides an unprecedented opportunity to evaluate ideas quicklyusing controlled experiments, also called randomized experiments, A/B tests (and theirgeneralizations), split tests, Control/Treatment tests, MultiVariable Tests (MVT) andparallel flights. Controlled experiments embody the best scientific design for establishing a causal relationship between changes and their influence on user-observablebehavior. We provide a practical guide to conducting online experiments, where endusers can help guide the development of features. Our experience indicates that significant learning and return-on-investment (ROI) are seen when development teamslisten to their customers, not to the Highest Paid Person’s Opinion (HiPPO). We provide several examples of controlled experiments with surprising results. We reviewthe important ingredients of running controlled experiments, and discuss their limitations (both technical and organizational). We focus on several areas that are criticalto experimentation, including statistical power, sample size, and techniques for variance reduction. We describe common architectures for experimentation systems andanalyze their advantages and disadvantages. We evaluate randomization and hashingtechniques, which we show are not as simple in practice as is often assumed. ControlledResponsible editor: R. Bayardo.R. Kohavi (B) · R. Longbotham · D. Sommerfield · R. M. HenneMicrosoft, One Microsoft Way, Redmond, WA 98052, USAe-mail: ronnyk@microsoft.comR. Longbothame-mail: rogerlon@microsoft.comD. Sommerfielde-mail: dans@microsoft.comR. M. Hennee-mail: rhenne@microsoft.com123
Controlled experiments on the web141experiments typically generate large amounts of data, which can be analyzed usingdata mining techniques to gain deeper understanding of the factors influencing the outcome of interest, leading to new hypotheses and creating a virtuous cycle of improvements. Organizations that embrace controlled experiments with clear evaluation criteria can evolve their systems with automated optimizations and real-time analyses.Based on our extensive practical experience with multiple systems and organizations,we share key lessons that will help practitioners in running trustworthy controlledexperiments.Keywords Controlled experiments · A/B testing · e-commerce ·Website optimization · MultiVariable Testing · MVT1 IntroductionOne accurate measurement is worth more than a thousand expert opinions– Admiral Grace HopperIn the 1700s, a British ship’s captain observed the lack of scurvy among sailors serving on the naval ships of Mediterranean countries, where citrus fruit was part of theirrations. He then gave half his crew limes (the Treatment group) while the other half (theControl group) continued with their regular diet. Despite much grumbling among thecrew in the Treatment group, the experiment was a success, showing that consuminglimes prevented scurvy. While the captain did not realize that scurvy is a consequenceof vitamin C deficiency, and that limes are rich in vitamin C, the intervention worked.British sailors eventually were compelled to consume citrus fruit regularly, a practicethat gave rise to the still-popular label limeys (Rossi et al. 2003; Marks 2000).Some 300 years later, Greg Linden at Amazon created a prototype to showpersonalized recommendations based on items in the shopping cart (Linden 2006a, b).You add an item, recommendations show up; add another item, different recommendations show up. Linden notes that while the prototype looked promising, “a marketingsenior vice-president was dead set against it,” claiming it will distract people fromchecking out. Greg was “forbidden to work on this any further.” Nonetheless, Gregran a controlled experiment, and the “feature won by such a wide margin that nothaving it live was costing Amazon a noticeable chunk of change. With new urgency,shopping cart recommendations launched.” Since then, multiple sites have copied cartrecommendations.The authors of this paper were involved in many experiments at Amazon, Microsoft,Dupont, and NASA. The culture of experimentation at Amazon, where data trumpsintuition (Kohavi et al. 2004), and a system that made running experiments easy,allowed Amazon to innovate quickly and effectively. At Microsoft, there are multiplesystems for running controlled experiments. We describe several architectures in thispaper with their advantages and disadvantages. A unifying theme is that controlledexperiments have great return-on-investment (ROI) and that building the appropriateinfrastructure can accelerate innovation. Stefan Thomke’s book title is well suitedhere: Experimentation Matters (Thomke 2003).123
142R. Kohavi et al.The web provides an unprecedented opportunity to evaluate ideas quickly usingcontrolled experiments, also called randomized experiments (single-factor or factorial designs), A/B tests (and their generalizations), split tests, Control/Treatment, andparallel flights. In the simplest manifestation of such experiments, live users are randomly assigned to one of two variants: (i) the Control, which is commonly the “existing” version, and (ii) the Treatment, which is usually a new version being evaluated.Metrics of interest, ranging from runtime performance to implicit and explicit userbehaviors and survey data, are collected. Statistical tests are then conducted on thecollected data to evaluate whether there is a statistically significant difference betweenthe two variants on metrics of interest, thus permitting us to retain or reject the (null)hypothesis that there is no difference between the versions. In many cases, drillingdown to segments of users using manual (e.g., OLAP) or machine learning and datamining techniques, allows us to understand which subpopulations show significantdifferences, thus helping improve our understanding and progress forward with anidea.Controlled experiments provide a methodology to reliably evaluate ideas. Unlikeother methodologies, such as post-hoc analysis or interrupted time series (quasi experimentation) (Charles and Melvin 2004), this experimental design methodology testsfor causal relationships (Keppel et al. 1992, pp. 5–6). Most organizations have manyideas, but the return-on-investment (ROI) for many may be unclear and the evaluation itself may be expensive. As shown in the next section, even minor changes canmake a big difference, and often in unexpected ways. A live experiment goes a longway in providing guidance as to the value of the idea. Our contributions include thefollowing. In Sect. 3 we review controlled experiments in a web environment and provide arich set of references, including an important review of statistical power and samplesize, which are often missing in primers. We then look at techniques for reducingvariance that we found useful in practice. We also discuss extensions and limitationsso that practitioners can avoid pitfalls. In Sect. 4, we present several alternatives to MultiVariable Tests (MVTs) in anonline setting. In the software world, there are sometimes good reasons to preferconcurrent uni-variate tests over traditional MVTs. In Sect. 5, we present generalized architectures that unify multiple experimentationsystems we have seen, and we discuss their pros and cons. We show that somerandomization and hashing schemes fail conditional independence tests requiredfor statistical validity. In Sect. 6 we provide important practical lessons.When a company builds a system for experimentation, the cost of testing andexperimental failure becomes small, thus encouraging innovation through experimentation. Failing fast and knowing that an idea is not as great as was previously thoughthelps provide necessary course adjustments so that other more successful ideas canbe proposed and implemented.123
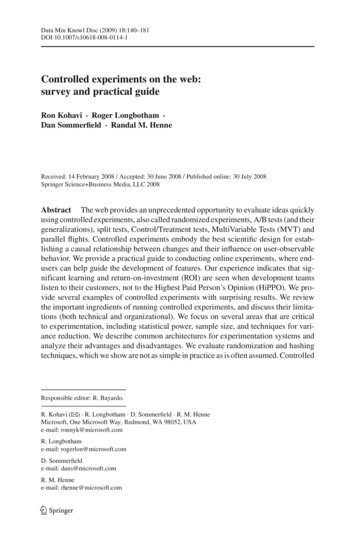
Controlled experiments on the web1432 Motivating examplesThe fewer the facts, the stronger the opinion– Arnold GlasowThe following examples present surprising results in multiple areas. The first twodeal with small UI changes that result in dramatic differences. The third exampleshows how controlled experiments can be used to make a tradeoff between short-termrevenue from ads and the degradation in the user experience. The fourth exampleshows the use of controlled experiments in backend algorithms, in this case search atAmazon.2.1 Checkout page at Doctor FootCareThe conversion rate of an e-commerce site is the percentage of visits to the websitethat include a purchase. The following example comes from Bryan Eisenberg’s articles(Eisenberg 2003a, b).Can you guess which one has a higher conversion rate and whether the differenceis significant?There are nine differences between the two variants of the Doctor FootCare checkout page shown in Fig. 1. If a designer showed you these and asked which one shouldbe deployed, could you tell which one results in a higher conversion rate? Couldyou estimate what the difference is between the conversion rates and whether thatdifference is significant?We encourage you, the reader, to think about this experiment before reading theanswer. Can you estimate which variant is better and by how much? It is very humblingto see how hard it is to correctly predict the answer.Please, challenge yourself!Fig. 1 Variant A on left, Variant B on right123
144R. Kohavi et al.Fig. 2 Microsoft help ratings widget. The original widget is shown above. When users click on Yes/No,the dialogue continues asking for free-text input (two-phase)Variant A in Fig. 1 outperformed variant B by an order of magnitude. In reality, thesite “upgraded” from the A to B and lost 90% of their revenue! Most of the changesin the upgrade were positive, but the coupon code was the critical one: people startedto think twice about whether they were paying too much because there are discountcoupons out there that they do not have. By removing the discount code from the newversion (B), conversion-rate increased 6.5% relative to the old version (A) in Fig. 2.2.2 Ratings of Microsoft Office help articlesUsers of Microsoft Office who request help (or go through the Office Online website athttp://office.microsoft.com) are given an opportunity to rate the articles they read. Theinitial implementation presented users with a Yes/No widget. The team then modifiedthe widget and offered a 5-star ratings.The motivations for the change were the following:1. The 5-star widget provides finer-grained feedback, which might help betterevaluate content writers.2. The 5-star widget improves usability by exposing users to a single feedback boxas opposed to two separate pop-ups (one for Yes/No and another for Why).Can you estimate which widget had a higher response rate, where response is anyinteraction with the widget?The surprise here was that number of ratings plummeted by about 90%, thussignificantly missing on goal #2 above. Based on additional tests, it turned out thatthe two-stage model helps in increasing the response rate. Specifically, a controlledexperiment showed that the widget shown in Fig. 3, which was a two-stage model andalso clarified the 5-stars direction as “Not helpful” to “Very helpful” outperformed theone in Fig. 4 by a factor of 2.2, i.e., the response rate was 2.2 times higher.Even goal #1 was somewhat of a disappointment as most people chose the extremes(one or five stars). When faced with a problem for which you need help, the articleeither helps you solve the problem or it does not!The team finally settled on a yes/no/I-don’t-know option, which had a slightly lowerresponse rate than just yes/no, but the additional information was considered useful.123
Controlled experiments on the web145Fig. 3 A two-stage model widgetFig. 4 New 5-star ratings widget. Single rating widget with 5 stars2.3 MSN home page adsA critical question that many site owners face is how many ads to place. In theshort-term, increasing the real-estate given to ads can increase revenue, but what willit do to the user experience, especially if these are non-targeted ads? The tradeoff between increased revenue and the degradation of the end-user experience is a tough oneto assess, and that’s exactly the question that the MSN home page team at Microsoftfaced in late 2007.The MSN home page is built out of modules. The Shopping module is shown onthe right side of the page above the fold. The proposal was to add three offers rightbelow it, as shown in Fig. 5, which meant that these offers would show up below thefold for most users. The Display Ads marketing team estimated they could generatetens of thousands of dollars per day from these additional offers.The interesting challenge here is how to compare the ad revenue with the “user experience.” In Sect. 3.1, we refer to this problem as the OEC, or the Overall EvaluationCriterion. In this case, we decided to see if page views and clicks decreased, and assign a123
146R. Kohavi et al.Fig. 5 MSN home page proposal. Left: Control, Right: proposed treatmentmonetary value to each. (No statistically significant change was seen in visit frequencyfor this experiment.) Page views of the MSN home page have an assigned value basedon ads; clicks to destinations from the MSN home page were estimated in two ways:1. Monetary value that the destination property assigned to a click from the MSNhome page. These destination properties are other sites in the MSN network. Sucha click generates a visit to an MSN property (e.g., MSN Autos or MSN Money),which results in multiple page views.2. The cost paid to search engines for a click that brings a user to an MSN property butnot via the MSN home page (Search Engine Marketing). If the home page is driving less traffic to the properties, what is the cost of regenerating the “lost” traffic?As expected, the number from #2 (SEM) was higher, as additional value beyond directmonetization is assigned to a click that may represent a new user, but the numberswere close enough to get agreement on the monetization value to use.A controlled experiment was run on 5% of the MSN US home page users for12 days. Clickthrough rate decreased by 0.38% (relative change), and the result wasstatistically significant ( p-value 0.02).Translating the lost clicks to their monetary value, it was higher than the expectedad revenue, so the idea of adding more ads to the MSN home page was scrapped.2.4 Behavior-Based Search at AmazonThe examples above changed User-Interface (UI) elements. This example deals with abackend algorithmic change, which is often overlooked as an area to apply controlledexperiments.123
Controlled experiments on the web147Back in 2004, when several of the authors were in the Data Mining andPersonalization department at Amazon, there already existed a good algorithm formaking recommendations based on two sets. The signature feature for Amazon’s recommendation is “People who bought item X bought item Y,” but this was generalizedto “People who viewed item X bought item Y” and “People who viewed item X vieweditem Y.” A proposal was made to use the same algorithm for “People who searchedfor X bought item Y.” We called it Behavior-Based Search (BBS). In fact, the ideawas to surface this in search results with no visible changes to the user interface. If auser searched for a string that was common, and there was a strong signal that peoplewho searched for that string bought one of several items, these items would surface atthe top of the search results. Note that this algorithm has no semantic understandingof the searched phrase, which was its strength and weakness.Proponents of the algorithm gave examples of underspecified searches, such as“24,” which most humans associated with the TV show starring Kiefer Sutherland.Amazon’s search was returning poor results, shown in Fig. 6, such as CDs with 24Italian Songs, clothing for 24-month old toddlers, a 24-inch towel bar, etc. (Theseresults are still visible on Amazon today if you add an advanced search qualifier like“-foo” to the search phrase since this makes the search phrase unique and no mappings will exist from people who searched for it to products.) The BBS algorithmgave top-notch results with the DVDs of the show and with related books, i.e., thingsthat people purchased after searching for “24” as shown in Fig. 6. The weakness ofthe algorithm was that some items surfaced that did not contain the words in thesearch phrase. For example, if one searches for “Sony HD DVD Player” (this example is recent as of January 2008), Toshiba HD DVDs will show up fairly high. Thereason is that Sony makes Blu-Ray DVD players, not HD players, and that many userswho search for Sony HD DVD players end up purchasing a Toshiba player. Giventhe pros and cons for the idea of Behavior-Based search, Amazon ran a controlledexperiment.Fig. 6 Amazon search for “24” with and without BBS123
148R. Kohavi et al.In a UW iEdge Seminar talk by Amazon in April 2006, it was disclosed that thefeature increased Amazon’s revenue by 3%, which translates into several hundreds ofmillions of dollars.2.5 Other examplesWhile these are extreme examples that are surprising in the magnitude of thedifference, they show how hard it is to predict the success of new designs. Severalmore examples can be found in the emetrics talk on controlled experiments (Kohavi2007).Great examples of experiments are available at Marketing Experiments journal(McGlaughlin 2006), Design Choices Can Cripple a Website (Usborne 2005), Call toAction (Eisenberg and Eisenberg 2005), and Which Sells Best (Eisenberg and Garcia2006). Forrester’s Primer on A/B Testing (Chatham et al. 2004) mentions a few goodexamples of positive ROI: Marriott realized an additional 30 million in bookings with a new onlinereservations form. Luxury accessories retailer Coach improved the effectiveness of its site’s searchengine 200%—by having its vendor prove that a new search engine would producemore effective results with an A/B test. Disk-drive maker Iomega needed to know whether its prospects favored limitedfreeware or trial versions of full software products, and which email landing pageswould produce the best conversion rate. Their solution? To structure an experimental design to test the various permutations—that ultimately drove up campaign yieldby 50%.Spool (2004) quantifies the cost of frustration at Amtrak.com’s web site, by notingthat it is very difficult to register and that only one out of every four attempts succeeds.Obviously making the site more usable will not increase registrations by a factor ofthree or four, but if registrations increased by 20%, he shows that revenues wouldincrease by over 15M/year, enough to get someone’s attention.A/B test at InterContinental Hotels led the firm to add the range of available ratesto search results, which added 45M– 60M of increased bookings (Manning et al.2006).In shop.com’s The State of Retailing (Forrester Research 2005), the authors wrotethat in their survey of 137 US retailers “100% of the retailers that employed usabilitytesting and A/B testing of offers and promotions rank these tactics as effective or veryeffective.”Forrester’s Web Analytics Spending Trends 2007 (Burns 2006) wrote that A/Btesting will see the highest percentage of large increases [of web analytics categories]. A/B testing was one of only two categories [the other is SEO/SEM] in theirsurvey that saw an increase in the percentage of respondents planning major budgetgrowth.123
Controlled experiments on the web1493 Controlled experimentsEnlightened trial and error outperforms the planning of flawless execution– David Kelly, founder of IdeoTo have a great idea, have a lot of them– Thomas A. EdisonIn the simplest controlled experiment, often referred to as an A/B test, users arerandomly exposed to one of two variants: Control (A), or Treatment (B) as shown inFig. 7 (Mason et al. 1989; Box et al. 2005; Keppel et al. 1992).The key here is “random.” Users cannot be distributed “any old which way” (Weiss1997); no factor can influence the decision. Based on observations collected, an OverallEvaluation Criterion (OEC) is derived for each variant (Roy 2001).For example, in Checkout Example (Sect. 2.1), the OEC can be the conversion rate,units purchased, revenue, profit, expected lifetime value, or some weighted combination of these. Analysis is then done to determine if the difference in the OEC for thevariants is statistically significant.If the experiment was designed and executed properly, the only thing consistentlydifferent between the two variants is the change between the Control and Treatment,so any differences in the OEC are inevitably the result of this assignment, establishingcausality (Weiss 1997, p. 215).There are several primers on running controlled experiments on the web (Peterson2004, pp. 76–78; Eisenberg and Eisenberg 2005, pp. 283–286; Chatham et al. 2004;Eisenberg 2005, 2004; Quarto-vonTivadar 2006; Miller 2007, 2006; Kaushik 2006;Peterson 2005, pp. 248–253; Tyler and Ledford 2006, pp. 213–219; Sterne 2002,pp. ng SystemTreatment:Existing Systemwith Feature XUsers interactions instrumented,analyzed & comparedAnalyze at the end of theexperimentFig. 7 High-level flow for an A/B test123
150R. Kohavi et al.While the concept is easy to understand and basic ideas echo through many references, there are important lessons that we share here that are rarely discussed. Thesewill help experimenters understand the applicability, limitations, and how to avoidmistakes that invalidate the results.3.1 TerminologyThe terminology for controlled experiments varies widely in the literature. Below wedefine key terms used in this paper and note alternative terms that are commonly used.Overall Evaluation Criterion (OEC) (Roy 2001). A quantitative measure of theexperiment’s objective. In statistics this is often called the Response or Dependent Variable (Mason et al. 1989; Box et al. 2005); other synonyms include Outcome, Evaluationmetric, Performance metric, or Fitness Function (Quarto-vonTivadar 2006). Experiments may have multiple objectives and a scorecard approach might be taken (Kaplanand Norton 1996), although selecting a single metric, possibly as a weighted combination of such objectives is highly desired and recommended (Roy 2001, p. 50). Asingle metric forces tradeoffs to be made once for multiple experiments and aligns theorganization behind a clear objective. A good OEC should not be short-term focused(e.g., clicks); to the contrary, it should include factors that predict long-term goals,such as predicted lifetime value and repeat visits. Ulwick describes some ways tomeasure what customers want (although not specifically for the web) (Ulwick 2005).Factor. A controllable experimental variable that is thought to influence the OEC.Factors are assigned Values, sometimes called Levels or Versions. Factors are sometimes called Variables. In simple A/B tests, there is a single factor with two values: Aand B.Variant. A user experience being tested by assigning levels to the factors; it is eitherthe Control or one of the Treatments. Sometimes referred to as Treatment, although weprefer to specifically differentiate between the Control, which is a special variant thatdesignates the existing version being compared against and the new Treatments beingtried. In case of a bug, for example, the experiment is aborted and all users should seethe Control variant.Experimental unit. The entity over which metrics are calculated before averagingover the entire experiment for each variant. Sometimes called an item. The units areassumed to be independent. On the web, the user is a common experimental unit,although some metrics may have user-day, user-session or page views as the experimental units. For any of these randomization by user is preferred. It is important thatthe user receive a consistent experience throughout the experiment, and this is commonly achieved through randomization based on user IDs stored in cookies. We willassume that randomization is by user with some suggestions when randomization byuser is not appropriate in Appendix.Null hypothesis. The hypothesis, often referred to as H0 , that the OECs for thevariants are not different and that any observed differences during the experiment aredue to random fluctuations.Confidence level. The probability of failing to reject (i.e., retaining) the null hypothesis when it is true.123
Controlled experiments on the web151Power. The probability of correctly rejecting the null hypothesis, H0 , when it isfalse. Power measures our ability to detect a difference when it indeed exists.A/A test. Sometimes called a Null Test (Peterson 2004). Instead of an A/B test, youexercise the experimentation system, assigning users to one of two groups, but exposethem to exactly the same experience. An A/A test can be used to (i) collect data andassess its variability for power calculations, and (ii) test the experimentation system(the Null hypothesis should be rejected about 5% of the time when a 95% confidencelevel is used).Standard deviation (Std-Dev). A measure of variability, typically denoted by σ .Standard error (Std-Err). For a statistic, it is the standard deviation of the samplingdistribution of the sample statistic (Mason et al. 1989). For a mean of n independentobservations, it is σ̂ / n where σ̂ is the estimated standard deviation.3.2 Hypothesis testing and sample sizeTo evaluate whether one of the treatments is different than the Control, a statisticaltest can be done. We accept a Treatment as being statistically significantly different ifthe test rejects the null hypothesis, which is that the OECs are not different.We will not review the details of the statistical tests, as they are described very wellin many statistical books (Mason et al. 1989; Box et al. 2005; Keppel et al. 1992).What is important is to review the factors that impact the test:1. Confidence level. Commonly set to 95%, this level implies that 5% of the timewe will incorrectly conclude that there is a difference when there is none (Type Ierror). All else being equal, increasing this level reduces our power (below).2. Power. Commonly desired to be around 80–95%, although not directly controlled.If the Null Hypothesis is false, i.e., there is a difference in the OECs, the poweris the probability of determining that the difference is statistically significant. (AType II error is one where we retain the Null Hypothesis when it is false.)3. Standard error. The smaller the Std-Err, the more powerful the test. There arethree useful ways to reduce the Std-Err:a. The estimated OEC is typically a mean of large samples. As shown in Sect. 3.1,the Std-Err of a mean is inversely proportional to the square root of the samplesize, so increasing the sample size, which usually implies running the experiment longer, reduces the Std-Err and hence increases the power for mostmetrics. See the example in 3.2.1.b. Use OEC components that have inherently lower variability, i.e., the StdDev, σ , is smaller. For example, conversion probability (0–100%) typicallyhas lower Std-Dev than number of purchase units (typically small integers),which in turn has a lower Std-Dev than revenue (real-valued). See the examplein 3.2.1.c. Lower the variability of the OEC by filtering out users who were not exposedto the variants, yet were still included in the OEC. For example, if you makea change to the checkout page, analyze only users who got to the page, aseveryone else adds noise, increasing the variability. See the example in 3.2.3.123
152R. Kohavi et al.4. Effect. The difference in OECs for the variants, i.e. the mean of the Treatmentminus the mean of the Control. Larger differences are easier to detect, so greatideas will unlikely be missed. Conversely, Type II errors are more likely when theeffects are small.Two formulas are useful to share in this context. The first is the t-test, used in A/Btests (single factor hypothesis tests):t OB OAσ d(1)where O A and O B are the estimated OEC values (e.g., averages), σ d is the estimatedstandard deviation of the difference between the two OECs, and t is the test result.Based on the confidence level, a threshold t is established (e.g., 1.96 for large samplesand 95% confidence) and if the absolute value of t is larger than the threshold, thenwe reject the Null Hypothesis, claiming the Treatment’s OEC is therefore statisticallysignificantly different than the Control’s OEC. We assume throughout that the samplesizes are large enough that it is safe to assume the means have a Normal distributionby the Central Limit Theorem (Box et al. 2005, p. 29; Boos and Hughes-Oliver 2000)even though the population distributions may be quite skewed.A second formula is a calculation for the minimum sample size, assuming thedesired confidence level is 95% and the desired power is 80% (van Belle 2002, p. 31)n 16σ 2 2(2)where n is the number of users in each variant and the variants are assumed to beof equal size, σ 2 is the variance of the OEC, and is the sensitivity, or the amountof change you want to detect. (It is well known that one could improve the power ofcomparisons of the treatments to the control by making the sample size of the controllarger than for the treatments when there is more than one treatment and you are onlyinterested in the comparison of each treatment to the control. If, however, a primaryobjective is to compare the treatments to each other then all groups should be of thesame size as given by Formula 2.) The coefficient of 16 in the formula provides 80%power, i.e., it has an 80% probability of rejecting the null hypothesis that the
In many cases, drilling down to segments of users using manual (e.g., OLAP) or machine learning and data mining techniques, allows us to understand which subpopulations show significant differences, thus helping improve our understanding and progress forward with an idea. Controlled experiments provide a methodology to reliably evaluate ideas.