Transcription
Special Education: Nonpublic School andNonpublic Agency StudyFinal ReportThomas Parrish, Project DirectorGina ChenHeather ShawSeptember 30, 1998Submitted to:Office of the Legislative Analyst925 L Street, Suite 1000Sacramento, CA 95814California Department of EducationSpecial Education Division515 L Street, Suite 270Sacramento, CA 95814California Department of Finance915 L Street, 7th FloorSacramento, CA 95814
Table of ContentsAcknowledgments . . . . . . . . . . . . . . . . . . . . . . . . . . . . . . . . . . . . . . . . . . . . . . . . . . . . . . . . . . . . . . . . . . . ivAbstract . . . . . . . . . . . . . . . . . . . . . . . . . . . . . . . . . . . . . . . . . . . . . . . . . . . . . . . . . . . . . . . . . . . . . . . . . . . vChapter 1. Introduction . . . . . . . . . . . . . . . . . . . . . . . . . . . . . . . . . . . . . . . . . . . . . . . . . . . . . . . . . . . . . 1Purpose of the study . . . . . . . . . . . . . . . . . . . . . . . . . . . . . . . . . . . . . . . . . . . . . . . . . . . . . . . . . . . 1Approach . . . . . . . . . . . . . . . . . . . . . . . . . . . . . . . . . . . . . . . . . . . . . . . . . . . . . . . . . . . . . . . . . . . . 2Overview of NPSs and NPAs . . . . . . . . . . . . . . . . . . . . . . . . . . . . . . . . . . . . . . . . . . . . . . . . . . . . 2Special education placement patterns in California and across the nation . . . . . . . . . . . 3A profile of NPS and NPS/LCI students in California . . . . . . . . . . . . . . . . . . . . . . . . . . 5State and federal laws and regulations pertaining to NPS funding . . . . . . . . . . . . . . . . . . . . . . . 8NPS placement provisions under the Master Plan . . . . . . . . . . . . . . . . . . . . . . . . . . . . . 8NPS placement provisions under Chapter 854 of AB 602 . . . . . . . . . . . . . . . . . . . . . . . 9NPS placement provisions under the “old” federal law . . . . . . . . . . . . . . . . . . . . . . . . 10NPS placement provisions in the reauthorized federal law . . . . . . . . . . . . . . . . . . . . . . 10Summary of findings and recommendations . . . . . . . . . . . . . . . . . . . . . . . . . . . . . . . . . . . . . . . 11Overview of remainder of report . . . . . . . . . . . . . . . . . . . . . . . . . . . . . . . . . . . . . . . . . . . . . . . . 21Chapter 2. How do local NPS and NPA placement processes work? What factorsaffect the decisions to use NPSs and NPAs? . . . . . . . . . . . . . . . . . . . . . . . . . . . . . . . . . . . . . .Introduction . . . . . . . . . . . . . . . . . . . . . . . . . . . . . . . . . . . . . . . . . . . . . . . . . . . . . . . . . . . . . . . . .Nonpublic Schools . . . . . . . . . . . . . . . . . . . . . . . . . . . . . . . . . . . . . . . . . . . . . . . . . . . . . . . . . . .Overview of Nonpublic Schools (NPSs) and Licensed Children’s Institutions (LCIs)NPS use in California compared with other states . . . . . . . . . . . . . . . . . . . . . . . . . . . .Demographic description of NPS students . . . . . . . . . . . . . . . . . . . . . . . . . . . . . . . . . .Varying district practices in referring, identifying, and placing pupils in NPSs . . . . . .Interview findings regarding the NPS placement process . . . . . . . . . . . . . . . . . . . . . . .Perceived strengths and weaknesses of NPS . . . . . . . . . . . . . . . . . . . . . . . . . . . . . . . . .Lawfulness and appropriateness of NPSs placements . . . . . . . . . . . . . . . . . . . . . . . . . .Analysis of increasing costs . . . . . . . . . . . . . . . . . . . . . . . . . . . . . . . . . . . . . . . . . . . . . .Programs to avoid placement or limit the time spent in NPSs . . . . . . . . . . . . . . . . . . .How do other states pay for NPS and contain NPS costs? . . . . . . . . . . . . . . . . . . . . . .Expected use of NPSs given AB 602 . . . . . . . . . . . . . . . . . . . . . . . . . . . . . . . . . . . . . . .Nonpublic Agencies . . . . . . . . . . . . . . . . . . . . . . . . . . . . . . . . . . . . . . . . . . . . . . . . . . . . . . . . . .Overview of Nonpublic Agencies (NPAs) . . . . . . . . . . . . . . . . . . . . . . . . . . . . . . . . . .Referring and identifying pupils that need NPA services . . . . . . . . . . . . . . . . . . . . . . .Analysis of increasing costs . . . . . . . . . . . . . . . . . . . . . . . . . . . . . . . . . . . . . . . . . . . . . .Expected use of NPAs given AB 602 . . . . . . . . . . . . . . . . . . . . . . . . . . . . . . . . . . . . . .22222323242527303234363841414242434445
Summary . . . . . . . . . . . . . . . . . . . . . . . . . . . . . . . . . . . . . . . . . . . . . . . . . . . . . . . . . . . . . . . . . . . 45Policy recommendations . . . . . . . . . . . . . . . . . . . . . . . . . . . . . . . . . . . . . . . . . . . . . . . . . . . . . . . 46Chapter 3. What are the impacts between mediation and due process hearings andthe use of NPSs and NPAs ? . . . . . . . . . . . . . . . . . . . . . . . . . . . . . . . . . . . . . . . . . . . . . . . . . .California’s due process system for resolving special education disputes . . . . . . . . . . . . . . . . .History of mediation and hearing outcomes . . . . . . . . . . . . . . . . . . . . . . . . . . . . . . . . . . . . . . . .Perceived strengths and weaknesses of the due process system . . . . . . . . . . . . . . . . . . . . . . . . .SELPA interviews . . . . . . . . . . . . . . . . . . . . . . . . . . . . . . . . . . . . . . . . . . . . . . . . . . . . .NPS interviews . . . . . . . . . . . . . . . . . . . . . . . . . . . . . . . . . . . . . . . . . . . . . . . . . . . . . . .NPA interviews . . . . . . . . . . . . . . . . . . . . . . . . . . . . . . . . . . . . . . . . . . . . . . . . . . . . . . .State policy interviews . . . . . . . . . . . . . . . . . . . . . . . . . . . . . . . . . . . . . . . . . . . . . . . . . .Changes to the due process system in California: Practices that lessen the need togo to hearing . . . . . . . . . . . . . . . . . . . . . . . . . . . . . . . . . . . . . . . . . . . . . . . . . . . . . . . . . . . . . . .What are other states doing in this area? . . . . . . . . . . . . . . . . . . . . . . . . . . . . . . . . . . . . . . . . . .Summary . . . . . . . . . . . . . . . . . . . . . . . . . . . . . . . . . . . . . . . . . . . . . . . . . . . . . . . . . . . . . . . . . .Policy recommendations . . . . . . . . . . . . . . . . . . . . . . . . . . . . . . . . . . . . . . . . . . . . . . . . . . . . . .505053595960606162636364Chapter 4. How do the costs of public placements compare with NPS and NPA? . . . . . . . . . . . . .Interview findings . . . . . . . . . . . . . . . . . . . . . . . . . . . . . . . . . . . . . . . . . . . . . . . . . . . . . . . . . . . .Analysis of extant cost data . . . . . . . . . . . . . . . . . . . . . . . . . . . . . . . . . . . . . . . . . . . . . . . . . . . .Wide range of resource variations across NPSs . . . . . . . . . . . . . . . . . . . . . . . . . . . . . . . . . . . .Conclusion . . . . . . . . . . . . . . . . . . . . . . . . . . . . . . . . . . . . . . . . . . . . . . . . . . . . . . . . . . . . . . . . .Policy recommendations . . . . . . . . . . . . . . . . . . . . . . . . . . . . . . . . . . . . . . . . . . . . . . . . . . . . . . .666668747778Chapter 5. How should the state pay for NPS/LCI Placements? . . . . . . . . . . . . . . . . . . . . . . . . . . .What is the problem with the current law? . . . . . . . . . . . . . . . . . . . . . . . . . . . . . . . . . . . . . . . . .Why is this important? . . . . . . . . . . . . . . . . . . . . . . . . . . . . . . . . . . . . . . . . . . . . . . . . . . . . . . . .How might the state’s funding laws for LCI students be changed? . . . . . . . . . . . . . . . . . . . . . .What should happen next? . . . . . . . . . . . . . . . . . . . . . . . . . . . . . . . . . . . . . . . . . . . . . . . . . . . . .7979818285References . . . . . . . . . . . . . . . . . . . . . . . . . . . . . . . . . . . . . . . . . . . . . . . . . . . . . . . . . . . . . . . . . . . . . . . . 88Appendix A. Data and MethodsAppendix B. Data SourcesAppendix C. Number of Children Ages 6-21 Served in Different Educational Environments
List of tablesTable 1-1. Percent of Special Education Students in California and theNation by Placement and Disability . . . . . . . . . . . . . . . . . . . . . . . . . . . . . . . . . . . . . . . . . . . . . . 4Table 1-2. Percent Composition of Students in Special Education, NPS, andNPS/LCI by Disability . . . . . . . . . . . . . . . . . . . . . . . . . . . . . . . . . . . . . . . . . . . . . . . . . . . . . . . . . 6Table 1-3. Percent Composition of Students in Special Education, NPS, andNPS/LCI by Gender, Racial Category, and Age . . . . . . . . . . . . . . . . . . . . . . . . . . . . . . . . . . . . . 8Table 2-1. Number of Children Ages 6-21 Served in Different EducationalEnvironments Under IDEA, Part B and Chapter 1 of ESEA (SOP) During the1993-94 School Year . . . . . . . . . . . . . . . . . . . . . . . . . . . . . . . . . . . . . . . . . . . . . . . . . . . . . . . . . 24Table 2-2. Race/Ethnicity and Gender of Students in California Public Schools,in Public Special Education Programs, NPSs, and NPS/LCIs . . . . . . . . . . . . . . . . . . . . . . . . . . 25Table 2-3. Race/Ethnicity of Students in California Youth Authority, NPSs,and NPS/LCIs . . . . . . . . . . . . . . . . . . . . . . . . . . . . . . . . . . . . . . . . . . . . . . . . . . . . . . . . . . . . . . . 27Table 2-4. Responsibility for Funding NPS Services Authorized in an IEP . . . . . . . . . . . . . . . . . . . . . . 29Table 2-5. Actual and Adjusted NPS Expenditures from 1983-4 through 1997-98 . . . . . . . . . . . . . . . . 36Table 2-6. Nonpublic School Statewide Enrollment on April 1, 1988-1997 . . . . . . . . . . . . . . . . . . . . . 37Table 3-1. Background and Training of McGeorge Mediators and Hearing Officers . . . . . . . . . . . . . . 52Table 3-2. Mediation Outcomes by Fiscal Year . . . . . . . . . . . . . . . . . . . . . . . . . . . . . . . . . . . . . . . . . . . 54Table 3-3. Party Who Requested Hearing by Fiscal Year . . . . . . . . . . . . . . . . . . . . . . . . . . . . . . . . . . . . 55Table 3-4. Issues in Final Hearing Decisions by Fiscal Year . . . . . . . . . . . . . . . . . . . . . . . . . . . . . . . . . 56Table 4-1. NPS Costs and Public School SDC Costs Per Student . . . . . . . . . . . . . . . . . . . . . . . . . . . . . 68Table 4-2. Behavioral Characteristics of Students Enrolled in NPS . . . . . . . . . . . . . . . . . . . . . . . . . . . . 69Table 4-3. Related Services at NPS . . . . . . . . . . . . . . . . . . . . . . . . . . . . . . . . . . . . . . . . . . . . . . . . . . . . . 70Table 4-4. Related Services for SED Students Served in SDCs in Public Schools . . . . . . . . . . . . . . . . 72Table 4-5. Behavioral Characteristics of NPS Students and Quantities of InstructionalResources According to Quartiles of Severity . . . . . . . . . . . . . . . . . . . . . . . . . . . . . . . . . . . . . . 73Table 4-6. NPS Revenues and Anticipated Expenditures per FTE Student . . . . . . . . . . . . . . . . . . . . . . 74Table 4-7. NPS Staffing Ratios and Length of School Year . . . . . . . . . . . . . . . . . . . . . . . . . . . . . . . . . . 75Table 4-8. Student to Professional Staff Ratios by Level of Care . . . . . . . . . . . . . . . . . . . . . . . . . . . . . . 76Table 4-9. Percentage of Licensed Staff Across Sample NPS Sites . . . . . . . . . . . . . . . . . . . . . . . . . . . . 77List of figuresFigure 1-1. Percent Composition of Students in Special Education, NPS, and NPS/LCIby Categories of Selected Disability . . . . . . . . . . . . . . . . . . . . . . . . . . . . . . . . . . . . . . . . . . . . . . . 7Figure 3-1. Number of Hearing Requests and Hearing Decisions by Fiscal Year . . . . . . . . . . . . . . . . . 55Figure 3-2. Percentage of Hearing Decisions Won by Parents and LEA, andPercentage of Split Decisions . . . . . . . . . . . . . . . . . . . . . . . . . . . . . . . . . . . . . . . . . . . . . . . . . . . 57Figure 3-3. Number of Hearing Decisions and Number of Appeals Filed byFiscal Year . . . . . . . . . . . . . . . . . . . . . . . . . . . . . . . . . . . . . . . . . . . . . . . . . . . . . . . . . . . . . . . . . 58iii
AcknowledgmentsAcknowledgmentsThe AIR research team would like to thank the following professionals who generouslycontributed their time and effort to the Nonpublic School and Agency Study and thepreparation of this final report: Project Monitor, Stuart Marshall of the Legislative Analysts Office, Mary Hudlerof the California Department of Education, and Jeff Bell of the CaliforniaDepartment of Finance. Advisory Committee members Carol Bingham, Jeanne Davis, Mike Grimes, OttoLengel, Bennett Ross, and John Sayler. The Advisory Committee providedguidance and feedback throughout the study to the research team. The committeewas comprised of two SELPA directors, the president of California Association ofPrivate Specialized Education and Services (CAPSES), one County Office ofEducation Program Administrator (who was involved in implementing a pilotprogram designed as an alternative to NPS), and a representative from theDepartment of Education. Five meetings were held with the committeethroughout the study. The Advisory Committee members were especially helpfulin advising the research team. Interview respondents who took the time to participate in our site visits andtelephone surveys, including representatives of:California SELPA directorsCalifornia NPS and NPA directorsState directors of special educationCalifornia state policy representativesCalifornia Special Education Hearing Office at the McGeorge School ofLaw Support staff at the American Institutes for Research who were instrumental to thecompletion of this study and the production of the final report: Anna Williams,Lori Hodge, Irene Lam, Bob Morris, Molly Kiely, and Dan Kaleba.American Institutes for Researchiv
AbstractAbstractThis legislatively mandated study is an outgrowth of California’s new special educationfinance law, Assembly Bill 602 (1997). AB 602 changed the basis of special educationfunding from a unit system based on the number of special education students served to acensus system based on the total number of students enrolled in a school district. Thisnew funding system substantially reduces fiscal incentives to place special educationstudents in nonpublic schools (NPSs). However, because the state will continue toreimburse 100% of the educational costs for licensed children’s institution (LCI) studentsin NPSs, the fiscal incentive to place LCI children in a NPS is not removed under AB602. In fact, because the new law provides no additional state aid for a public schoolplacement of these children, the fiscal incentive to place LCI students in an NPS isenhanced under AB 602. These policies may not be in the best interests of children inLCIs and may violate federal requirements that special education students be placed in theleast restrictive environment (LRE) appropriate to their needs.The main purpose of this study is to consider whether the state should alter the fundingprovisions for NPS/LCI students under AB 602, and if so how this should be done. Thestudy also addresses how the costs of public school placements compare with NPS andnonpublic agency (NPA) placements, why some districts rely on NPS and NPAplacements more than others, and the effect of mediation and due process hearings on theuse of NPS/NPAs. These questions are addressed through the analysis of state-level data,information submitted to the state by NPSs and NPAs, interviews with SELPA directors,visits to public and nonpublic sites, interviews with representatives of state-levelagencies, interviews with directors of state special education departments from otherstates, and a series of meetings and consultations with the advisory committee for thisproject. This advisory committee was comprised of representatives from public schools,NPSs, and state agencies. This study was monitored by the State Legislative Analyst’sOffice in cooperation with the Department of Education and the Department of Finance.American Institutes for Researchv
Chapter 1. IntroductionChapter 1IntroductionThe passage of the Poochigan and Davis Special Education Reform Act (Assembly Bill(AB) 602, Chapter 854, Statutes of 1997) is “perhaps the most revolutionary legislativeaction in the history of California special education” (Kennedy, Fall 1997, p. 20). WhenAB 602 goes into effect in the 1998 fiscal year, the basis for special education fundingwill be the total number of students enrolled in a special education local plan area(SELPA) rather than the number of special education students being served. Thispopulation based funding system is intended to ensure greater funding equity amongSELPAs and to eliminate financial incentives to inappropriately place students in specialeducation programs.Although AB 602 removes most major fiscal incentives for SELPAS to use NPSs andNPAs, there continues to be an incentive to provide special education programs forstudents residing in licensed children’s institutions (LCIs) at nonpublic schools (NPSs).The instructional programs for these students will continue to be reimbursed 100% by thestate. To address this and other issues, AB 602 mandated this study of NPSs andnonpublic agencies (NPAs). Because AB 602 removes most incentives to use NPAs,more emphasis is given to issues related to NPSs, with special attention paid to issuespertaining to NPS/LCI students.Purpose of the studyThis study investigates four questions:1.2.3.4.How do local NPS and NPA placements work?--What factors affect thedecisions to use NPSs and NPAs?What impact do mediation and due process have on the use of NPSs andNPAs?How do the costs of public school placements compare to placements inNPSs and NPAs?How should the state pay for NPS placements for LCI students?American Institutes for Research1
Chapter 1. IntroductionApproachThese questions are addressed through interviews with directors of California SELPAs,NPSs, and NPAs, as well as people knowledgeable of state policy. To understand howother states are dealing with this issue, we also interviewed a sample of state directors ofspecial education. Site visits to NPSs, LCIs, and other organizations (e.g., the SpecialEducation Hearing Office) were also conducted. The California Special EducationManagement Information System (CASEMIS) file, the California Basic Educational DataSystems (CBEDS) file, J-50 school district financial reports, NPS certificationapplications, and data from a prior NPS study (Parrish, 1987) were used for the costanalysis called for in question 3. Appendix A describes the data, sampling procedures,and other methodological issues in more detail.An advisory committee was also formed to provide guidance and feedback throughout thestudy. The committee was comprised of two SELPA directors, the president of CaliforniaAssociation of Private Specialized Education and Services (CAPSES), one County Officeof Education program administrator (who was involved in implementing a pilot programdesigned as an alternative to NPS), and a representative from the Department ofEducation. Five meetings were held with the committee throughout the study.Overview of NPSs and NPAsAccording to the California Education Code 56034, a “‘nonpublic, nonsectarian school’means a private, nonsectarian school that enrolls individuals with exceptional needspursuant to an individualized education program, employs at least one full-time teacherwho holds an appropriate credential authorizing special education services, and iscertified by the department.” NPSs offer classes that cater to the needs of specialeducation students. The classes range from academic subjects that meet graduationrequirements to life skills classes.As stated by the California Education Code 56035, a “‘nonpublic, nonsectarian agency’is defined as a private, nonsectarian establishment or individual that provides relatedservices necessary for an individual with exceptional needs to benefit educationally fromthe pupils’ educational program pursuant to an individualized education program and thatis certified by the department.” NPAs can consist of one or multiple service providersthat are contracted by districts and NPSs. NPAs are generally associated with differenttypes of therapies. In the past, school districts may have been more likely to use NPAsrather than their own employees because under prior law the state paid 70 percent of thesecosts. Upon implementation of AB 602, however, districts may be more likely to hiretheir own therapists to work with special education students.American Institutes for Research2
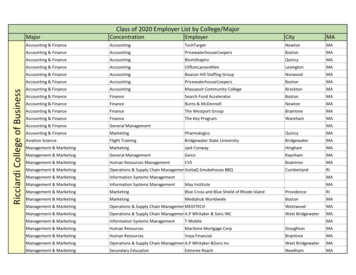
Chapter 1. IntroductionLCIs are of relevance to this analysis of NPS and NPA costs and funding formulasbecause of special provisions that only apply to the children residing in them. BecauseLCI children are generally placed in particular areas by noneducational agencies, the statepays 100 percent of the instructional costs for these students when they require NPSand/or NPA services. Because LCI students may disproportionately be located in someschool district enrollment areas, it seems fair that the state should absorb 100 percent ofany extraordinary costs associated with their schooling.The problem with these provisions, however, and a major focus of this study is that theyalso create a strong fiscal incentive for districts to place LCI children in NPSs and NPAs.The concern is that these services may be more intensive than may be required. Anadditional concern is that NPS programs tend to isolate these children from their nondisabled peers. Unless such restrictive placements are fully appropriate to meet thespecial needs of these children, they are in violation of federal law under the Individualswith Disabilities Education Act (IDEA).Special education placement patterns in California and across the nationTable 1-1 shows cost estimates per student and percentages of students bycategory of disability for California and the nation as a whole. The cost estimatesare derived from a California Study on Special Education Incidence (1998) andfrom the last national special education expenditure study (1988). These nationalestimates are reported in current dollars.In terms of assignment to alternative categories of disability, it is interesting tonote that California assigns a considerably smaller percentage of its specialeducation students to the categories mental retardation (MR) (6 % versus 11 %)and serious emotional disturbance (SED) (3 % versus 9 %). Also, givenCalifornia’s considerable influence on these national averages, withapproximately 12 % of the nation’s school children residing in the state, themagnitude of the differences in MR and SED identification rates in California isunderstated by these figures.This table also shows percentage distributions by category of disability for fourmajor alternative placement settings. The placement settings are divided into thecategories, self-contained class or special day class (SDC), resource teacher orresource specialist program (RSP), related or designated instructional service(DIS), and private special education or nonpublic school (NPS).American Institutes for Research3
Chapter 1. IntroductionTable 1-1. Percent of Special Education Students in California and the Nationby Placement and DisabilityCALIFORNIAAvg Cost/StudentPercent ofTotalPercent Breakout by Placement% RSP% DIS% NPS% SDCMR 8,3126%18%1%0%6%HH 9,7401%2%0%1%1%DEAF 15,1021%2%0%0%1%SLI 1,99126%8%6%88%2%VI 14,3811%2%0%1%0%SED 14,9893%5%1%0%62%OI 12,7822%5%1%1%1%OHI 5,6772%2%2%3%3%SLD 4,15256%50%89%5%18%DB 24,2500%0%0%0%0%MH 15,8211%3%0%0%2%AUT 13,5711%3%0%0%5%TBI 11,1930%0%0%0%0%Total 4,811100%100%100%100%100%NATIONALAvg Cost/Percent ofPercent Breakout by PlacementMR 7,41011%28%10%2%21%HH 8,9171%2%1%1%6%0%0%0%0%SLI 1,97322%6%7%44%7%VI 7,9931%0%0%1%2%SED 7,0299%13%7%4%32%OI 8,3451%2%1%1%2%OHI 8,8861%1%1%1%3%SLD 3,44351%44%71%45%10%DB 35,0080%0%0%0%0%MH 12,0872%4%1%0%13%AUT 13,2830%1%0%0%2%0%0%0%0% 4,379100%100%100%100%100%DEAFTBITotalAmerican Institutes for Research4
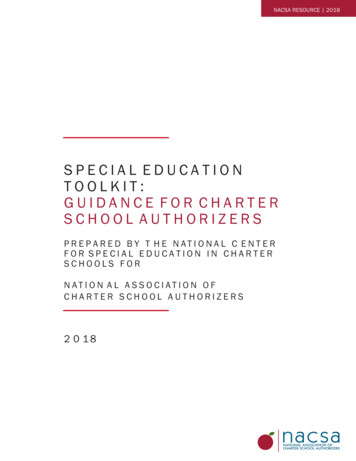
Chapter 1. IntroductionOf particular interest to this study of NPSs is the fact that 62 % of the NPSpopulation in California are SED students. While they are also the largestpopulation in private special education schools across the nation, at 32 % theirrepresentation is still considerably smaller than in California. This much largerpercentage of SED students in NPSs in California is despite the fact that theoverall percentage of SED students across the nation is three times greater than forCalifornia (9 % versus 3 %). Thus, the population of students served in NPSs inCalifornia is considerably different than for the nation as a whole, and even morepronounced than is shown in Table 1-1 given California’s influence on thenational averages included in this table.These differing assignment patterns by disability are also reflected in the costestimates shown in Table 1-1. At nearly 15,000 per student SED students inCalifornia are estimated to cost more than twice the average across the nation.As California appears to be more selective regarding who is assigned to thedisability category SED than is true across the nation, it is not surprising that thesestudents have more intensive needs and are therefore more costly to serve. It isinteresting to note, however, that 37 percent of all SED students in California arebeing served in nonpublic schools.A profile of NPS and NPS/LCI students in CaliforniaTable 1-2 provides descriptive information regarding California students inspecial education, in NPSs, and NPS/LCIs. In the first row, the total number ofstudents in each of these types of placements is shown. Approximately 1.9 % ofall special education children are placed in NPSs and slightly more than one-halfof these reside in an LCI.Table 1-2 further categorizes these special education students by disability. It isinteresting to note the very different percent representation by disability as foundin these three types of settings. Most striking is the disability category ofSeriously Emotionally Disturbed (SED). While SED students comprise only 3percent of the state’s special education population, nearly 62 percent of thestudents placed in NPSs are SED. The disability categories Mentally Retarded(MR), Speech and Language Impaired (SLI), Seriously Emotionally Disturbed(SED), Orthopedically Impaired (OI), Specific Learning Disabled (SLD),Multihandicapped (MH), and Autism (AUT) also comprise significant proportionsof NPS enrollments.American Institutes for Research5
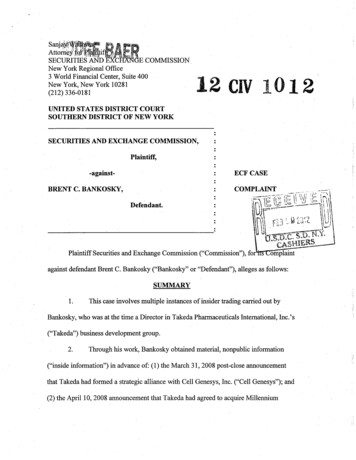
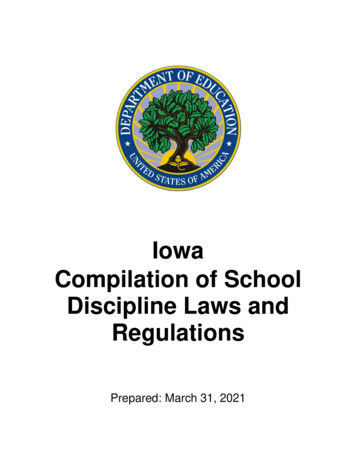
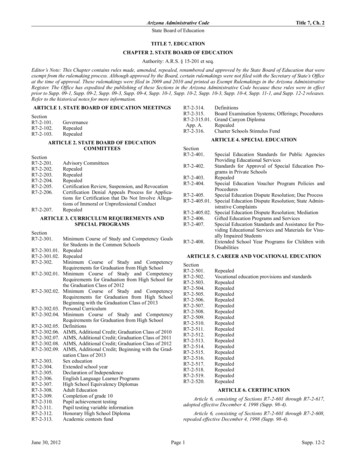
Chapter 1. IntroductionTable 1-2. Percent Composition of Students in Special Education, NPS, andNPS/LCI by DisabilitySpecial EducationNPSNPS/LCI600,97911,2646,665Mentally Retarded5.746.0914.76Hard of Hearing0.990.510.29Deaf0.570.510.36Speech and Language Impaired26.301.642.43Visually Impaired0.670.421.44Seriously Emotionally3.1461.7341.70Orthopedically Impaired2.150.606.75Other Health Impaired2.472.812.10Specific Learning handicapped1.072.285.75Autism1.044.643.08Traumatic Brain Injury0.150.240.24Number of StudentsDisability CategoryNote: Data taken from California Special Education Management Information System (CASEMIS).The differing percentage composition of these categories of students in specialeducation overall, in NPS, and in NPS/LCI are further illustrated in Figure 1-1.Here it is noted that some disability categories are much more highly representedin NPSs than in special education overall. This is true for mental retardation(MR), seriously emotionally disturbed (SED), orthopedically impaired (OI), multihandicapped (MH), and autism (AUT). Conversely, while the categories speechand language impaired (SLI) and severe learning disabilities (SLD) predominatespecial education overall, their percentage representation drops off substantially inNPSs. Despite this drop, however, SLD remains the second largest category ofdisability served in NPSs.American Institutes for Research6
Chapter 1. IntroductionFigure 1-1: Percent Composition of Students in SpecialEducation (SE), NPS, and NPS/LCI by Categories ofSelected LIMR0NPS/LCIDisabilityTable 1-3 shows that about two-thirds of special education, NPS, and NPS/LCIstudents are male. By racial category, it is interesting to note that white studentsare somewhat over represented in NPSs and NPS/LCIs in relation to theirpercentages among all special education students. This point is further pursuedin Chapter 2. The NPS and the NPS/LCI populations are considerably older thanthe overall population of special education students. Over 50 percent ofNPS/LCI students are over 16 years of age as opposed to less than 20 percent ofall special education students.American Institutes for Research7
Chapter 1. IntroductionTable 1-3. Percent Composition of Students in Special Education, NPS, and NPS/LCI byGender, Racial Category, and AgeSpecial -white56.0550.9949.290-12 years50.4320.5517.6012-16 years31.0836.7531.54More than 16 years18.4842.7050.86Number of StudentsGenderRace CategoryAge CategoryNote: Data taken from California Special Education Management Information System (CASEMIS).State and federal laws and regulations pertaining to NPS fundingNPS placement provisions under the Master PlanThe California Master Plan (MP) was first proposed in 1974 as a method ofunifying the diverse funds supporting the variety of special education programs inthe state. The amount of funding districts received was driven by the number ofspecial day classes (SDC), resource programs (RSP) and designated instructionalservices (DIS) provided. Although the funding component of the MP wasreasonable in its design as a cost-based unit funding system, over time it was
California Department of Education Special Education Division 515 L Street, Suite 270 Sacramento, CA 95814 California Department of Finance . Race/Ethnicity and Gender of Students in California Public Schools, in Public Special Education Programs NPSs and NPS/LCIs . 25 Table 2-3. Race/Ethnicity of Students in California Youth Authority, NPSs,