Transcription
Does Class Size Reduce the Gender Gap?A Natural Experiment in Law 43 J. LEGAL STUD. (forthcoming)Daniel E. Ho†Stanford Law SchoolMark G. Kelman Stanford Law SchoolABSTRACTWe study a unique natural experiment in which Stanford Law School randomlyassigned first-year students to small or large sections of mandatory courses from2001-2011. We provide evidence (i) that small sections closed a slight (butsubstantively and highly statistically significant) gender gap existing in largesections from 2001-08; (ii) that reforms in 2008, which modified the gradingsystem and instituted small, graded, writing and simulation-intensive courses,eliminated the gap entirely; and (iii) that women, if anything, outperformed menin small, simulation-based courses. Our evidence suggests that pedagogicalpolicy --- particularly small class sizes --- can reduce, and even reverse,achievement gaps in post-graduate education.Thanks to Kristen Altenburger, Rebecca Morris, and Michael Morse for invaluable research assistance, Ian Ayres, StuartBenjamin, Beth Colgan, Faye Deal, Stephen Galoob, Paul Goldstein, Gillian Hadfield, Amalia Kessler, Jon Klick, Jeff Kobrick,Larry Kramer, Liz Magill, Jenny Martinez, Jeannie Merino, Bernie Meyler, Alison Morantz, Deborah Rhode, Shirin Sinnar,George Triantis, Laura Trice, and participants at the Center for Law and Social Sciences Workshop at the University of SouthernCalifornia School of Law, the Faculty Colloquium at the University of Colorado Boulder School of Law, the faculty workshop atDuke Law School, the Faculty Colloquium at Emory University School of Law, and the Conference on Empirical Legal Studiesat the University of Pennsylvania Law School for helpful comments and conversations, Elizabeth Di Giovanni, Kim Borg, NicoleCagampan, Kyung Chong, Faye Deal, Carol Ida, Anna O’Neill, Susan Robinson, Mila Fernandez-Ronquillo for help in collectinglaw school data, and the many faculty members responding to our inquiries about pedagogy.†Professor of Law, Stanford Law School; Address: 559 Nathan Abbott Way, Stanford, CA 94305; Tel: 650-723-9560; Fax: 650725-0253; Email: dho@law.stanford.edu, URL: http://dho.stanford.edu. James C. Gaither Professor of Law & Vice Dean, Stanford Law School, Address: 559 Nathan Abbott Way, Stanford, CA 94305;Tel: 650-723-4069; Fax: 650-725-0253.
HO & KELMAN, CLASS SIZE11. INTRODUCTIONDemographic achievement and test score gaps pose severe challenges to educationalpolicy. Such gaps have been widely documented, from the black-white test score gap (Jencksand Phillips 1998) to gender gaps in science, collegiate outcomes, and law and business schools(Xie and Shauman 2003; Jacobs 1996; Hancock 1999; Epstein 1993). Less understood iswhether policies and pedagogical choices can reduce achievement gap, and, if so, how.One promising intervention to reduce achievement gaps is to reduce class size. Smallerclasses may, for instance, enable teachers to better understand and teach to students at differentlevels. Jencks and Phillips (1998) conclude that to narrow the gap, “[t]he two policies that . . .combine effectiveness with ease of implementation are cutting class size and screening outteachers with weak academic skills” (p. 44). The best evidence comes from the TennesseeSTAR1 experiment, which randomly assigned students in kindergarten through third grade tolarge and small classrooms. Results suggest that smaller classrooms improved performanceoverall and reduced racial test score gaps (Ferguson 1998; Krueger 1999; Mosteller 1995). Butthese estimates are disputed. Hanushek (1999) argues that high attrition rates (with up to 50% ofstudents leaving the experiment2), noncompliance (with 10% switching from large to smallclassrooms), and nonresponse (with 3 to 12% not taking exams) provide reasons to doubt theclass size effects. Quasi-experimental and observational studies are less certain about the effectof smaller classes on achievement generally and demographic gaps.3A separate literature, focusing on gender gaps, particularly in math and science, examinesthe role of competition and gender of the instructor. Gneezy, Niederle, and Rustichini (2003)show that competition exacerbates gender differences in a maze-solving task. They randomlyassign experimental subjects to compensation based on a “tournament incentive,” where only thehighest performer receives payment, or payment per task. The gender gap increases threefold inthe competitive tournament condition (see also Niederle and Vesterlund 2007; Niederle andVesterlund 2010). Ors, Palomino, and Peyrache (2013) find that men outperform women onentrance exams to a top-ranked French business school, which is reversed in less competitivehigh school finishing exams. Carrell, Page, and West (2010), in a study that is closest to ours inresearch design, study a natural experiment in the U.S. Air Force Academy, where students arerandomly assigned to professors for mandatory courses. Female professors greatly improvewomen’s performance in math and science courses (see also Dee).4The gender gap in legal education has attracted a great deal of academic attention.Scholars argue that “Socratic” and adversarial teaching styles common in large law schoolclasses disadvantage women (e.g., Banks 1988; Guinier et al. 1994; Rhode 1993; Rhode 2001;Weiss and Melling 1988). Voluminous research confirms that women participate less frequentlyin the classroom, although some document relative parity in (or greater comfort by women with)small courses (Yale Law Women 2012; Banks 1988; Weiss and Melling 1988, p. 1334-35).Because grades matter considerably in the legal profession, numerous scholars have examined1STAR stands for “Student-Teacher Achievement Ratio.”See Krueger (1999) (Table 1, documenting attrition rates from 47 to 53% for students entering the experiment in kindergartenor first grade).3See, e.g., Fredriksson, Öckert, and Oosterbeek (2012); Hoxby (2000); Angrist and Lavy (1999); and Fryer and Levitt (2004).4In our data, we do not find that gender of the instructor has an effect on the gender gap, or that the class size effect is explainedby gender of the instructor.2
HO & KELMAN, CLASS SIZE2the gender gap in law school grades, with heterogeneous findings across schools.5 Guinier et al.(1994, p. 96) advocate comprehensive reform to address gender disparities, emphasizing that“small class size may be a necessary condition,” a common refrain in calls for reform. But whilemuch ink has been spilled describing gender differences, few studies --- and none applyingexperimental methods --- systematically assess what pedagogical policies might mitigate thegender gap in law school performance.Our Article marries these literatures, by examining whether smaller classes reduce gendergaps in performance. We study a unique setting in which Stanford Law School randomlyassigned students to small or large sections of mandatory first-year courses from 2001-2011. Wecollect rich individual-level covariate and grade information for every student in everymandatory first-year course to study whether small sections reduce the gender gap in law. Wefind they do.Our study has several virtues. First, unlike observational studies, where class size isoften confounded (e.g., by type of student), we leverage Stanford’s randomization of mandatoryfirst-year courses. To our knowledge, virtually no studies capitalize on random assignment tofocus specifically on the effect of class size on gender gaps in academic achievement.6 Inaddition, because we observe all information that the Office of Admissions takes into accountwhen assigning students to sections, treatment assignment would be unconfounded even ifsection assignments were not randomized (Barnow, Cain, and Goldberger 1980; Ho and Rubin2011; Rubin 2008). Second, because large sections are composites of small sections, we observehow the same students perform in small versus large sections across gender lines. Applying adifference-in-differences design to our data allows us to control for all student-fixed attributes(most importantly, ability) to identify the effect of small classes by gender.Third, our study has advantages even relative to other experimental approaches. InTennessee STAR, for instance, some 60% of students leave or switch away from their assignedclassrooms.7 In contrast, in our study, all students remain in the class as assigned; no studentsdrop out, course section assignments are mandatory, and all students sit for the final exam.Fourth, Stanford’s assignment and grouping was conducted to maximize representativenessacross sections, not with any evaluation of class size in mind. Hawthorne effects, wherebyinstructors modify teaching because of the experiment, are thereby impossible. Last, while manyhave conjectured that class size effects vary at different levels of education, prior work focusesoverwhelmingly on early education,8 despite mounting evidence of achievement gaps in highereducation. Our study contributes to the literature by providing one of the first examinations ofclass size effects in a post-graduate professional school setting.This Article proceeds as follows. Section 2 discusses the unique natural experiment thatStanford inadvertently conducted from 2001-2012. Section 3 describes fine-grained student andcourse data we collected with the help of the law school’s admissions and registrar offices.Section 4 verifies random section assignment by assessing balance along a host of covariates.5See Kay and Gorman (2008, p. 302) (“Studies have offered conflicting evidence as to whether there is a gender difference inlaw school grades.”); Clydesdale (2004) (finding no gender difference in first-year GPAs); Wightman (1996) (finding a slightgender gap in first-year GPAs); Guinier et al. (1994) (finding a gender gap in first-year GPAs at the University of Pennsylvania);Bowers (2000) (finding gender gap in first-year GPAs at University of Texas); Homer and Schwartz (1989) (finding a gender gapin contracts and property at UC Berkeley); Taber et al. (1988) (finding no gender gap in membership in the Order of the Coif atStanford Law School).6The closest are De Paola, Ponzo, and Scoppa (2013), Krueger (1999), and Fredriksson, Öckert, and Oosterbeek (2012).7See Krueger (1999) (Table 1, attrition rates) and Hanushek (1999) (discussing attrition and failure to sit for exams).8But see Monks and Schmidt (2010), who note,“[o]nly a handful of studies ha[s examined] class size . . . in tertiary education.”
HO & KELMAN, CLASS SIZE3Section 5 examines the effects of class size on the gender gap from 2001-08, when the schoolemployed numerical GPA grades. Applying a difference-in-differences approach, we show thatsmall sections eliminate a small, but highly statistically significant, gender gap that exists inlarge sections. Section 6 examines the evidence after educational reforms of 2008, whichchanged the grading system to an Honors/Pass basis and instituted small, graded, writing andsimulation-intensive courses. We show that the gender gap vanishes under this new system, andrule out the possibility that this is solely due to the coarseness of the grading system. If anything,women systematically outperform men in simulation-based courses, which have even fewerstudents than small sections. Section 7 concludes.2. THE STANFORD EXPERIMENTStanford’s first-year curriculum provides a compelling natural experiment because theschool randomly assigned small sections to specific courses. In addition to randomly matchingsections to courses, the school sought to make each small section representative of the enteringclass as a whole, adopting what is best characterized as a form of (stratified) block randomizationto group students into sections. Unlike other educational settings, students had no choice ofwhich course to enroll in. Student enrollment choices (e.g., in elective courses beyond the firstyear) would otherwise confound estimates of the effect of class size. We first discuss the role ofsmall sections in Stanford’s first-year, mandatory curriculum, and then detail the precisemechanisms of (1) grouping students into sections and (2) assigning sections to courses.2.1. The First Year CurriculumFrom Fall 2001 to Spring 2008, Stanford’s mandatory first-year curriculum consisted ofsix core doctrinal courses (Civil Procedure, Constitutional Law, Contracts, Criminal Law,Property, and Torts) and one writing course (Legal Research and Writing, or LRW). Doctrinalcourses were graded on a numerical 4.0 GPA scale, ranging from 2.1 to 4.3, with a meanrequirement of 3.4 in a course. LRW courses were graded on a mandatory credit / restrictedcredit / no-credit basis. In other courses, students could elect to be graded on a credit / no-creditbasis (the so-called “3K option”9), and the 3.4 mean requirement applied regardless of thegrading option.Beginning in Fall 2008, the law school instituted a series of pedagogical reforms. First,courses would be graded on an Honors / Pass basis (the HP system). The required range was 3040% Honors for doctrinal courses. The rationales for grade reform were to reduce “grade curveshopping” and to eliminate what was perceived as a falsely precise, and to many students anintimidating, numerical GPA system.10 As part of grade reform, students would no longer beable to elect the 3K option.Second, the law school transitioned from a semester to a quarter system in Fall 2009,keeping the first-year curriculum largely unchanged. Mandatory fall quarter courses continuedto meet for the same duration as previously. Winter courses were adjusted to the quarter system.9“3K” refers to the fact that there are three grades under that option: credit, restricted credit, and no credit. In practice, restrictedcredit and no credit were rarely used.10See Andy Guess, Stanford Drops Letter Grades, INSIDE HIGHER ED, June 2, 2008; Orin Kerr, VOLOKH CONSPIRACY, Sep. 27,2008.
HO & KELMAN, CLASS SIZE4Two modifications were that: (i) LRW would be graded and shortened to the fall term, and (ii)the school introduced an even smaller, two-quarter, simulation-based “Federal Litigation” coursein lieu of LRW in the winter and spring terms. The case used in Federal Litigation involved FirstAmendment, personal jurisdiction, and class certification issues. Students were assigned tospecific sides and sets of issues, with a wide range of writing and simulation exercises (initially,drafting a complaint, three briefs, and a bench memo; delivering and judging oral arguments;taking and defending a deposition). The required range in LRW and Federal Litigation was 3550% Honors.Throughout the entire observation period, the entering class, ranging from 166 to 180students, was split into six “small sections” of up to 30 students. In addition to LRW, one falldoctrinal course would be taught exclusively to the small section. The exact substantive field(e.g., contracts or criminal law) would vary both within and across entering classes, basedlargely on faculty availability. Other doctrinal courses were typically taught in a large class,combining two small sections (i.e., roughly 60 students). When Federal Litigation wasintroduced, small sections were split into groups of roughly 18 students (10 sections perincoming class), further divided into legal teams of four to five students each. Depending on theinstructor, Federal Litigation class meetings were often held exclusively between the instructorand the legal team. At all times, exams in doctrinal courses, on which final grades areoverwhelmingly based, were graded blindly, ruling out the possibility of sheer instructor gradingbias.112.2. Grouping and Assignment MechanismsTo understand the mechanism by which students ended up in particular small sections,we detail two decisions: (1) grouping students into small sections, and (2) assigning smallsections to specific classes. These decisions were made to ensure fairness in andrepresentativeness (i.e., balance) across section assignments, not to study class size effects.Grouping students into small sections worked as follows. First, after finalizing most ofthe entering class, the Associate Dean of Admissions sorted the list of entering students byacademic index (a function of LSAT and undergraduate GPA), assigning numbers 1 to 6 to eachstudent. To balance the academic index, but to retain the simplicity of assignment, the Deansystematically cycled through the numbers 1-6 (first in order then in reverse order) going downthe list of sorted names: e.g., 1, 2, 3, 4, 5, 6, 6, 5, 4, 3, 2, 1, and so on. The academic indexamongst Stanford students is coarse due to range compression: for instance, the class of 2005 hadonly 7 unique values of the academic index, and the order within a stratum of an index value wasrandom. Second, the Associate Dean made a series of adjustments to balance gender andethnicity across sections, while retaining parity in terms of LSAT scores, advanced degrees, andundergraduate institutions.Assigning the six sections to specific instructors and courses was random. Because theAssociate Dean was unaware of how the six numbers mapped onto specific courses andinstructors, she could not match students based on instructor “fit” or predicted ability to succeed11Blind grading may not rule out the possibility that instructor’s may devalue “female voice” (Gilligan 1982) on exams.
HO & KELMAN, CLASS SIZE5in a particular small or large section. Student characteristics were not consulted in assigningsections to courses, except for very rare circumstances.12Grouping students into sections, as Appendix A shows, is best characterized asapproximating a form of stratified block randomization (see Box, Hunter, and Hunter 2005).The emphasis on balancing gender and ethnicity is akin to stratifying on these variables,increasing, if anything, the efficiency of analysis. The precise order of students in the list isstochastic, as matriculation decisions for specific students can hinge on chance factors (e.g.,deferrals of admission). It is very unlikely that the student list thereby has a (periodic)relationship (e.g., every twelfth student has a low income background), which would confoundthe section grouping. Gender, ethnicity, the academic index and other covariates are byconstruction balanced across sections.While there are strong reasons, based on institutional knowledge of the assignmentmechanism, to believe that the school randomized students into small sections, Section 4 verifiesempirically that small sections are balanced along all covariates. Appendix A demonstrates thatsection grouping was effectively a form of block randomization, stratifying on gender andethnicity.133. DATAWe compile data from the Office of the Admissions on first-year students and matchthese to data from the Office of Registrar on grades awarded to each student in a course. Ourprimary data consists of 15,689 grades assigned in mandatory first-year courses by 91 instructorsto 1,897 students from 2001-2012. Table 1 provides a breakdown of the raw data for the twoobservation periods under the GPA system (2001-08) and the HP system (2008-11). Prior to2008, the overall mean grade was 3.46, which is higher than the mandatory mean of 3.4 due tostudents electing the 3K option. (Instructors graded all exams collectively, without knowledgeof the grading option.) The overall proportion of Honors was 0.42, which exceeds 40% becauseLRW and Federal Litigation are subject to a 50% cap on ors6258All9,5396,150GradesGPA / HP5,6006,141Mean3.460.42Table 1: Summary statistics for sample. During the 2001-08 period, the law school employed a numericalGPA grading system. Beginning in Fall 2008, the law school switched to an Honors / Pass (HP) system. “All”grades include courses graded on the 3K or mandatory credit basis, while “GPA / HP” grades include onlythose evaluated by numerical GPA or H/P grades.Table 2 reports summary statistics of incoming credentials by gender. The two mostcrucial covariates are LSAT score and undergraduate degree, which are comparable for men andwomen. Women differ in other respects, however: they are nearly a year younger and morelikely represent minority groups (e.g, 15% of women are Asian-American, compared to 8% ofmen). These differences along observables are important in understanding the gender gap and12These involved instances where section assignment was adjusted to avoid conflicts of interest (e.g., when faculty memberswere related to the student). These were exceedingly rare and grouping of sections remained intact.13Grouping and assignments into Federal Litigation sections worked comparably.
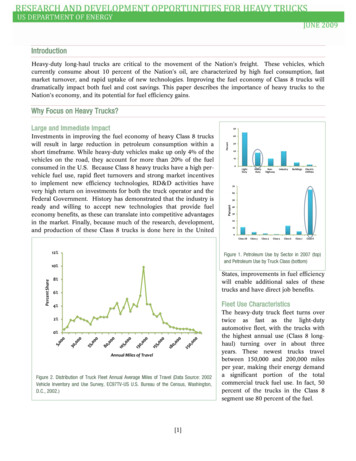
HO & KELMAN, CLASS SIZE6class size effects --- all model-based estimates we present below control for ethnicity or 0.29Undergraduate 0.030.110.070.070.040.300.250.250.18Academic backgroundLaw School AdmissionsTest score (LSAT)Undergraduate degree GPAAcademic index (LSAC)Master’s degreePh.D.Table 2: Covariates at time of matriculation. The first two columns present the means by gender, and the thirdcolumn presents the pooled standard deviation (SD).Figure 1 plots the raw distribution of grades assigned by gender. The grey histogramplots the grade distribution for men and the black outline plots the grade distribution for women.The figure shows that there is a small, but persistent gender gap. On average, women earngrades that are 0.05 GPA points lower than those for men (p-value 0.0001). The gap persists,and remains highly statistically significant, when controlling for the full set of covariates (LSATscore, undergraduate GPA, academic index, age, ethnicity, Master’s degree, doctorate,professional degree, fixed effects for undergraduate institution, instructors, and courses).14Slight demographic differences therefore do not account for the gender gap. Although obvious,it is worth noting that the variation within gender far exceeds that across gender --- despite thegap, individual women and men perform along the entire range of GPAs.14Because of substantial overlap between entering characteristics of men and women, the gender gap persists when preprocessingvia matching to reduce the degree of extrapolation (see Ho et al. 2007).
HO & KELMAN, CLASS SIZE7400Grades by GenderMalep value 2.2e ure 1: Raw gender gap. The histograms present the grades assigned in individual courses by gender. Thegrey histogram represents male students and the black lines represent women.Although the gender gap is small in absolute magnitude, the gap represents roughly 15% ofthe pooled GPA standard deviation --- in a profession that prizes law school performance (seeHenderson 2003). To illustrate the gap’s substantive importance, we examine data on 487clerkship applications by Stanford students from 2003-2008 and data from 2,949 on-campusinterviews in fall 2008, the predominant process for securing private sector jobs. Grades andclerkship placements are highly correlated: a 0.05 GPA increase from 3.6 to 3.65 is associatedwith a 7% (statistically significant) increase in the probability of securing a federal appellateclerkship.15 Similarly, we use data from the fall on-campus recruitment, which is the primarymethod by which students secure private sector jobs (the modal job for students upongraduation). We use data on 2,949 on-campus interviews in fall of 2008 and calculate the rate atwhich students are offered callback interviews relative to the number of on-campus interviews.(On-campus interviews are scheduled via a lottery preventing employers from observing lawschool transcripts, so grades manifest themselves primarily in the rate of callback interviews.)Again, we confirm that grades have a strong positive correlation with the rate at which studentsare offered callback interviews: a 0.05 GPA increase from 3.25 to 3.3 is associated by a nearly5% increase in the callback rate.16 It is worth noting that law firms appear to have become evenmore grade-sensitive since 2008.17 The private callback rate from 2008 may thereby understatethe effect of grades on the current labor market. In short, while small in absolute magnitude, the0.05 GPA gender gap matters.4. RANDOMIZATION CHECKS15This is estimated with a logistic regression with placement in a federal appellate clerkship as the outcome and GPA at the timeof application as the explanatory variable, conditional on applying to an appellate clerkship.16This is estimated using a local polynomial (loess) model. There is no evidence that the association between first year GPA andcallback rates differs between men and women.17See, e.g., Jacqueline Bell, Law School Grads Face Tight Job Market, LAW360, Aug. 6, 2008.
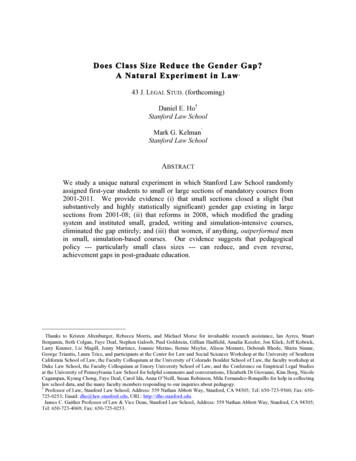
HO & KELMAN, CLASS SIZE8Although there are strong reasons to believe that the assignment mechanism of sectionsto specific courses (and section grouping) was random, we perform a series of randomizationchecks to test for violations. As large sections are composites of small sections, we check forwhether the six small sections in any year of admission exhibit imbalance on key covariates.Figure 2 plots the year of admission on the x-axis against 12 covariates on the y-axis. Each reddot represents the mean (or proportion) for one small section. The white line represents themean (or proportion) for the incoming class. The grey intervals represent the 95% confidenceinterval assuming randomization, calculated by 1,000 Monte Carlo simulations. Underrandomization, the observed mean (or proportion) should generally fall within the intervals.Nearly all do.The figure also reveals that the Associate Dean’s additional demographic shufflingbalances gender and ethnicity beyond what would be expected by chance. The observedproportions of women and minorities line up are closer to the class mean than under purerandomization. Other covariates approximate the randomization distribution. Although somesections fall outside of the 95% interval, the rate is much lower than Type I error rates: underrandomization, we would expect roughly 40 such deviations [ 0.05 α-level 6 sections /entering class 11 entering classes 12 covariates]. In short, the results strongly confirm thatsmall sections were effectively randomized. In Appendix A, we show that the process isessentially a form of (stratified) block randomization, thereby improving balance on gender andethnicity beyond pure randomization. Indeed, the Associate Dean was gladly willing tosubstitute a formal stratified block randomization algorithm that essentially replicated hermanual section assignments.
4.0HO & KELMAN, CLASS SIZEGPAProp.Prop.Prop.Prop.0.0 0.1 0.2 0.3 0.4 0.5 0.0 0.1 0.2 0.3 0.4 0.5 0.0 0.2 0.4 0.6 0.8 1.0 0.0 0.2 0.4 0.6 0.8 1.03.61663.7GPA3.83.9Mean score168 170 172LSAT927 3.0Academic Index3.23.43.6WomenAgeProp.Prop.0.0 0.1 0.2 0.3 0.4 0.5 0.0 0.1 0.2 0.3 0.4 0.5 2223Age24 2526WhiteAcademic IndexAsian AmericanLatinoPolitical Science MajorMaster's DegreeStanford Undergraduate0.4Prop.0.20.00.0Prop.0.20.4African American2001 22003 42005 62007 82009 102011 12Figure 2: Randomization checks for small sections. Each red dot represents the mean for one of six smallsections in an entering class, sorted chronologically by entering class on the x-axis. Vertical lines separateunique entering classes. White horizontal lines plot the mean for the entire entering class. Grey intervals plotthe (simulated) 95% confidence intervals of means under the null of randomization.
HO & KELMAN, CLASS SIZE105. CLASS SIZE EFFECTS, 2001-2008We now focus on assessing the causal effect of class size during the time of the GPAsystem (2001-08). Due to the number of changes --- particularly in grading --- Section 6examines the post-2008 period separately.Figure 3 plots quantile-quantile plots comparing the raw grade distributions for men (onx-axes) and women (on y-axes) conditional on section size. In the absence of a gender gap, thedots should line up along the 45-degree line. The left panel shows that men and women performsimilarly in small sections, while the right panel exhibits the gender gap. On average, men earnGPAs that are 0.05 points higher than women in large sections (p-value 0.01).3.8Women3.43.63.23.2Women3.43.63.84.0Large Section4.0Small Section3.0p value 3.2e 053.0p value ure 3: Quantile-Quantile plots comparing performance on men and women in small and large sections, withdots randomly jittered for visibility. The left panel shows that there is no statistically distinguishabledifference between men and women in small sections. The right panel shows that men on average earn 0.05GPA points more than women.Table 3 provides summary statistics on the differences in means between men andwomen across large and small classes. The bottom right cell calculates the raw difference-indifferences (p-value 0.05): women tend to outperform men by 0.05 GPA points in smallsections relative to large ge)-0.0260.0210.047**Table 3: Raw grade averages by men and women in large and small sections. The bottom row presents thegender difference conditional on class size, subtracting female from male performance. The right columnpresents the class size difference conditional on gender, subtracting performance in large from small sections.The bottom right cell presents the difference-in-differences. ** indicate statistical significance at α 0.05.
HO & KELMAN, CLASS SIZE11To more rigorously assess the class size gender effect, we pursue a difference-indifferences identification strategy. We estimate the following equation:E(𝑌!,!,! ) 𝜏 𝑇!,!,
† Professor of Law, Stanford Law School; Address: 559 Nathan Abbott Way, Stanford, CA 94305; Tel: 650-723-9560; Fax: . Weiss and Melling 1988). Voluminous research confirms that women participate less frequently . class size effects in a post-graduate professional school setting.