Transcription
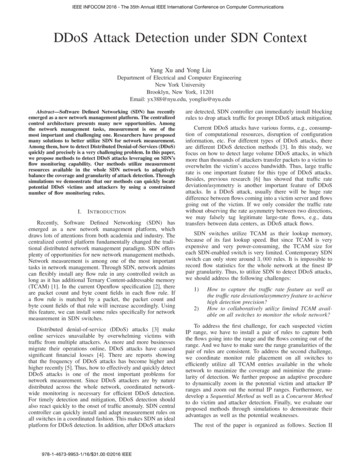
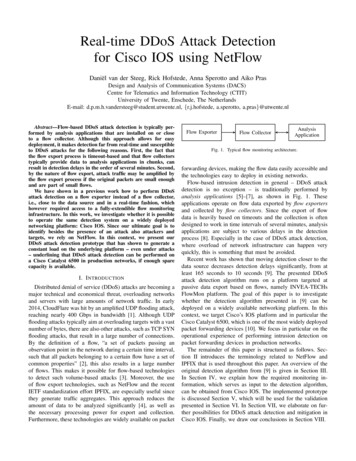
Real-time DDoS Attack Detectionfor Cisco IOS using NetFlowDaniël van der Steeg, Rick Hofstede, Anna Sperotto and Aiko PrasDesign and Analysis of Communication Systems (DACS)Centre for Telematics and Information Technology (CTIT)University of Twente, Enschede, The NetherlandsE-mail: d.p.m.h.vandersteeg@student.utwente.nl, {r.j.hofstede, a.sperotto, a.pras}@utwente.nlAbstract—Flow-based DDoS attack detection is typically performed by analysis applications that are installed on or closeto a flow collector. Although this approach allows for easydeployment, it makes detection far from real-time and susceptibleto DDoS attacks for the following reasons. First, the fact thatthe flow export process is timeout-based and that flow collectorstypically provide data to analysis applications in chunks, canresult in detection delays in the order of several minutes. Second,by the nature of flow export, attack traffic may be amplified bythe flow export process if the original packets are small enoughand are part of small flows.We have shown in a previous work how to perform DDoSattack detection on a flow exporter instead of a flow collector,i.e., close to the data source and in a real-time fashion, whichhowever required access to a fully-extendible flow monitoringinfrastructure. In this work, we investigate whether it is possibleto operate the same detection system on a widely deployednetworking platform: Cisco IOS. Since our ultimate goal is toidentify besides the presence of an attack also attackers andtargets, we rely on NetFlow. In this context, we present ourDDoS attack detection prototype that has shown to generate aconstant load on the underlying platform – even under attacks– underlining that DDoS attack detection can be performed ona Cisco Catalyst 6500 in production networks, if enough sparecapacity is available.I. I NTRODUCTIONDistributed denial of service (DDoS) attacks are becoming amajor technical and economical threat, overloading networksand servers with large amounts of network traffic. In early2014, CloudFlare was hit by an amplified UDP flooding attack,reaching nearly 400 Gbps in bandwidth [1]. Although UDPflooding attacks typically aim at overloading targets with a vastnumber of bytes, there are also other attacks, such as TCP SYNflooding attacks, that result in a large number of connections.By the definition of a flow, “a set of packets passing anobservation point in the network during a certain time interval,such that all packets belonging to a certain flow have a set ofcommon properties” [2], this also results in a large numberof flows. This makes it possible for flow-based technologiesto detect such volume-based attacks [3]. Moreover, the useof flow export technologies, such as NetFlow and the recentIETF standardization effort IPFIX, are especially useful sincethey generate traffic aggregates. This approach reduces theamount of data to be analyzed significantly [4], as well asthe necessary processing power for export and collection.Furthermore, these technologies are widely available on packetFlow ExporterFlow CollectorAnalysisApplicationFig. 1. Typical flow monitoring architecture.forwarding devices, making the flow data easily accessible andthe technologies easy to deploy in existing networks.Flow-based intrusion detection in general – DDoS attackdetection is no exception – is traditionally performed byanalysis applications [5]–[7], as shown in Fig. 1. Theseapplications operate on flow data exported by flow exportersand collected by flow collectors. Since the export of flowdata is heavily based on timeouts and the collection is oftendesigned to work in time intervals of several minutes, analysisapplications are subject to various delays in the detectionprocess [8]. Especially in the case of DDoS attack detection,where overload of network infrastructure can happen veryquickly, this is something that must be avoided.Recent work has shown that moving detection closer to thedata source decreases detection delays significantly, from atleast 165 seconds to 10 seconds [9]. The presented DDoSattack detection algorithm runs on a platform targeted atpassive data export based on flows, namely INVEA-TECHsFlowMon platform. The goal of this paper is to investigatewhether the detection algorithm presented in [9] can bedeployed on a widely available networking platform. In thiscontext, we target Cisco’s IOS platform and in particular theCisco Catalyst 6500, which is one of the most widely deployedpacket forwarding devices [10]. We focus in particular on theoperational experience of performing intrusion detection onpacket forwarding devices in production networks.The remainder of this paper is structured as follows. Section II introduces the terminology related to NetFlow andIPFIX that is used throughout this paper. An overview of theoriginal detection algorithm from [9] is given in Section III.In Section IV, we explain how the required monitoring information, which serves as input to the detection algorithm,can be obtained from Cisco IOS. The implemented prototypeis discussed Section V, which will be used for the validationpresented in Section VI. In Section VII, we elaborate on further possibilities for DDoS attack detection and mitigation inCisco IOS. Finally, we draw our conclusions in Section VIII.
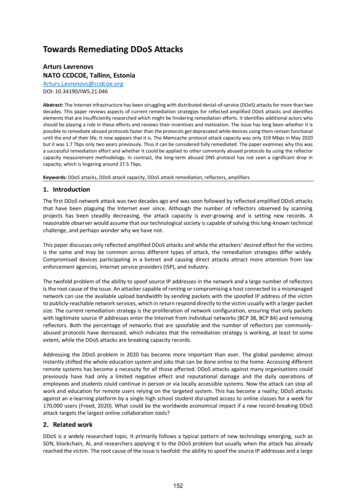
In this section, we introduce the terminology related to flowmetering and export that will be used throughout this paper.For a comprehensive overview of NetFlow and IPFIX, we referto the tutorial in [4].Flow metering and export are the two tasks performed by aflow exporter [4], as shown in Fig. 1. Packets in the networkare aggregated into flows by the Metering Process. When anew flow is observed, an entry for this flow is created in theflow cache. This cache is a table that stores information onactive flows in the network [4]. Aside from the key of the flow,i.e., the fields that identify a flow, some extra information istypically accounted, such as the number of packets and bytesin the flow. We refer to the event in which the cache is full anda flow cache entry cannot be created, which can happen duringperiods of high traffic if the flow cache is under-dimensioned,as a flow learn failure [11]. When a flow cache entry expires,for example when the flow has been active or idle for too longor because of resource constraints, a flow record is exported,i.e., it is inserted in a NetFlow or IPFIX message and sent toa collector for storage and pre-processing.III. D ETECTION A LGORITHMWe use an existing algorithm that has proven to satisfythe requirements of being lightweight, accurate and real-timein the context of DDoS attack detection, described in [9].The algorithm1 runs on a fixed time interval and measuresthe number of flow cache entry creations, as this metric wasshown to be most usable of the four metrics presented in[9]. Based on this measurement, a forecast is made for themeasurement value of the next interval. In case the numberof flow cache entry creations is too high in comparisonwith the past measurement values, the measurement sampleis considered anomalous. However, because Internet trafficshows diurnal patterns, such as strong increases and decreasesin the number of flow cache entry creations during the start andend of a working day respectively, the algorithm also learnsthe normal behaviour of the network over a 24 hour period.The forecasted value is therefore defined as:x̂t 1 bt st ,(1)where x̂t 1 is the forecasted value for the next interval,bt the base component, sometimes referred to as permanentcomponent, which represents the trend of the Internet traffic,and st the seasonal component that represents diurnal patterns.Several enhancements to this algorithm are discussed in [9].First, in order to decrease memory usage, the values usedfor retaining seasonal patterns, st , are stored per hour andinterpolated to estimate the value for a given time. Second, toprevent the algorithm from learning malicious traffic patterns,values such as st and bt are discarded during an attack.Last, since traffic patterns during weekends usually differfrom patterns during weekdays, a distinction is made between1 In [9] two algorithms are described. We use Algorithm 2, which showedthe best results.Flow cache entries (Fc )II. F LOW M ETERING & E XPORTCm Fc01 Fc2345Time [measurement intervals]67Fig. 2. Flow cache entry creations in Cisco IOS over time.weekend and weekdays for season memory. This results intwo training periods, one for weekdays and one for weekends.IV. M ONITORING I NFORMATION AVAILABLE IN IOSThe detection algorithm considered in this paper, which hasbeen summarized in Section III, is heavily based on a singlemetric, namely the number of flow cache entry creations pertime interval. This metric is easily accessible on the flowmonitoring platform used in the original work of the prototype([9]), INVEA-TECH’s FlowMon. Since that platform has beendesigned with extendibility in mind, this information is directlyavailable from the platform’s API. However, the amount ofinformation available in IOS strongly depends on the paththe packet or flow has taken within the router or switch.More precisely, packets are switched either in hardware orin software, although most packets are hardware-switched.On the campus network of the University of Twente (UT),for example, 99.6% of the traffic is hardware-switched [11].Situations that trigger a packet to be switched in softwareare fragmented packets, packets destined to the forwardingdevice itself, and packets that require ARP resolution [12], forexample. For flows processed in hardware, information on thenumber of flow cache entry creations is not directly available.To approximate this metric, we use the following informationavailable from the flow metering and exporting process: Number of flow cache entries (Fc ). Number of exported software-switched flow records (Fe ). Number of flow learn failures (Ff ). This metric is expressed in terms of packets, rather than flows.The number of flow cache entry creations since the last measurement can be approximated using the following definition:F Fc Fe Ffcf(2)When flow cache entries are exported, Fc will decrease whichwill cause the approximation to be less accurate if the measurement intervals are too long. For example, in Fig. 2, if themeasurement were to cover two intervals, from t 2 to t 4, Fc will not consider the peak at t 3. By polling Fc morefrequently, we can observe the changes more accurately, suchthat we observe the positive Fc at t 3 and the negative Fc at t 4, which is caused by exports. Then, if Fc is
negative, we use an estimation of previous Fc values instead.When the flow cache is nearing its capacity limit, the exporterissues an emergency expiration [4]. In Fig. 2 this is depictedin the shaded area. As Fc reaches Cm , the flow cache capacity,most flow cache entries are expired. If a measurement is madebetween t 6 and t 7, the algorithm may detect this as anattack for one measurement interval, due to the vast increasein the numer of cache entries compared to t 6. To counteractthis, the implementation waits for the next measurement if itsuspects an attack, to validate whether it is an actual attack.This does however increase the detection delay.Since the number of entries in the flow cache (Fc ) onlyregards hardware-switched flows, we also add the number ofexported software-switched flows (Fe ), which can be obtaineddirectly from IOS. Finally, adding Ff allows for regardingflows that should have been created but were not, which isespecially the case during high-intensity DDoS attacks, forexample. To compensate for the fact that Ff is expressedin packets while the other metrics are expressed in flows,we divide Ff by the average number of packets per flow,represented by cf in Equation 2.V. I MPLEMENTATIONThe Embedded Event Manager (EEM) – part of Cisco’s IOSthat handles real-time network event detection – allows for thedefinition of policies, which can be used to execute an appletor script when events are triggered. For example, emails canbe sent to network administrators when round-trip times reacha certain limit, or when network route changes occur. Anotherevent type is based on time. This event can, among others,be scheduled at fixed time intervals. In this work, we use twotime-based policies, implemented as TCL scripts:2 Measurement policy – Determines the first componentfor our approximation of the flow-based metric: the number of flow cache entries (Fc ), as described in Section IV. Detection policy – Retrieves the remaining components:the number of exported software flows (Fe ) and thenumber of flow learn failures (Ff ). Also, it implementsthe actual DDoS attack detection algorithm.To obtain all three components, which are all made availableusing the SNMP protocol, we use a feature of the EEMenvironment that provides access to local SNMP objects. Thereason for splitting the measurement policy from the detectionpolicy is that we require a higher resolution for the former todetect changes more accurately, as described in Section IV.Policy invocations are memoryless, and since we want toshare data – both between policy runs and between policies –a method for sharing data needs to be implemented. Due tothe fact that the filesystem is flash-based, we generally want toavoid excessive write actions that will shorten the memory’slifespan. The EEM environment therefore offers a Contextlibrary for this purpose; it allows for saving TCL variables tomemory instead of writing them to disk. Besides for keeping2 The open-source TCL scripts can be retrieved ck of our data between policy runs, we also use this featureto exchange information between the two policies, as the resultof the measurement policy is needed by the detection policy.The two policies discussed before are executed by the EEMat their respective intervals, which have been selected basedon the runtime of the respective policies. When the switchis however under heavy load, its higher CPU utilization willcause the policies to take longer to execute. To avoid thepolicies from skipping an execution when the runtime of thepolicy exceeds the length of the interval, the prototype utilizesa feature from the EEM that can set a maximum policyruntime. If this runtime is exceeded, the policy terminatesforcibly and data is lost. In the case of the detection policy,the algorithm has to start again from the learning phase asall state data is lost. If the measurement policy terminatesprematurely, the measured number of created flow cacheentries will be lower, as it missed a measurement, which willslightly impact the accuracy of the algorithm. To prevent thedetection policy from being killed, a margin has been added tothe interval which allows it to run longer if necessary, but neverlonger than the interval at which it is executed. The averageruntime of the detection policy is 2–3 seconds under normalconditions, and has shown to reach 7–8 seconds under stress.Therefore, the final interval chosen for the detection policy is10 seconds. For the measurement policy, measurements haveshown that 2 seconds provides an optimal balance betweendetailed measurements and loss of data due to termination.VI. VALIDATIONIn this section, we describe the validation of this work,starting by identifying the requirements in Section VI-A. Next,we give a description of the validation setup, as well asspecifics regarding the deployment, in Section VI-B. Finally,we discuss the results in Section VI-C.A. RequirementsThree requirements were defined for the original detectionalgorithm: 1) it should be lightweight in terms of CPU andmemory utilization, 2) the accuracy should be high enoughto ascertain a low number of false positives/negatives, and 3)the detection delay should be reduced to roughly 10% of conventional intrusion detection approaches [9]. However, sincethe the Cisco Catalyst 6500 is a high-speed packet forwardingdevice that has not been designed for performing intrusiondetection tasks, special care must be taken to not overloadthe device and possibly interrupt forwarding activities. Wetherefore relax the real-time requirement to detection within30 seconds, while the CPU and memory utilization mustbe 10% or lower. Since the accuracy of the algorithm hasalready been validated in [9] and because it is invariant to theunderlying implementation platform, we discuss the accuracyrequirement only briefly.B. Setup & DeploymentThe implementation described in Section V has been developed on a Cisco Catalyst 6500 with Supervisor Engine 720,
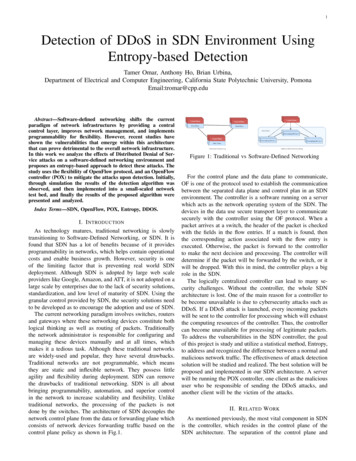
Routing CPUSwitching CPUSwitching CPU #2Memory 14-08-27Memory utilization (%)CPU utilization (%)502014-08-28Creations per second (k)Fig. 3. Load of the Cisco Catalyst 6500 over ig. 4. Flow cache entry creations per second (averaged per 5 minutes), as processed by the detection algorithm over time.running IOS 15.1(2)SY1. We have used this in combinationwith the WS-X6708-10G-3C line card for 10 Gbps Ethernetconnectivity. The traffic used for validation is mirrored fromthe uplink of the UT campus network to the Dutch NationalResearch and Education Network SURFnet and consists ofboth educational traffic, i.e., traffic generated by faculties andstudents, and traffic of campus residences. The link has a wirespeed of 10 Gbps with an average throughput of 1.8 Gbpsduring working hours. Furthermore, flow data is exported to aflow collector, such that attacks detected by the prototype canbe validated manually.The network traffic used in [9] differs from the networktraffic used in this work, both from its nature (backbone trafficvs. campus traffic) and volume. It is therefore clear that wehave to adjust the parameters of the detection algorithm toachieve similar accuracies as in [9]. As such, we have selectedthe optimal parameter values3 for our observation point. Forthe parameter cf , used for approximating the number of flowcache entry creations, as described in Section IV, we havemeasured cf 59.8133 packets per flow on average in oursetup.C. ResultsThe most important requirement to be validated in thiswork is that the implementation must be light-weight, suchthat the implementation does not interfere with the primaryactivities of the packet forwarding device, namely routing andswitching. We measure the resource consumption both in terms3 The parameters used in this work are: cthreshold 4.0, Mmin 7000,ccusum 6.0, α N2 1 , where N 540, and γ 0.4.of CPU and memory utilization. In Fig. 3, the CPU load ofthe device is shown together with the memory utilization,averaged over 150 seconds. Using SNMP, the load of the CPUis measured for three components, namely the routing CPU,which handles L3 traffic, and two switching CPUs, whichprocess traffic at L2. Once a routing or switching decision hasbeen made by the CPU, hardware handles subsequent packetsif possible. Furthermore, the routing CPU also handles thenetwork management (including the EEM), as most of this isdone on L3. Consequently, our EEM policies also run on therouting CPU, and as such any load caused by our policiesshould account to the load of the routing CPU.In Fig. 3, the policies are active during the entire measurement period, even in the period from August 24 18:00 toAugust 25 16:00 where the switch received no data. Becausethe CPU utilization of most individual processes is reportedas 0–1% and only peaks are reported as more than 1%,we only consider the overal CPU usage. Consequently, theoverhead of managing and executing only the policies cannotbe observed. This overhead is caused by processes such asthe Chunk Manager, which handles memory allocation, EEMServer, which manages all EEM policies and applets, andSNMP ENGINE, which handles all SNMP requests. Becausethe overhead of operating our policies is caused by multipleprocesses, which also run when our implemented policiesare disabled, we have measured the difference in CPU andmemory utilization between operation with and without ourpolicies. To measure this, the switch has been rebooted to clearall memory and CPU utilization. During the measurements, wehave observed a load on the routing CPU of 4%, combined
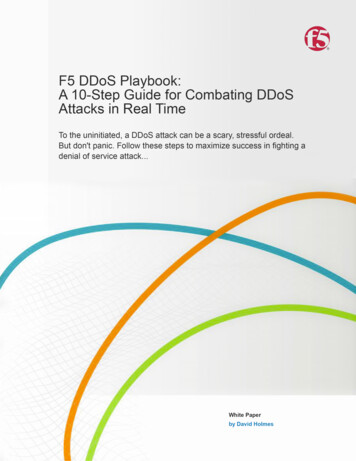
with a memory utilization of 31.3%. After enabling our policies we have observed an increase of 20% in CPU utilization,and an increase of 0.2% in memory utilization. This accountsfor the average constant load added by our implementation.During the period in which our detection algorithm wasdeployed, one attack passed our validation network on August25. The attack lasted around 20 minutes and consisted of DNSreflection traffic and TCP traffic. During this attack, we onlyobserve a minor increase of the load of the switching CPU,caused by the increased number of packets to be switched, andno increase in load for the routing CPU. As such, we concludethat the CPU load caused by our implementation during attacksdoes not peak and instead only consists of the constant load.The peaks in the load of the routing CPU, visible in Fig. 3,are likely the effect of other routing or management processeson the Catalyst 6500, as such processes are handled by therouting CPU. In terms of memory utilization, we clearlyobserve a stable pattern in Fig. 3. We do not observe anyincrease in memory utilization during the attacks, which makesus to conclude that the memory utilization does not createsignificant peaks.Considering the above measurements, we conclude that thememory utilization does satisfy the requirement of using 10%of memory or less. However, the 20% CPU load caused byour implementation does not satisfy the requirement of 10%CPU utilization or less. As the Catalyst 6500 is a packetswitching device and not meant to perform network attackdetection, such other activities should not interfere with itsmain purpose of operation. As a load of 20% is probableto cause interference with the routing and switching tasks,we conclude that our implementation does not satisfy therequirement to be light-weight. The difference between themeasured constant load and the lack of peaks in Fig. 3 can beexplained by the fact that the amount of traffic does not changethe number of computations performed by the policies, as onlythe calculated values are different. Furthermore, the short andfrequent execution of the policies will be averaged out to aconstant added CPU load. Especially the short intervals inwhich the measurement policy is executed (i.e., 2 seconds),increases the load. However, increasing this interval would decrease the measurement resolution, as described in Section IV.The second requirement is the detection delay. This requirement, like the accuracy, has already been validated forthe prototype in [9]. Our implementation uses an intervalof 10 seconds between invocations of the algorithm, insteadof 5 seconds as in the original work, due to the runtimeof the algorithm, as described in Section V. This results indetection delays of multiples of 10 seconds, with a minimumof 10 seconds. The attack visible in Fig. 4 was detected withinthe third interval, resulting in a detection delay of 30 seconds.The final requirement considered in this work is the accuracy of the DDoS attack detection. In Fig. 4, the numberof flow cache entry creations per measurement interval isshown, averaged over 5 minute intervals. Weekends are shadedin light-gray. Diurnal patterns are clearly distinguishable anddue to the nature of the traffic, we can also observe thedifference between weekdays and weekends. The anomalousperiod around August 25 is caused by a lack of data as theswitch did not receive any traffic during this period. Theattack on August 25 is cleary distinguishable in Fig. 4. Itresulted in around 200% more flow records than predictedby the algorithm, and lasted for roughly 20 minutes. Multipledetection marks are shown, as the attack spanned multiple5 minute intervals.VII. D ISCUSSIONThe prototype presented in Section V retrieves informationfrom the underlying platform using SNMP. We know thatretrieving information using SNMP could be performed by anyother system, even a Raspberry Pi, maximizing the availableprocessing power of the forwarding device for routing andswitching. However, since our ultimate goal is to performattack mitigation that requires information on attackers andtargets, we deliberately perform detection on the forwardingdevice itself (where NetFlow is available), which allows forrapid deployment in production environments at no additionalcost.Although the detection of attacks is a crucial first step, itmerely serves the ultimate goal: attack mitigation. In [9], notonly attack detection is discussed, but also mitigation. Whenthe detection algorithm is run and a measurement sample isconsidered anomalous, mitigation is started by counting thenumber of exported flow records per source IP address; as soonas more than 200 flow records with three packets or less havebeen exported per second for a particular source IP address,the source IP address is blacklisted. Blacklisted IP addressesare added to a firewall to block traffic from the attacker.Furthermore, to prevent flow collectors from overloading, flowrecords with these IP addresses are not sent to the collector.When the algorithm detects the end of the attack, the createdrules are removed from the firewall.The information used to identify attackers in [9] is notavailable in IOS; only the total number of exported cacheentries is available. An alternative approach for identifyingattackers is to analyze the contents of the flow cache. However,the IP addresses of attackers will be overrepresented in thecache during a DDoS attack, since attackers generate largeamounts of traffic, resulting in a large number of flow cacheentries. However, the time needed to retrieve and process theentire flow cache under load – which consists of at least 128kentries, depending on the used hardware – can take up to tensof seconds, making timely mitigation hardly possible.A different approach to implement mitigation is the use ofan IOS feature that keeps track of the top x (0, 200) flowsfeaturing the highest volume, either in terms of packets orbytes, referred to as NetFlow Top Talkers. This feature cannotshow the top talkers by the number of flows produced by ahost, which would be very high for sources of DDoS attacks.Furthermore, it is likely that legitimate users will be in thetop talkers list, as they can generate just as many packets andbytes. We therefore conclude that it is hard to identify theattackers and set aside mitigation in this work.
VIII. C ONCLUSIONSThe goal of this research was to investigate the use ofhigh-end packet forwarding devices for detecting, and ultimately mitigating, DDoS attacks in real-time. And yes, it ispossible to detect DDoS attacks, which has been proven bythe deployment of our prototype on a Cisco Catalyst 6500.Our results show that detection of flooding attacks is possiblewithin tens of seconds, making real-time detection on a widelyavailable switching platform possible. However, our prototypehas also shown to cause a CPU load of 20%, which maycause interference with the routing and switching processes.According to various network operators we have stayed intouch with during this work, if the capacity of the packetforwarding device is available, it should be possible to runour DDoS attack detection in production environments. Whileit is possible to deploy our implementation with only 20–30%CPU capacity available, for example, it would require to berun with a lower priority, to not interfere with the routingand switching processes. As this may cause instability to ourprototype, it is advised to have at least 40% CPU capacityavailable.Several requirements were identified beforehand, the firstbeing a small footprint of the implemented detection algorithm. Validation results have shown that there is no visible increase in CPU and memory utilization during attacks.However, when monitoring the overall increase in CPU andmemory utilization, an increase of 20% CPU and 0.2% memory utilization can be observed when running the prototype.While the memory utilization satisfies the requirement of using10% or less of the available resources, the CPU utilisationdoes not satisfy this requirement. Second, validation of ourprototype in the UT campus network has shown that detection delays of 30 seconds are feasible for high intensity attacks, satisfying the requirement of real-time detection (within30 seconds). This corresponds to three times our measurementinterval of 10 seconds. Smaller measurement intervals maydecrease detection delays, but will make it more likely that ourdetection runs overtime and is killed by a management process.The last requirement for our implementation is detectionaccuracy. Our validation results show that the number of falsepositives is low, while the detection rate is high, because ofwhich we conclude that our prototype is accurate.Mitigation is the next step, after detection. Our investigationhas shown that while it is possible to obtain enough information to identify possible attackers, the command used to obtainthis information can take tens of seconds when the switch isunder heavy load, which occurs during flooding attacks. Wetherefore conclude that real-time mitigation is not possible onthe hardware used in this work.Future work includes investigating alternative implementations on different hardware. The successor of the SupervisorEngine 720, the Supervisor Engine 2T, contains more powerfulhardware and provides additional functionality. This morepowerful hardware is likely to influence the load caused by ourimplementation in a positive way, and potentially even allowsfor real-time mitigation. Furthermore, a brief
DDoS attack detection prototype that has shown to generate a constant load on the underlying platform - even under attacks - underlining that DDoS attack detection can be performed on a Cisco Catalyst 6500 in production networks, if enough spare capacity is available. I. INTRODUCTION Distributed denial of service (DDoS) attacks are becoming a