Transcription
1. A R. C-929SGOVERNMENT OF INDIAATOMIC ENERGY COMMISSIONON-LINE MONITORING AND DATA REDUCTION OFSEISMIC EVENTS AT GAURIBIDANUR ARRAYbyR. N . Bbdrthur, B. S. S. Rao and Falguni RoySeismology SectionBHABHA ATOMIC RESEARCH CENTREBOMBAY, INDIA1977
B.A.R.C.-920SGOVERNMENT OF INDIAATOMIC ENERGY COMMISSIONt orfON-LINE MONITORING AND DATA REDUCTION OFSEISMIC EVENTS AT GAURIBIDANUR ARRAYbyR, N. Bharthur, B. S. S. Rao and Falgunl RoySeismology SectionBIJABHA ATOMIC RESEARCH CENTREBOMBAY, INDIA1977
INIS Subject Category : E42Deacrlptori sON-LINE SYSTEMSMONITORINGSEISMIC WAVESDATA PROCESSINGEARTHQUAKESSEISMIC DETECTIONPERFORMANCEINDIASEISMOLOGY
ON-LINE MONITORING AND DATA REDUCTION OFSEISMIC EVENTS AT GAURIBIDANUR ARRAYbyR. N. Bharthnr, B. S. S. Rao and Falgunl Roy1. INTRODUCTIONA TDC-12 computer with 16 K memory is being used along withthe 20 element short-period seismic array at Gaurlbidanur for the onlinedetection and preliminary analysis of seismic data. (Ram Datt et at.,1969). As described by Ram Datt and Dilip Kumar (1973), the onlinesystem in its present form comprises of a 24 channel multiplexer and 12bit ADC, a digital magnetic tape recorder, high speed reader and punchas well as teletypes in addition to the basic computer. This reportdescribes the performance of the system to-date, associated soft-waredevelopments and system improvements. A critical appraisal is also givenof its overall performance, utilisation factor and the system changes madefrom time to time to streamline its performance in the context of onlinemonitoring of seismic events.2. ONLINE LOCATION OF SEISMIC EVENTS2.1 Array location of teleseismic sourcesA teleseismic event (distance 3000 Kms) can be located byestimating the apparent surface velocity vector corresponding to itsprimary or P wave signals. A seismic signal propagating across the arraywill have' characteristic, time delays from sensor to sensor. Computationof these time delays In turn makes it possible to calculate the apparent
-2-surface velocity of the signal. It can be shown that, for a linear crossarray with equtspaced sensors, like the one at Gaurlbidanur (SinghS. R. et al., 1969; Varghese T, G., 1968) the apparent surface velocityof the signal Is given byWhere d is the standard separation between two adjacent sensors alongone arm. For Gauribidanur array d is 2. 5 kms. TA and T n are thenormalised time delays for two arms of the array respectively. Backbearing of the seismic source from the receiving array is given by(2)In a spherically symmetric earth, the velocity of the seismic signalsincreases with depth and hence signals arriving from Increasingly largerdistances penetrate deeper into the mantle. Due to this phenomenon,apparent surface velocity is an increasing function of epicentral distanceA fourth order polynomial was fitted between observed apparentvelocities and known epicentral distances in order to derive a directestimate of the distance, from the apparent velocity. The relation obtainedis as follows (Ramdatt et al, 1969).A *WhereAO 65. 5383Al 9. 67276 x l O 3A2 -1.94254 x 10 5
A3 1. 27495 x l O 6and A4 - 2 . 1 1 8 2 4 x 10 6where A l i b degrees (l o« 111 Kms) i. e. the angle subtended by thesource and the receiver at the centre of the earth.With the help of equations (1) and (2), source could be located usingthe following relationsx « Arc Cos (Cos o Cos A Sin «Sin Ay Arc Cot (Sine Cos A Cosecz'-Cos eCosCotZ) 4 0Z)(4a)(4b)X, Y denote Co-latitude and east longitude respectirely CM the sourer;.d and are the same for the receiver and Z is the azimuth of thesource with respect to the station, qlockwise from north.2.2 Evaluation of Apparent Surface VelocityAs the Liter-element spacing of the sensors along an arm is constant, the time delay introduced between two adjacent sensors by a propagating signal will also be constant. To find out this delay a free searchis made by forming the time shifted sums for all possible delays between. 25 seconds to -. 25 seconds in steps of. 05 seconds.For a given delay d, the time shifted summation is done ai follows:toS Z ***i 8,2/5,-»C (5a) 5b whereJ«(R -«4(KH)is the Jth data point of channel K Sf arm A while S* and S arethe ith point of the summed series for arms A IcB respectively. R is the
reference or starting point for the processing which is assigned for thesake of convenience an arbitrary value of 45. Value of R is augmentedby 16 each time, whenever a new data block is processed.2. 3 Choice of Sampling rate and length of processing hldckIn the standard beam- steering procedure using discrete data, theprincipal parameters involved are the sampling rate and the length of thedata used for beam formation. Although higher the sampling rat* betterthe estimation of the parameters subject to adequate signal coherence,the computation time increases with sampling rate.Tclesetsmlc signals have their predominant frequency lying in theband; . 5 hz - 2 hz. But at the same time there are also high frequency windgenerated as well as cultural noise going upto 10 he. Therefore, in order tofulfil the Nyquiat criterion, a sampling rate of 20 samples per second hasbeen chosen and the signal is prefittered using a 10 has low pass filter. Anoptimum length of data is to be selected before carrying out the phase shiftedor time shifted summation. This length has been fixed to 16 date points orsamples for the following reasons. Large date length leads to the suppressionof weak signals of smaller duration; on the other hand too small a block lengthresults in poor contrast in coherency between noise and tele seismic P-wavesignals.2. 4 Optimisation of the beamFor each channel (there are ten equispaced sensors along one arm)one buffer is allotted in the computer memory. Each has the capacity ofstoring 176 data points corresponding to 8. 8 seconds in roal time. ADC
-5-output* are quentially stored in these buffers. When the buffer*.gatfilled .up, new incoming data is stored from the beginning of the buffer*thereby overwriting the old data. But before doing this, cars is takento process the old data. In order to find out the actual time delays atdifferent sensors corresponding to a propagating seismic signal, thetime-shifted sums are formed with the help of equation 5a and 5b. 16summed points are thus obtained for each delay d. These numbers arethen stored cyclically in another set of buffers. There a*e eleven suchbuffers, each having a storage capacity of 64 numbers (i. e. four block*of data). The next step is to form modulus sum of each series of 64numbers (16 nos for the current block and 48 numbers for the older block*)corresponding to individual delays. Series having the maximum modulussum along with the corresponding time delay is preserved for each ofthe arms.3. DETECTION OF TELESEISMIC EVENTSSixteen numbers corresponding to the current block for the 2 arm*are then used to form the cross correlation corresponding to the optimumlag combination.ZS?.Sfwhere P Nis the crosscorrelation for N*" block,(6)N being anonzvro positive Integer. P N is then compared with a fixed thresholdTj (which is kept slightly above the value corresponding to the ambient
-6nolae leret). If P exceeds Tj, a teleseiamic F-wave aignal arrival iaIndicated. In order to confirm thi«, the deciaion la deferred to find outif F N ,exceeda threahold T2 (which ia about. 75 Tj, thia ta done in orderto account for the decaying nature of the aeiamlc aignala Fig. 4). If thiacondition ia satisfied, the program proceeds to check the periodicity of thetime- shifted aum for the optimum combination of time tag*,., provided thiacombination ia identical for both the blocks. If thia condition ia not satisfied, the possibility of an event is.ruled out.For further precision, parabolic interpolation of the discrete lagis done using the following relation.(7a)(7b)whereK is the number of points, usually 64, taken for the dot product N. andN B are the discrete time delays estimated by time shifted sums, n A and
-7-n B are the optimally interpolated lags. Once the time lags are obtained,the apparent surface velocity of the signal along with the direction and:distance of the source is calculated using the relations (1), (2) and (3)respectirely.4. SUPPRESSION OF SPURIOUS TRIGGERSBefore printing out the parameters, the period of the signal iscalculated. In case the period is found to be greater than 2 seconds,possibility of an event is ignored. This is done mostly to eliminatespurious triggers due to long period noise. Since the power system spikesappear in all the channels simultaneously, the program rejects zero-zerolag combination to eliminate them. Such rejection does not affect eventdetection, because-such a combination is restricted to signals from antipodal sources. A typical long period noise trace is shown in Fig. (3) andthe flow chart of the program is gv-.-on in Fig. (2).5. DETECTION OF LOCAL EVENTSSignals due to local events are characterised by high frequencies.Location of such events which require higher sampling rates is not withinthe scope of this system. Nevertheless such events are programmed to bedetected by the computer after finding out the modulus sum of the signalcorresponding to three widely spaced sensors and comparing them with afixed threshold. If the modulus sum due to each sensor exceeds thethreshold, a trigger pulse is given to a 8-channel paper chart recorder onwhich the corresponding signal is displayed.
-8-6. REDUCTION OF DATA AND EXTRACTION OF EVENT PARAMETERSAfter calculating the parameters of an event the following taaks arcperformed under computer control:(a) the teletype is switched on; parameters are then printed on theteletype along with the onset time In CJMT derived from the RealTime clock.(b) 8-channel paper chart recorder is triggered simultaneously tohave a visual display of the event. Few typical computer printouts are given in Table-I.(c) The relevant data is recorded along with time channel on 7-trackDigital magnetic tape in IBM compatible format.These tapes- are sent to Trombay and transcribed on 14 trackBSSM-6 tapes,- using a tape to tape converter. Digital data thus obtainedis aubjected to further processiug to improve the detection capability andutilised for research-oriented off-line analysis in the BESM-6.7. TIME SHARING FACILITYDuring the real time operation of a computer, the processing ofdata should be completed at a speed which is more than or equal to theinflow rate of data; otherwise overlapping of data is bound to take place. Inthe present updated system, accumulation of 16 data points takes 0. 8 secondsand processing of the same takes about 0.6 seconds. So in each cycle ofprocessing 200 milliseconds are available for additional programmes. Atime-sharing program was therefore developed to provide a facility forrunning diagnostic routines, vis. CPU diagnostics. Any malftmctiontng of
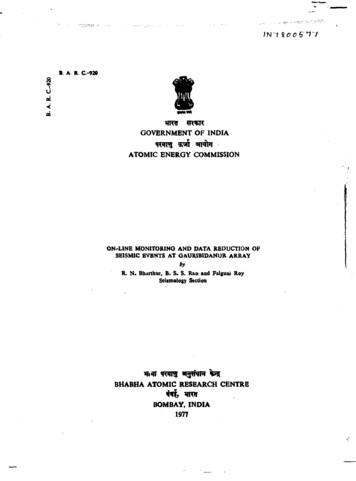
-9-the computer could be Immediately lndicaUd on the teletype output,thereby saving valuable computer time.8. OFFLINE REPLAY FACILITYIn order to ensure reasonable degree of confidence in (he parameters computed online, requisite soft-ware and hardware changes weremade to facilitate offline analysis of the data collected in analogue magnetic tape form. Data continuously recorded on 24 channel magnetictapes are replayed first at a speed of 10" per second roughly about 33 timesthe speed at which it was recorded. To search for authentic seismic eventseach of which lasts only for a few minutes of real time and which occur atan average frequency of about 6 per day, a time code reader (Kolvankar V. Q.1976) is used to automatically stop the replay just prior to the onset time ofthe corresponding event. The relevant portion of the signals are thenreplayed at the recording speed of 0.3 inches per second and fed to thecomputer system through the demodulators and ADC-MUX (Analog to Digitalconverter and multiplexer). Block diagram of the system is illustrated inFig. 1. This procedure is effectively utilised for transcribing the relevantportions of all authentic signals on a 24 track library; tape so as to msure. their long term retention in the most economic and, TiWPpft form. , Anotherfeature of this facility is that it permits a critical evaluation of 111* fectorswhich contribute to spurious triggers so that effective center measurescould be incorporated in the programme to suppress mem,9. SYSTEM. PERFORMANCEAlthough the smooth. 1tartf ealBf of the cemaeter system is cen-
-10strained by large mates voltage fluctuations, inadequacy of air-conditioning as well as the problems due to dust, the computer system along -withthe digital data acquisition facility has been satisfactorily working sincethe beginning of 1975.Table III shows the computer operation between January 1975 andOctober 1976. To highlight the capability o the system, few weak eventswhich were detected by the computer are shown in Fig. 5. It was observedthat due to drift in the carrier frequency u jed in the field telemetry systemindividual channels used to have some DC shifts. At times it could beappreciable and might cause an event to be missed because it may causethe value of Pjy of eqn (6) to become less than T due to large negative shift.On the other hand a large positive DC could give rise to spurious triggers.To overcome.this problem, DC is removed from Individual channels periodically by software. Since the incorporation of DC removal programme,detection capability has improved, which is apparent from the computeroperation daring the year 1976 (Table HI).Table II gives a comparison of the location estimate obtained bycomputer analysis with those derived from bulletins such as NORSAR10. CONCLUSIONSReduction of the threshold may improve the detection capability ofthe system,- but it will lead tomore spurious triggers. In order toovercome this problem, the nature of the spurious triggers is studied indetail.It is found that in general the cross correlation
-11coefflcient between the two be»ma viz. sand S , due to spuriouetriggera ha* a maximum value of. 4, where aa the corresponding valueof aelsmic eventa ahowed a minimum of. 6. Therefore with the incorporation of a programme which auppreaaea all the triggera having acroaa correlation coefficient of . 4 and less, it will be poaaibte tofurther bring down the threshold level.ACKNOWLEDGEMENTWe are grateful to Shrl T. G. .Vargheae or hia continued interestand In editing the report critically. Thank are also due to Shri K. J. Rao,Shri K. K. Sankaran, Shrl N. Satyanarayana and Shri A. G. Prasad forextending their help.REFERENCES1. V. Gv Kolvankar, Generation and Extraction of Timecode for Multichannel data recording, Freaented in National Seminar on "Time and.Frequency" organised by National Physical Laboratory, New Delhi(1976)2. Ramdatt and Dillp Kumar, 'On-line aeiamic data processing". Journalof the Computer Society of India, 4, 1 (Jane 1973)3. Ramdatt, Manekar and T. G. Vargheae, "A digital proceaaing system forGauribidanur array data". Proceedings of the Symposium on the Use ofGauribidanur data for.Seismological Res, BARC, Bombay (1969)4. Singh et al., "Technical aspect ot the Gauribidanur Seismic array",Proceedings of the Symposium on the Use of Gauribidanur data forSeismological Res. BARC, Bombay (1969)5. T. G. Varghese, The Gauribidanur Seismic Array, NucU India, 6,10(1968)6» NORSAR - Norwegian Seismic ArrayEDR- Earthquake Data Report
-12TabU-IFEW TYPICAL COMPUTER PRINTOUTS OF EVENT imo(In GMT)21 01 7520 54 1357.650.44.926 01 7503 41 1744.188.34.719 02 7506 30 5285.095.45.314 03 7520 08 5757.6103.5522 03 7515 36 2217.1347.05.131 03 7503 00 0444.165.75.511 04 7514 33 182 5. 9316. 04.716 04 7519 39 1057.6103.54.619 04 7517 41 2018.5280.24.020 04 7521 27 3423.1275.45.013 06 7519 24 0957.650.44.704 07 7502 20 3757.6103.54.707 08 7504 04 0238.60.05.206 07 7521 13 5557.6103.54.8Magnitude'
-13-Tabls- nGLOBAL. DETECTION AND LOCATION BY ON LINE COMPUTERDateTime(In GMT)G BALocationConfirmed by06 03 7518 29 57KamchatkaNORSAR*, EDR 07 03 7504 22 23RumaniaNORSAR, EDR12 03 7510 56 20Aleutian I*.NORSAR, SDR07 04 7522 22 36Mindanao,Philippine*NORSAR'17 04 7514 05 37Honshu, JapanNORSAR19 04 7513 50 36Arabian SeaNORSAR, SDR05 05 7513 50 23SinfciangNORSAR23 05 7516 10 00TaiwanNORSAR, EDR12 06 7514 15 36Soutaeen IranNORSAR, EDR05 08 7503 06 43Solomon laNORSAR, EDR07 08 7504 04 02Eastern KazakhU. S. S. R,,NORSAR, EDR03 01.7619 34 07NevadaNORSAR, EDR Earthquake Data Report* Norwegian Seismic Array
-14Table IDREAL TIME COMPUTER DETECTION OFFSIGNALS t STATISTICSPercentage of Signals Detected la the Amplitude Ranges11-22 mu m h t 4.6-4.9i19751976(Upto Oct.)II22-44 mumjj : 4. 9-5.44.756.747.163.82IIiI44-88 mum b t 5.2-5.66.273.25J88 mam b 5.591.596.4AVERAGE NOISE LEVEL AT 1 HZ C* 12*mj, Is the body-wave magnitude on Richter scale for a typical sourcedistance of 5500 Kmi.
ONUNE SEISMIC DATA PROCSSSNG (SIGNAL DETECTION AND SUtiNG)SYSTEM CALIBRATIONFinX)INSTRUMENTATIONADC-MUX12 BITS24 CH.TOC-12(16-K)EDITED OUTPUTSCHPONOMETERAnalogMag.Tap«TRANSCRIBERF S KINTERFACE8-CH. STRIPCHART 7 TRACK DIGITALMAG- TAPERECORDER(556 Bpf)"OFF-LNE ANALYSIS" FORM/UTOR7 TRACKTAPE4 TRACKTAPECOMMUNICATION BYVOICEDATA UTILISATION1. SOURCE STUDIES.TYPICAL DETECTION PARAMETERS.BESH6 2. EARTH STRUCTURE!DAYARRIVALTME DtST- Off?. MAG3. NOISE STUDIES.86 06:32: 51425 32 f 51FIG-1
INITIALISATIONFIXINO REFERENCE POINTSFOR OATA COLLECTION ANDBLOCK PROCESSING ANDCLEARING OATA SPACE.SIGNAL PROCESSINGPROGRAMENTER CONTROLWORO. SET MASKPUT INTERRUPT ONFOR AOCDECISION MAKINGROUTINESSAVE ACCUMULATOR,CARRYAND MQR-REGISTERSVESAOC SERVICE ROUTINEFOR OATA COLLECTIONATA COLLECTION2VCREOR» OATA COLLECTION[YESSET ADCMASK0PUTINTERRUPT QNINDICATES THAT CHECKING TAKES PLACE M THE BACKGROUND M M 0 R A M N R NEXT OATA BUNKDtAGONOSTK ROUTINES ARC ALSO EXECUTED.ON-LINE SYSTEM (FLOW CHART)FIG-2
FIG.3-L0NG PERIOD NOISE.
FIG.A-SEISMIC SIGNALS
I-2SEC411904752i' 1306753i'. -2004754i20.0476FlG-5SOME OF THE WEAK SIGNALS DETECTED BY COMPUTER-
where A lib degrees (l o« 111 Kms) i. e. the angle subtended by the source and the receiver at the centre of the earth. With the help of equations (1) and (2), source could be located using the following relations x« Arc Cos (Cos o Cos A Sin « Sin A Cos Z) (4a) y Arc Cot (Sine Cos A Cosecz'-Cos e CotZ) 4 0 (4b)