Transcription
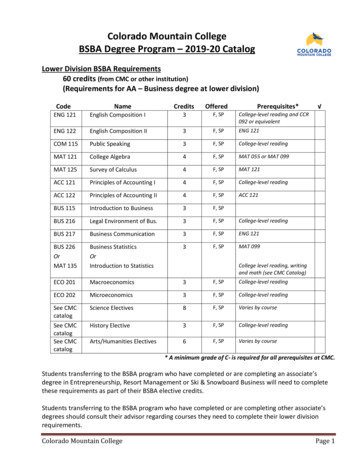
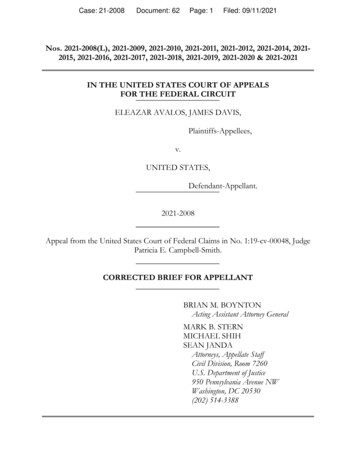
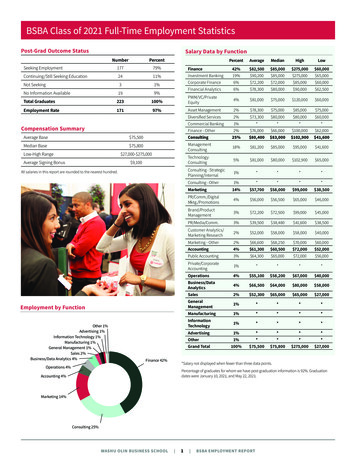
BSBA Class of 2021 Full-Time Employment StatisticsPost-Grad Outcome StatusSalary Data by FunctionNumberPercentSeeking Employment17779%Continuing/Still Seeking Education2411%Not Seeking31%No Information Available199%Total Graduates223Employment Rate171PercentAverageMedianHighLowFinance42% 82,500 85,000 275,000 60,000Investment Banking19% 90,200 85,000 275,000 65,000Corporate Finance6% 72,200 72,000 85,000 60,000Financial Analytics6% 78,300 80,000 90,000 62,500100%PWM/VC/PrivateEquity4% 81,000 75,000 120,000 60,00097%Asset Management2% 78,300 75,000 85,000 75,000Diversified Services2% 73,300 80,000 80,000 60,000Compensation SummaryAverage BaseMedian BaseLow-High Range1%****Finance - Other2% 76,000 66,000 100,000 62,000 75,500Consulting25% 80,400 83,000 102,900 41,600 75,800ManagementConsulting18% 81,200 85,000 95,000 41,600TechnologyConsulting5% 81,000 80,000 102,900 65,000Consulting - StrategicPlanning/Internal1%**** 27,000- 275,000Average Signing BonusCommercial Banking 9,100All salaries in this report are rounded to the nearest hundred.Consulting - OtherEmployment by FunctionOther 1%Advertising 1%Information Technology 1%Manufacturing 1%General Management 1%Sales 2%Business/Data Analytics 4%1%****Marketing14% 57,700 58,000 99,000 38,500PR/Comm./DigitalMktg./Promotions4% 56,000 56,500 65,000 46,000Brand/ProductManagement3% 72,200 72,500 99,000 45,000PR/Media/Comm.3% 39,500 38,480 41,600 38,500Customer Analytics/Marketing Research2% 52,000 58,000 58,000 40,000Marketing - Other2% 66,600 68,250 70,000 60,000Accounting4% 61,300 60,500 72,000 52,000Public Accounting3% 64,300 65,000 72,000 % 55,100 58,200 67,000 40,000Business/DataAnalytics4% 66,500 64,000 80,000 58,000Sales2% 52,300 65,000 65,000 ***100% 75,500 75,800 275,000 27,000Grand TotalFinance 42%*Salary not displayed when fewer than three data points.Operations 4%Percentage of graduates for whom we have post-graduation information is 92%. Graduationdates were January 10, 2021, and May 22, 2021.Accounting 4%Marketing 14%Consulting 25%WASHU OLIN BUSINESS SCHOOL 1 BSBA EMPLOYMENT REPORT
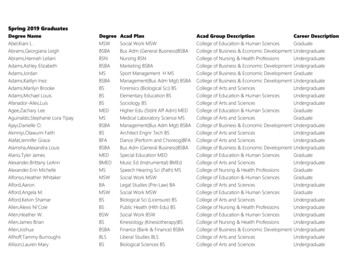
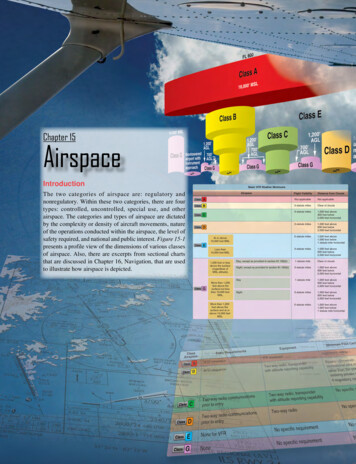
BSBA Class of 2021 Full-Time Employment StatisticsEmployment by IndustrySalary Data by ance43% 82,800 85,000 275,000 57,000Consulting22% 80,400 85,000 95,000 41,600Media/Entertainment12% 48,700 47,000 65,000 27,040Technology5% 79,000 80,000 102,900 60,000Consumer PackagedGoods4% 66,700 67,000 72,000 62,000Accounting4% 67,800 69,000 77,000 56,000Healthcare2% 69,500 70,000 72,000 66,500Retail2%****Nonprofit1%****Transportation andLogistics uring1%****Other1%****100% 75,500 75,800 275,000 27,040Grand TotalGovernment 1%Energy 1%Transportation and Logistics Services 1%Nonprofit 1%Retail 2%Healthcare 2%Accounting 4%Technology 5%Media/Entertainment 12%Consulting 22%Source of Full-Time OfferFamily, Friends Outside Schoolor Previous employer 4%Percentage of graduates for whom we have post-graduation information is 92%. Graduationdates were January 10, 2021, and May 2, 2021Other 3%Alumni, Faculty, Staffor Other Student 7%Company Websiteor Job Board/Social Media 15%Median Salary by RegionMidwest: 70,000West: 81,000Financial/Insurance 43%Consumer PackagedGoods 4%*Salary not displayed when fewer than three data points.Northeast: 80,00012%38%38%6%Mid-Atlantic: 76,500Southwest: 70,0003%South: 65,000On- and Off-Campus Interviews,Career Fair, NetworkingEvents, Job Postings,Resume Collection 20%2%International*: 1%*Salary not displayed when fewer than three data points.WASHU OLIN BUSINESS SCHOOLManufacturing 1%Other 1% 2 BSBA EMPLOYMENT REPORTInternship 51%
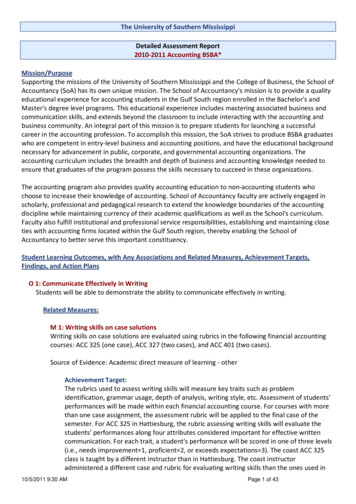
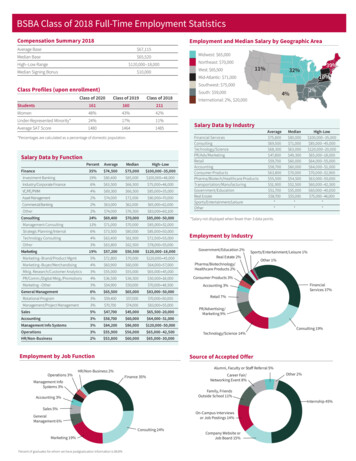
BSBA Class of 2022 Internship StatisticsMonthly Salary DataAverageMedianHigh-Low Range 5,300 5,000 15,000- 700Monthly Salary Data by nt Banking34%14% 5,900 7,100 7,100 10,000 1,700 7,100 7,500 7,100Corporate Finance5% 5,500 5,200 7,100 4,500Venture Capital/PrivateEquity5% 4,400 4,300 7,100 1,700Asset Management4% 5,200 4,300 7,800 3,500Financial Analytics3%****Commercial Banking2%****Finance - Other1%****Consulting23% 6,000 5,800 7,500 4,300Management Consulting18% 6,300 7,100 7,500 4,300Strategic Planning/Internal Consulting3% 5,200 4,600 6,700 4,400Consulting - Other2%**** 6,200 2,400Marketing11% 3,500 3,400Brand/ProductManagement4% 4,400 3,600 6,200 3,500PR/Comm./Digital tomer Analytics/Marketing Research1%****Marketing - Other1%****OperationsSupply ChainManagement6% 7,100 5,100 15,000 3,3004% 4,500 4,300 5,800 3,300Operations - Other2%****6% 4,900 4,800 7,300 2,6005%3% 4,600 4,900 5,000 5,200 3,300 5,000 5,200 4,500Corporate/PrivateAccounting2% 4,300***General Management5% 4,300 4,200 5,400 3,500Business/DataAnalyticsAccountingPublic AccountingSales4% 4,700 4,800 5,800 3,400Aerospace and ing1%****100% 5,300 5,000 15,000 700Grand TotalSource of Internship OfferOther 7%Company Websiteor Job Board 31%Previous Internship 8%Family, FriendsOutside School 12%Alumni/Faculty/Staffor Other Student 13%On- and Off-Campus Interviews,Career Fair, Networking Events, JobPostings, Resume Collection 29%Internship by FunctionInformation Technology 2%Manufacturing 1%Aerospace and Defense 3%Sales 4%General Management 5%Accounting 5%Finance 34%Business/DataAnalytics 6%Operations 6%*Salary not displayed when fewer than three data points.Marketing 11%Consulting 23%WASHU OLIN BUSINESS SCHOOL 3 BSBA EMPLOYMENT REPORT
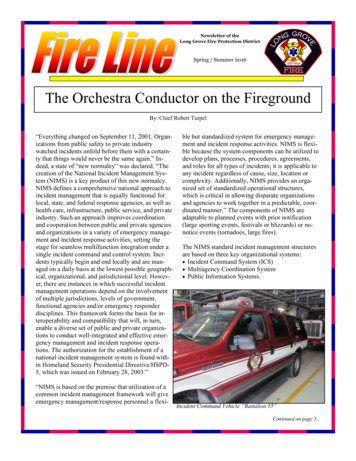
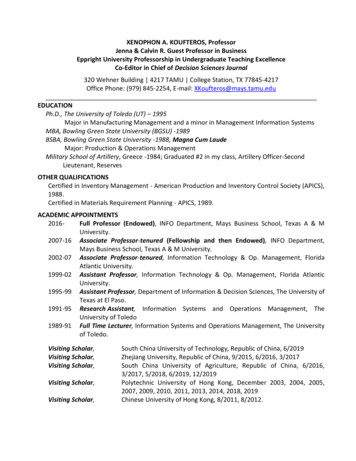
BSBA Class of 2022 Internship StatisticsInternship by IndustryMonthly Salary Data by IndustryPercentAverageMedianHigh40%17% 6,400 7,100 15,000 1,700 6,200 6,500 7,500 4,200Media/Entertainment7% 2,000 2,600 2,600 700Technology6% 4,900 5,000 6,200 3,500Accounting6% 5,100 5,200 5,600 4,500Consumer PackagedGoods5% 3,900 3,600 4,600 3,400Transportation andLogistics Services 4%4% 3,200 3,300 3,600 2,600Consumer PackagedGoods 5%Financial/InsuranceConsultingTransportation andLogistics ****Government2%****Real Estate2%****Energy1%****Hospitality1%****Grand Total100% 5,300 5,000 15,000 700Energy 1%Real Estate 2%Government 2%Healthcare 3%Nonprofit 3%Retail 3%Financial/Insurance40%Accounting 6%Technology 6%Media/Entertainment 7%Consulting 17%*Salary not displayed when fewer than three data points.WASHU OLIN BUSINESS SCHOOLHospitality 1% 4 BSBA EMPLOYMENT REPORT
Organizations That Hired Olin Students for Full-Time or Internship Positions3Q Digital8VCAbbVieAbercrombie & Fitch Co.Accenture*AIGAlphaSights*Alvarez & MarsalAmazon Web Services (AWS)American Express Co.Ameriprise Financial, Inc.Analysis Group, Inc.Andersen TaxAnheuser-Busch InbevAnnette Jaffe InteriorsAPCO WorldwideArch GrantsArgand PartnersAscend Venture CapitalAvanadeAvascentAxonBain & Company*Bank of AmericaBank of New York MellonBarclaysBecton DickinsonBerkeley Research Group, LLCBlackRock*Bloomingdale’s*BNP ParibasBNY Mellon*Boston Consulting Group (BCG)Cadence M&A AdvisorsCain BrothersCapital One*Capstone PartnershipCBSCharles SchwabChicago BlackhawksChicago CubsCignaCitadelCitiLazard*Lincoln InternationalLionsgateLippe TaylorLivingston Capital ManagementMacquarie CapitalMariner Wealth AdvisorsMars, Inc.Marsh & McLennan CompaniesMaryville Consulting GroupMastercardMcDonald’sMcKinsey & Company*Merck & Co, Inc.Metis StrategyMicrosoftMidCap FinancialMizuho Financial GroupMoelis & CompanyMorgan Stanley*MTR Corporation LimitedNational Bank of ArizonaNBC Universal MediaNBCUniversal*NielsenIQ*NISA Investment Advisors, LLCNomura Holdings Inc.*Norfolk SouthernOgilvyOmnicellOn DeckOxford FinancePaylocityPerella Weinberg PartnersPricewaterhouseCoopers (PwC)Procter & GambleR.L. Hulett & CompanyRaymond JamesRBC Capital MarketsRed VenturesReebokRothschild & Co.RSM USRUF Boston UniversityCNY GroupConde NastContext TCMCredit Suisse*Crowe*DeloitteDeutsch AdvertisingEdgemont PartnersEdward JonesElevate Sports VenturesEY (Ernst & Young)*Federal Deposit InsuranceCorporation (FDIC)FedExFinancial Technology PartnersFlow TradersFW CookGap Inc.Garnett Station PartnersGE HealthcareGeneral MillsGoldman Sachs*GoogleGraham PartnersGuggenheim PartnersGuidehouse*GYL ResnickHarman InternationalHavasHoulihan LokeyIBMInforma Financial IntelligenceInked SportsInstacartInvenergy LLCJefferies Financial Group*JMI EquityJMP SecuritiesJPMorgan Chase & Co.*K1 Investment ManagementKaiser AssociatesKearny & CompanyKPMG LLP*Kraft Heinz Foods Company*Employers that hired for both full-time jobs and internships.WASHU OLIN BUSINESS SCHOOL 5 BSBA EMPLOYMENT REPORTSalesforce*SelectQuoteSeneca Insurance CompanySeoClaritySierra Nevada CorporationSilicon Valley BankSnackpassSnowflake ComputingSociete GeneraleSompo InternationalSonenshine PartnersSpaceXSt. Louis CardinalsStifelStout Risius RossSumUpSuprTEKSusquehanna International GroupTalos EnergyThe Emerson Electric CompanyThe HSBC GroupThe RealRealThe Riverside CompanyThe Walt Disney CompanyU.S. BankUBSUnited AirlinesVascular Birthmark Instituteof New YorkVictoria’s SecretVisa Inc.VSCWashington Universityin St. Louis*Wasserman Group*William Blair*Willis Towers WatsonWorld Wide TechnologyX-ForceZayo GroupZS Associates*
Asset Management 2% 78,300 75,000 85,000 75,000 . Nonprofit 1% Manufacturing 1% International*: 1% . RUF Boston University Salesforce* SelectQuote Seneca Insurance Company SeoClarity Sierra Nevada Corporation Silicon Valley Bank Snackpass Snowflake Computing Societe Generale