Transcription
Home Mortgage Disclosure Act Report (2008 -2015)Submitted by Jonathan M. Cabral, AICPIntroductionThis report provides a review of the single family (1-to-4 units) mortgage lending activity in Connecticutover 2015. The report also uses historical data to determine any trends in single family lending in thestate using data collected through the Home Mortgage Disclosure Act (HMDA). This report alsocompares HMDA data with the Connecticut Housing Finance Authority’s (CHFA) single family mortgageactivity throughout the state.Home Mortgage Disclosure Act DataThe Home Mortgage Disclosure Act requires many lenders to collect and publicly disclose informationabout housing-related applications and loans. The data that lenders disclose under the HMDAregulation assists in determining: Whether financial institutions are serving the housing needs of their communities.Assists public officials in distributing public-sector investment so as to attract private investmentto areas where it is needed.Assists in identifying possible discriminatory lending patterns and enforcing antidiscriminationstatutes.Home purchase, home improvement, and refinance loans are reported under HMDA. A home purchase loan is any loan secured by and made for the purpose of purchasing adwelling. 1A home improvement loan is any dwelling-secured loan to be used, at least in part, for repairing,rehabilitating, remodeling, or improving the dwelling or the real property on which the dwellingis located, and any non-dwelling-secured loan (i) that is to be used, at least in part, for one ormore of those purposes and (ii) that is classified as a home improvement loan by the lendinginstitution.Refinancing is any dwelling-secured loan that replaces and satisfies another dwelling-securedloan to the same borrower. The purpose of the loan being refinanced is not relevant todetermining whether the new loan is a refinancing for HMDA purposes. Nor is the borrower'sintended use of any additional cash borrowed relevant to determining whether the loan is arefinancing, though the borrower's intended use of the funds could make the transaction ahome improvement loan or a home purchase loan.1Dwellings are residential structures, whether or not attached to real property. Includes vacation homes orsecond homes and rental properties; multifamily as well as one-to-four family structures, individual condominiumsand cooperative units, and manufactured and mobile homes. It excludes recreational vehicles and transitoryresidences such as hotels, hospitals, and college dormitories.October 2017Planning Research & Evaluation1 P a g e
Every loan application, origination, and purchase that meets those three purposes are reported by thelending institution. The following data is reported by the lender: The type of loan and its purpose (a home purchase, home improvement, refinance).The property type and where it is located.The disposition of the application, whether it was originated, denied, or withdrawn.The applicant characteristics, including race, ethnicity, sex, and income.Both depository and non-depository institutions are required to report HMDA once they meet certainthresholds. Those thresholds are based on, but are not limited to, the type of lender, institutions assetsize, presence of a home or branch office in certain geographies, the number and dollar amount of loansoriginated, and the type of loans that are originated. An institution reports its HMDA data by March 1stto the (FFIEC).In 2015, there were 14.4 million HMDA records from 6,913 financial institutions.2Connecticut OverviewIn 2015, there were 670 lenders who reported data on 132,491 home mortgage applications inConnecticut. Roughly 52 percent of these loan applications resulted in an originated loan, or 68,865total loans, totaling nearly 20.8 billion. Although this is an increase of nearly 17.8 percent over theprevious year, it is still well below 2007 levels, when there were 126,259 home mortgage originations inthe state. The increase in loan originations between 2014 and 2015 is a national trend, where there wasan increase of 1,364,432 originations (roughly a 22.6 percent increase). The number of reportinginstitutions in Connecticut has varied over the years, with a noticeable decline after the financial crisis of2007 and 2008. There has been a noticeable rebound in lenders in 2015 however total lending activity isstill down. In fact the lowest total number of loan applications and home mortgage loans occurred in2014, seven years after the financial and home mortgage crisis. Starting in 2009 as interest rates beganto decline to record lows; the home mortgage business was primarily fueled by refinance business.Those homeowners who had the ability and equity to refinance their properties did so in order to takeadvantage of the lower interest rates. Refinances business jumped 82.5 percent between 2008 and2009, peaking in 2012 with 82,915 refinance loans reported in Connecticut. In 2012, 71.9 percent of thehome mortgage business was driven by home refinance lending compared to the more typical 50.7percent in 2008.2Consumer Financial Protection BureauOctober 2017Planning Research & Evaluation2 P a g e
Table 1. Number of Reporting Institutions, Total Number of Applications and Originations and DollarValue of All Loans Originated by Year, 2008-2015, 42015Number ber 87,158112,576132,491Number 98,73957,67568,865Dollar Value3of LoansOriginated 21,452,568 28,923,587 27,636,641 23,882,215 31,280,977 27,057,887 16,802,208 20,763,668In 2015, home purchase lending returned to 2008 levels, totaling 32,412 home mortgage purchase loansfor the year. The average home purchase loan for the state was 316,081 in 2015. The average homepurchase loan has been on a steady increase since 2009, increasing 25.6 percent between 2009 and2015. The increase in the average home purchase loan does not correspond with home prices duringthe same period of time. Between 2009 and 2015 home prices fell 7.5 percent.4Quicken Loans, a mortgage company originated the most home mortgage loans in Connecticut, makingup nearly 5.5 percent of the total market followed by Wells Fargo Bank at 5.1 percent of the market.Webster Bank was the largest Connecticut based bank in regards to market share and ranked third witha 4.1 percent market share. Based on total dollars, Wells Fargo followed by JP Morgan Case ranked firstand second in total dollars lent at 1,382,421,000 and 1,154,840,000 respectively.Connecticut’s top 23 lenders originated just over 50 percent of the home mortgage loans in the state in2015. Wells Fargo Bank is consistently one of the top home mortgage lenders in Connecticut, rankingfirst between 2009 and 2014 in both number of loans originated and in total dollars. AmongConnecticut based lenders, Both Webster Bank and People’s United Bank (the largest local banks) areconsistently ranked among the top ten lenders with the locally based mortgage company, NorwichCommercial Group (NORCOM), becoming a top ten lender in 2013. Prior to the home mortgage crisis,Countrywide Bank operated in Connecticut and was the largest home mortgage lender in 2008,originating nearly 6 percent of the state’s lending before it was acquired by Bank of American in 2008.Home Mortgage Purpose BreakdownBased on the 2015 HMDA data, there was 131,566 home purchase, refinancing, and home improvementloan applications for one- to four-family dwellings submitted to lenders in Connecticut. During the same34Nominal dollar valueFederal Reserve Bank of St. LouisOctober 2017Planning Research & Evaluation3 P a g e
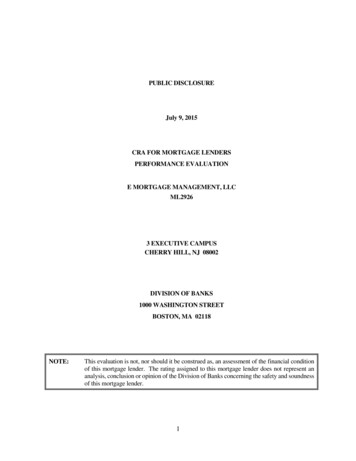
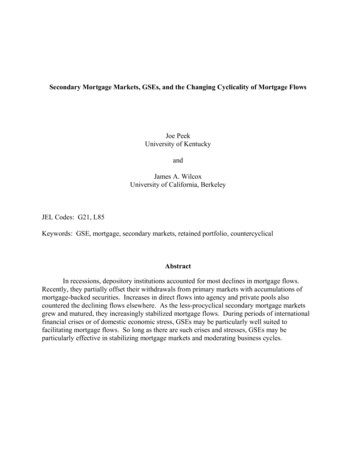
year, there were an additional 572 loan applications for multifamily dwellings5 and 353 applications formanufactured homes.The sharp decline since 2012 in applications and originations is mostly due to the decline in homerefinancing activity. Since the home mortgage and financial crisis in 2008, a significantly higherproportion of all loans originated, particularly for one- to four-family dwellings were for the purpose ofrefinance rather than home purchases. Only until the last couple of years have we seen home purchaseloans out number refinance loans. In 2014, home purchase lending outnumbered refinance loans whilein 2015 there was almost an equal amount of home purchase loans as there were refinance loans (seeFigure 1). As mentioned above, in the years following the home mortgage and financial crisis, fallinginterest rates encouraged home owners who still had equity in their homes to refinance their previouslyhigh interest rate loans. Refinance loans began to outnumber home purchase during this period.Figure 2. Number of Mortgage Loans Originated, 1-4 Family Dwellings, 2007-2015, Connecticut# of Loans Originated, 1-4 ,00010,000200720082009Home Purchase Loans201020112012Home Improvement Loans201320142015Refinance LoansWhile applications and total originations are trending down over the last couple of years, the number ofhome purchases has been on a slow but steady rise. The trend upward in home purchases lending hascontinued since 2011 and in 2015 has reached 2008 levels. These trends follow the nation as a wholewhere refinance lending for one- to four-family homes has declined by 54 percent between 2012 and2013.5Multifamily dwellings – housing five or more familiesOctober 2017Planning Research & Evaluation4 P a g e
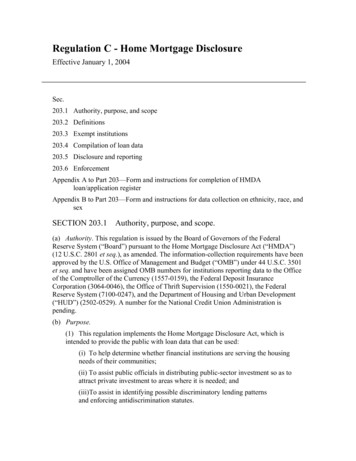
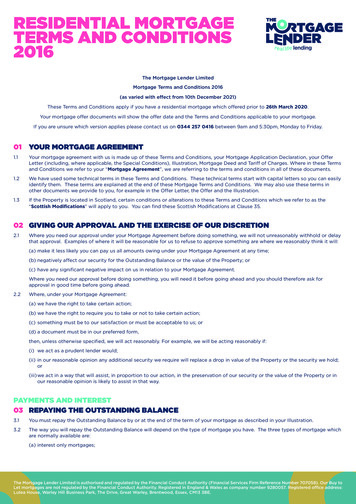
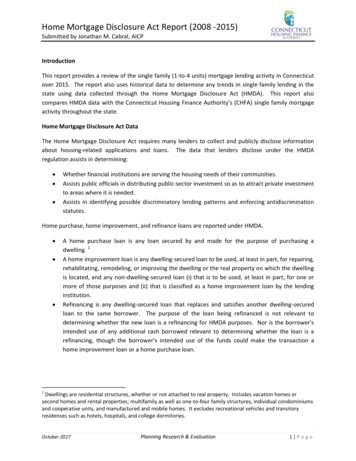
Figure 2. Percent of Home Purchase and Refinance Mortgage Loan Originations in Total LoanOriginations, 1-4 Family Dwellings, 2007-2015, 02011Home Purchase Loans2012201320142015Refinance LoansRefinance lending first peaked in 2009 after the home mortgage and financial crisis. The jump in 2009may have been as a result of historically low interest rates and the Home Affordable Refinance Program(HARP) that started in March 2009.6 The peak in refinance loan origination in Connecticut was in 2012,with 72 percent of home mortgage lending comprised of refinance loans. As a percentage of homemortgage lending, refinance lending remained fairly steady between 2009 and 2012; with activitydeclining since 2013 (see Figure 2).Multifamily lending in Connecticut suffered a significant decline during the home mortgage and financialcrisis in 2008, declining 75.6 percent between 2007 and 2009. Multifamily home purchase lending byitself declined nearly 81.4 percent during the same period. However, since 2010 multifamily lending hasbeen on a steady rise up, and by 2015 Connecticut has seen multifamily home purchases recover to2007 levels.6Fewer Applications, Falling Denials Rates HMDA Data Report – Hulya Arik, Tennessee Housing DevelopmentAgencyOctober 2017Planning Research & Evaluation5 P a g e
Table 2. Home Purchase Loans Originated for Owner-Occupied 1-4 Family Dwellings, 2008-2015,County and StateFairfieldHartfordLitchfieldMiddlesexNew HavenNew 2,2331,2731,0412015Originationsas % of .8%As a whole, Connecticut’s recovery has been slow, but not unlike the rest of the United States. Homepurchase originations for owner-occupied 1-4 family dwellings in 2015 has just now reached andsurpassed 2008 levels (see table 2). However, not all places have recovered or recovered at the samerate. New Haven, Hartford, and Middlesex counties have yet to reach 2008 lending levels, whileLitchfield, Tolland, New London, Fairfield, and Windham counties have all surpassed 2008 lendingactivity. Although Windham County has surpassed 2008 lending levels, it was Fairfield that had thequickest recover and stabilization starting in 2013.Table 3. Refinance Loans Originated for Owner-Occupied 1-4 Family Dwellings, 2008-2015, County andStateFairfieldHartfordLitchfieldMiddlesexNew HavenNew as % of 85771.0%Refinance lending has dropped significantly in 2014 and 2015. Although as a state refinance loans are71 percent of what they were in 2008, there is some significant variance between the state’s counties.October 2017Planning Research & Evaluation6 P a g e
Windham County had the least growth in refinance loans for owner-occupied 1-4 family dwellings in thestate, only seeing 42 percent increase in activity between 2008 and 2012, while Fairfield County sawincreases over 126.9 percent between the same period (see table 3). New Haven County activity is thelowest in the state when comparing 2015 to 2008, however Tolland County has had the biggest dropfrom its peak in 2012 and 2015, roughly a 65.7 percent drop in activity.Between 2008 and 2015, there has been a noticeable shift in the type of lender that is originating homemortgage loans in Connecticut. Although home purchase lending for one- to four-family dwellings hasrecovered to 2008, mortgage companies and credit unions have seen their activity grow substantiallysince 2008. Credit union home purchase lending for owner-occupied, one- to four-family dwellings hasincreased by over 42.7 percent between 2008 and 2015. Mortgage companies have seen lendingactivity increase by 59.2 percent over the same period. On the other hand, banks and thrifts have yet torecover to 2008 highs with lending activity down 27.4 percent between 2008 and 2015 (table 4).Table 4. Number of Home Purchase Loans Originated for Owner-Occupied, 1-4 Family Dwellings byLender Type, 2008-2015, ConnecticutBanks/ThriftsCredit UnionsMortgage 34629,934Conventional Versus Government-Insured LoansThe table below (table 5) breaks down loans originated for owner-occupied one- to four-family dwellingsby loan type. In 2015, 69.2 percent of all home purchase loans originated for one- to four-family owneroccupied homes were conventional, while 23.8 percent were Federal Housing Administration (FHA)insured, 5 percent were insured by the Veterans Administration (VA), and 2 percent were Farm ServicesAgency/Rural Housing Services (FSA/RHS)-insured. FHA loans for home purchased loans for owneroccupied one to four-family dwellings jumped just after the home mortgage and financial crash between2008 and 2009, but has dropped to below 2008 levels in 2013.Table 5. Loans Originated for Owner-Occupied 1-4 Family Dwellings, 2008-2015, ConnecticutHomePurchase LoansTotal # of LoansOriginatedConventionalFHAVAFSA/RHSOctober 2.7%29,93469.2%23.8%5.0%2.0%Planning Research & Evaluation7 P a g e
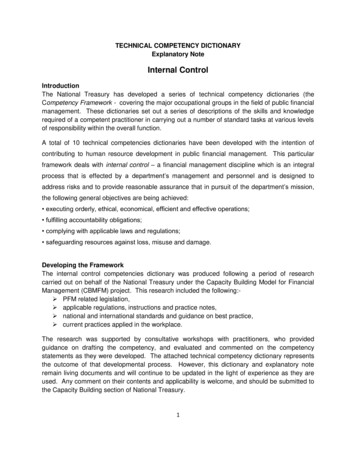
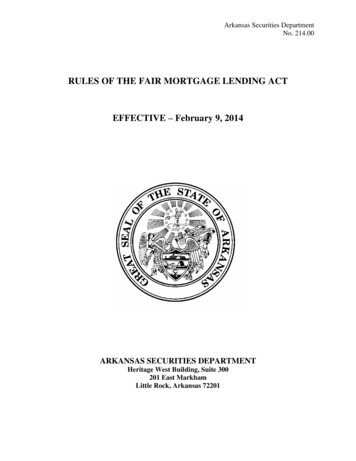
Refinance LoansTotal # of 1%28,85781.6%14.1%4.1%0.1%The drop in FHA loans has been mostly absorbed by conventional lending. The shift away from FHA toconventional lending may be as a result of new FHA mortgage insurance premium policies. In mid-2013,FHA required mortgage insurance for the life of the loan if the mortgage is greater than 90 percent loanto-value at the time of origination.7 This was a significant change from the practice of automaticallycancelling mortgage insurance premiums once a loan reached a 78 percent loan-to- value.The change in FHA’s mortgage insurance premium policies added cost to borrowers looking to purchaseusing a FHA mortgage product. Conventional mortgages became a more attractive option for borrowerswho qualified.Figure 3. Share of Conventional Loans in Home Purchase and Refinance Mortgage Loan Originations inTotal Loan Originations, 1-4 Family Dwellings, 2007-2015, Connecticut100%Percent of Loans Originated90%80%70%60%50%40%2008200920102011Home Purchased Loans2012201320142015Refinance LoansIn any given year between 2008 and 2015, a higher percentage of refinance loans than home purchaseloans were conventional (see figure 3). Conventional refinance loans for owner-occupied one- to fourfamily dwellings reached its lowest point in 2015, but still make up 81.6 percent of the total lending.7U.S. Department of Housing and Urban Development – Mortgage Letter 2013-04 (January 31, 2013)October 2017Planning Research & Evaluation8 P a g e
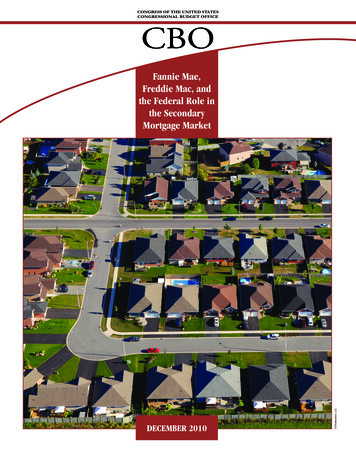
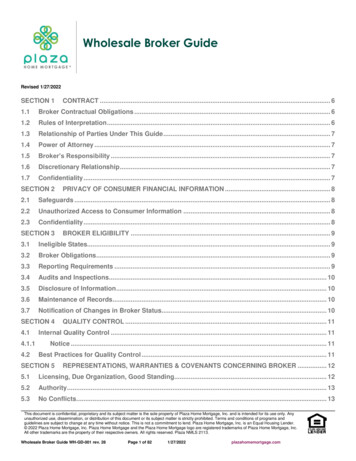
Notably, VA lending has been on a steady increase in Connecticut. VA home purchase loans for owneroccupied one- to- four family dwellings increased from 547 loans in 2008 to 1,503 loans in 2015, whilerefinance loans, increasing from a mere 58 loans in 2008 to 1,191 loans in 2015.Mortgage Loans for Non-Owner-Occupied BorrowersWhen reporting HMDA, lenders not only report on applications and loans made to owner-occupants,they also report on non-owner-occupied dwellings, including rental properties, second homes, andvacation homes. The number of non-owner-occupied home purchase lending was significantly higher inConnecticut prior to the home mortgage and financial crisis and was at its lowest just after it. Althoughpurchases for non-owner-occupied homes have steadily increased since 2009, they are still well below2007 levels. 2015 purchase lending has only recovered to about 59.6 percent of 2008 activity. Giventhe nature of the non-owner-occupied industry, lending activity may not fully or accurately measurenon-owner-occupant purchasing activity due to the fact that HMDA only captures lending activity. Manyproperty investors may choose to purchase a property using their own equity or may have to rely onhard cash lenders, who are often times not required to report their lending activity via the HomeMortgage Disclosure Act.Figure 4. Mortgages Originated for non-Owner-Occupied Dwellings, 2007-2015, ConnecticutNumber of Loans 1,0005002007200820092010Home Purchase Loans20112012201320142015Refinance LoansAfter the home mortgage and financial crisis, the majority of lending activity to non-owner-occupieddwellings was not for purchases but for refinancing. Refinance lending activity jumped significantly in2012 and peaked in 2013 (see figure 4). In 2012 and 2013, there was double the amount of refinanceloans originated than there were for home purchase loans for non-owner-occupied dwellings. The yearsfollowing the refinance peak, the number of home purchase loans and refinance loans for non-owneroccupied dwellings has been nearly even.October 2017Planning Research & Evaluation9 P a g e
Applicant Income and Loan AmountsHMDA requires lenders report the loan amounts requested and the applicant’s income that isconsidered in making the underwriting decision. Income isn’t always reported or required in thefollowing cases: The institution does not take the applicant’s income into account for underwriting.The loan or application is for a multifamily dwelling.The transaction is a loan purchase and the lender chooses not to collect the information.The transaction is a loan to, or application from, an employee of the financial institution, andthe institution seeks to protect the employee’s privacy, even when the income was used forunderwriting the loan.The borrower or applicant is a corporation, partnership, or other entity that is not a naturalperson.8In 2015, only about 6.5 percent of loans originated for owner-occupied one- to four-family dwellings inConnecticut did not have an income provided. However, the majority of missing income data was forrefinance loans, only about 1 percent of home purchase loans did not have an income associated withthe loan.The table below (table 6) looks at home purchase lending for owner-occupied, one- to four-familydwellings based on the borrowers characteristics. Based on the data, there have been slight shifts inborrower characteristics over 2008 and 2015. The share of loans to Hispanic/Latino borrowers hasgrown between 2008 and 2015, accounting for 7.3 percent of home purchase loans for owner-occupiedone- to four-family dwellings. There also appears to be a trend of fewer joint applications among maleand female borrowers. The share of male only borrowers has grown by 4.2 percent between 2008 and2015 while female only borrowers has grown by 1.7 percent over the same period of time.Table 6. Borrower Characteristics for Home Purchase Loans Originated for Owner-Occupied 1-4 FamilyDwellings, 2008-2015, ConnecticutBorrower RaceNativeAsianBlack or African AmericanPac. IslandWhite2 or More MinorityJointNot Applicable2008 2009 2010 2011 2012 2013 2014 20150.2% 0.1% 0.2%0.2% 0.2% 0.2% 0.1% 0.2%4.1% 4.1% 4.5%4.1% 4.3% 4.3% 4.6% 4.1%5.4% 4.7% 5.4%4.7% 4.2% 4.4% 4.9% 5.5%0.2% 0.2% 0.2%0.2% 0.2% 0.2% 0.2% 0.2%79.6% 80.6% 79.6% 80.3% 79.3% 80.9% 80.9% 80.6%0.1% 0.0% 0.0%0.0% 0.0% 0.1% 0.1% 0.1%1.4% 1.4% 1.4%1.6% 1.5% 1.5% 1.4% 1.7%9.1% 8.9% 8.7%8.9% 10.3% 8.6% 7.8% 7.5%8Federal Financial Institutions Examination Council – Guide to HMDA Reporting: Getting it Right (Edition effectiveJanuary 1, 2013)October 2017Planning Research & Evaluation10 P a g e
Borrower EthnicityHispanic or LatinoNot Hispanic or LatinoJointMissing and/or NAGenderJointMaleFemaleNot ApplicableBorrower Income9Low Income ( 50%)Moderate Income (50% 80%)Middle Income (80% 120%)High Income ( 120%)Not Available5.9% 5.7% 5.9%5.7% 5.5% 5.7% 6.5% 7.3%83.7% 83.9% 83.9% 84.0% 85.6% 84.1% 84.4% 83.7%1.5% 1.4% 1.5%1.5% 1.4% 1.6% 1.5% 1.7%8.9% 8.9% 8.7%8.8% 7.5% 8.5% 7.6% 7.3%43.5% 40.5% 40.4% 40.5% 40.7% 39.9% 39.8% 38.5%29.1% 31.0% 30.5% 30.6% 31.3% 32.4% 33.0% 33.3%22.2% 23.4% 23.7% 23.3% 23.1% 22.3% 22.5% 23.9%5.2% 5.1% 5.5%5.6% 4.9% 5.4% 4.7% 2.6% 9.1% 9.0% 9.9%28.2% 26.5% 25.8% 26.8%23.5% 24.4% 24.7% 25.4%34.5% 38.9% 39.5% 36.9%1.1% 1.1% 1.0% 1.0%Additionally, the share of loans to low income borrowers has grown since 2008. In 2012, 12.6 percent ofborrowers earned less than 50 percent of their Area Median Income (AMI). Although there’s been adrop since 2012, the percentage of loans to low income borrows is has held higher than in 2008. Mostinteresting is the drop off in loans made to middle income borrowers since 2008. While loans to lowincome borrowers peaked in 2012, loans to middle income borrowers hit its lowest level in the sameyear. In 2015, a just over a quarter of home purchase loans for owner-occupied, one- to four-familydwellings were made to middle income borrowers, still below 2008 levels.Denial Rates and Denial ReasonsLenders that report HMDA are also required to report applications that are denied and the reasons forthe denial. The reasons for denial include, poor debt-to-income ratio, employment history, credithistory, collateral (loan-to-value of collateral), insufficient cash (for downpayment or closing costs),mortgage insurance denied, and bad data from the applicant or credit application is incomplete.Lenders may report up to three denial reason on any one loan application.The following table (table 7), shows the variations in denial rates across different borrowercharacteristics, including race, ethnicity, gender, and income. The denial rate for home purchase loansfor owner-occupied, one- to four-family dwellings has dropped since 2008 and reached its lowest levelsin 2015, 7.8 percent for all applicants.9Based on Area Median Income of the Metropolitan Statistical Area (MSA) or Metropolitan Division in which theproperty is located.October 2017Planning Research & Evaluation11 P a g e
Table 7. Denial Rates of Home Purchase Loans for Owner-Occupied 1-4 Family Dwellings, 2008-2015,ConnecticutBorrower RaceNativeAsianBlack/African AmericanPac. IslandWhite2 or More MinorityJointNot ApplicableBorrower EthnicityHispanic or LatinoNot Hispanic or LatinoJointMissing and/or NAGenderJointMaleFemaleNot ApplicableBorrower IncomeLow Income ( 50%)Moderate Income (50% 80%)Middle Income (80% 120%)High Income ( 120%)Not AvailableAll .5%10.7%16.8%20.0%8.2%23.4%7.3%3.5%20.3% 15.3% 15.9% 15.4% 15.4% 16.7% 16.3% 14.7%10.5% 8.8% 8.8%8.9% 8.7% 9.1% 9.1% 8.5%12.2% 9.3% 11.0%8.3% 9.5% 8.5% 9.6% 6.8%6.8% 4.1% 6.7%4.7% 6.7% 4.9% 4.5% 3.1%6.5% 7.8% 7.6%7.3% 7.5% 7.8% 7.8% 6.9%7.7% 10.9% 11.0% 11.2% 10.7% 11.2% 11.3% 10.3%7.0% 10.0% 10.5% 10.7% 10.1% 11.1% 11.3% 10.5%4.0% 2.8% 5.2%3.3% 5.8% 3.2% 3.0% 2.2%21.6% 16.3% 18.1% 17.1% 16.8% 19.2% 19.8% 17.7%13.0% 8.8% 9.8%9.9% 9.6% 10.1% 11.1% 10.2%10.3% 7.5% 7.6%7.5% 7.8% 8.2% 8.6% 7.2%8.6% 6.5% 6.9%5.9% 7.4% 6.4% 6.4% 5.6%2.4% 2.9% 3.0%2.9% 1.4% 3.2% 1.5% 1.2%10.5% 8.1% 8.9% 8.5% 8.7% 8.7% 8.6% 7.8%However, the denial rate varies significantly between different race and income characteristics. Forexample, the denial rate for whites and joint applicants is significantly lower than every other minoritygroup. Native and Black/African Americans have double the denial rates than whites in most yearsbetween 2008 and 2015. Although the denial rate for low-income applicants decreased significantlybetween 2008 and 2009, it has trended upwards since 2009. Nearly one out of five low-incomeapplicants looking for a home purchase loans for owner-occupied, one- to four-family dwelling wasdenied in 2013 and 2014.The rate of denials to two or more minority varies substantially year to year. However this may be inpart due to the number of few applications received under this category, which can be as low as ninetotal applications (2010).October 2017Planning Research & Evaluation12 P a g e
Table 8. Denial Reasons of Home Purchase Loans for Owner-Occupied 1-4 Family Dwellings, 2015,ConnecticutDebt-to-Income RatioEmployment HistoryCredit HistoryCollateralCash, PMI, Bad DataOtherAll Denied (# of Applicants)Low-Income Moderate-Income Middle-Income %29.6%13.6%27.2%14.8%88681Lenders that report HMDA can report up to three reasons for a denial. The above table (table 8)represents the denial reasons by an applicant’s AMI based on 2015 HMDA data. In 2015, among theapplicants looking to obtain a home purchase loan for an owner-occupied, one- to four-family dwelling,the debt-to-income ratio and credit history were the top two reasons for denial. Nearly half of lowincome applicants that get denied are denied for their debt-to-income. Notably, about one in fivemiddle income applicants who are denied are denied due to their credit score, the number one reasonfor middle-income applicants to be denied.Different lending products have their own limits when it comes to debt-to-income or credit scores. Forexample an applicant is required to have a FICO score of 580 or higher to qualify for the low downpayment advantage of 3.5 percent. For applicants with a lower than 580 FICO score, a 10 percent downpayment is required. The higher down payment requirement may act as a barrier with a lower creditscore. An additional barrier to homebuyers is debt-to-income. Higher debt-to-income ratios have beenshown to be more likely to run into issues in regards to making monthly payments. Generally, a 43percent debt-to-income ratio is the highest ratio a borrower can have and still get qualified for a homepurchase mortgage.10CHFA Home Purchase Loans versus the MarketThe measure of CHFA’s share in the home loan market is important to determine how competitiveCHFA’s loan products are and to determine gaps in the home purchase market that CHFA may be able tofill. Using HMDA data to measure CHFA’s market share in the home purchase loan market present someissues because of the nature of HMDA data and CHFA’s loan program eligibility requirements. One suchissue is that not all of CHFA’s participating lenders report their home lending activity under the HMDAregulation. Additionally, CHFA eligibility is subject to income and purchase price limits that do not easilymatch AMI bands used in HMDA reporting. CHFA programs are also limited to first-time homebuyerswith the exception of targeted areas, mostly found in the low-income communities. HMDA does notcollect data on whether a borrower is a first-time homebuyer. Due to these limitations, using HMDA to10Consumer Financial Protection Bureau* Source: Federal Reserve Economic Data (FRED) St. Louis FedOctober 2017Planning Research & Evaluation13 P a g e
conduct market share reports, will likely result in under/overestimates of CHFA products in the market.With that said, it is still a useful c
Refinance lending first peaked in 2009 after the home mortgage and financial crisis. The jump in 2009 may have been as a result of historically low interest rates and the Home Affordable Refinance Program (HARP) that started in March 2009.6 The peak in refinance loan origination in Connecticut was in 2012,