Transcription
Earthquake Hazards Ground Motion InvestigationsP- and S-wave Velocity Models Incorporating theCascadia Subduction Zone for 3D EarthquakeGround Motion Simulations, Version 1.6—Update forOpen-File Report 2007–1348Open-File Report 2017–1152Version 1.1, September 2019Supersedes USGS Open-File Report 2007–1348U.S. Department of the InteriorU.S. Geological Survey
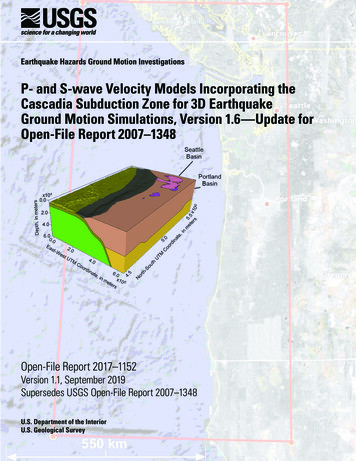
Cover. Base image is from figure 1, this report, and is the region of velocity models described in this report. Geologic model volumeincluding the Cascadia subduction zone is from figure 3, this report.
P- and S-wave Velocity ModelsIncorporating the Cascadia SubductionZone for 3D Earthquake Ground MotionSimulations, Version 1.6—Update forOpen-File Report 2007–1348By William J. Stephenson, Nadine G. Reitman, and Stephen J. AngsterEarthquake Hazards Ground Motion InvestigationsOpen-File Report 2017–1152Version 1.1, September 2019Supersedes USGS Open-File Report 2007–1348U.S. Department of the InteriorU.S. Geological Survey
U.S. Department of the InteriorRYAN K. ZINKE, SecretaryU.S. Geological SurveyWilliam H. Werkheiser, Deputy Directorexercising the authority of the DirectorU.S. Geological Survey, Reston, Virginia: 2017First release: 2017Revised: September 10, 2019 (ver. 1.1)Supersedes USGS Open-File Report 2007–1348For more information on the USGS—the Federal source for science about the Earth, its natural and livingresources, natural hazards, and the environment—visit https://www.usgs.gov or call 1–888–ASK–USGS.For an overview of USGS information products, including maps, imagery, and publications,visit https://store.usgs.gov.Any use of trade, firm, or product names is for descriptive purposes only and does not imply endorsement by theU.S. Government.Although this information product, for the most part, is in the public domain, it also may contain copyrighted materialsas noted in the text. Permission to reproduce copyrighted items must be secured from the copyright owner.Suggested citation:Stephenson, W.J., Reitman, N.G., and Angster, S.J., 2017, P- and S-wave velocity models incorporating the Cascadiasubduction zone for 3D earthquake ground motion simulations, version 1.6—Update for Open-File Report 2007–1348(ver. 1,1, Sept. 10, 2019): U.S. Geological Survey Open-File Report 2017–1152, 17 p., https://doi.org/10.3133/ofr20171152. [Supersedes USGS Open-File Report 2007–1348.]ScienceBase data release available at https://doi.org/10.5066/F7NS0SWMISSN 2331-1258 (online)
iiiAcknowledgmentsThe VP and VS property volumes of model V1.6 were greatly improved by feedback fromend-users including Art Frankel (U.S. Geological Survey [USGS]), Andy Delorey (Los AlamosNational Laboratory), and John Vidale (University of Washington). We thank Jack Odum andRobert Williams (USGS) for their technical reviews, which greatly improved this manuscript.Special thanks to Jordan Bretthauer (USGS) for assistance in developing figure 1 of this report.Discussions with numerous collaborators and other interested parties seeking components ofthe model for their research helped prompt us to formally complete this updated documentation.This research was supported by funding from the USGS Earthquake Hazards Program.
nd.1Investigations Using Model V1.3.3Primary Differences Between Models V1.3 and V1.6.3The Primary Geology-Based Model Units and Their Velocity Properties.4Continental Sedimentary Basins.4Continental Crust.8Continental Mantle.8Oceanic Sediment.8Oceanic Crust.8Oceanic Mantle.8Discussion.9Summary.15References Cited.15Figures1. Map showing region of velocity models described in this report.22. Contour map of Cascadia subducting slab upper surface in model region.33. Geologic model volume including the Cascadia subduction zone.54. Horizontal subsections through Cascadia model V1.6.65. Sliced view of Puget Lowland with Seattle basin.76. East-west slices through VS model, spaced every 200 kilometers.107. VS horizontal model slices at 9,000 meter (m) to 45,000 m depth intervals, spacedevery 9,000 m.118. East-west slices through VP model, spaced every 200 kilometers.129. VP horizontal model slices at 9,000 meter (m) to 45,000 m depth intervals, spacedevery 9,000 m.1310. VP / VS horizontal model slices from 0 meter (m) to 45,000 m depth, spaced every9,000 m.14
viConversion FactorsInternational System of Units to U.S. customary unitsMultiplyByTo obtainLengthcentimeter (cm)0.3937inch (in.)meter (m)3.281foot (ft)kilometer (km)0.6214mile (mi)Densitygram per cubic centimeter (g/cm )362.4220pound per cubic foot (lb/ft3)
P- and S-wave Velocity Models Incorporating theCascadia Subduction Zone for 3D EarthquakeGround Motion Simulations—Update forOpen-File Report 2007–1348Version 1.6By William J. Stephenson,1 Nadine G. Reitman,2 and Stephen J. Angster3IntroductionIn support of earthquake hazards studies and groundmotion simulations in the Pacific Northwest, threedimensional (3D) P- and S-wave velocity (VP and VS ,respectively) models incorporating the Cascadia subductionzone were previously developed for the region encompassedfrom about 40.2 N. to 50 N. latitude, and from about 122 W.to 129 W. longitude (fig. 1). This report describes updates tothe Cascadia velocity property volumes of model version 1.3([V1.3]; Stephenson, 2007), herein called model version 1.6(V1.6). As in model V1.3, the updated V1.6 model volumeincludes depths from 0 kilometers (km) (mean sea level) to60 km, and it is intended to be a reference for researcherswho have used, or are planning to use, this model in theirearth science investigations. To this end, it is intended thatthe VP and VS property volumes of model V1.6 will beconsidered a template for a community velocity model ofthe Cascadia region as additional results become available.With the recent and ongoing development of the NationalCrustal Model (NCM; Boyd and Shah, 2016), we envision anyfuture versions of this model will be directly integrated withthat effort.BackgroundThe Cascadia subduction zone stretches for over1,000 km, from the Mendocino Triple Junction off thenorthern California coast northward to Vancouver Island,U.S. Geological Survey.1University of Colorado Boulder, Boulder, Colo.2University of Nevada, Reno, Nev.3Canada (fig. 2). The primary reasons for developing thesemodel volumes are (1) for simulating strong earthquakeground motions in the urbanized sedimentary basins ofwestern Washington and Oregon, and (2) for simulatingtsunami effects from a great (moment magnitude [M] 8–9)Cascadia subduction zone earthquake. As such, these aregeophysical property models constrained by first-ordergeologic boundaries only. We do not attempt to explicitlyrepresent detailed geologic terranes in the model volumeunless they were deemed important for ground motionvariability in urbanized regions. Thus, unique terranes withinthe continental crust, such as Siletz (see Trehu and others,1994) or Wrangellia (Jones and others, 1977) are not treatedas unique units within the model; however, their effects onground motions are essentially represented through the useof passive- and active-source tomographic imaging results.Similarly, serpentinized mantle (for example, Bostock andothers, 2002) is not explicitly included, but its existence canbe partially inferred from the VS and VP property data.The P- and S-velocity volumes of model V1.6 weredeveloped with EarthVision software, version. 9.0, on theLinux operating system. Matlab version R2015b was used forcarrying out quality-control of the model volumes output inInstitute of Electrical and Electronics Engineers, Incorporated(IEEE) binary format from EarthVision. While a wealthof published information for the Cascadia region has beenincorporated in the development of these models, significantsmoothing during extrapolation and interpolation in portionsof the model were required to create the model interfacesand geophysical property volumes. Because there are manyareas within the model where published data are sparse or oflow resolution, there is very likely significant uncertainty andtherefore subjectivity involved in building model horizons andin populating the model volumes.
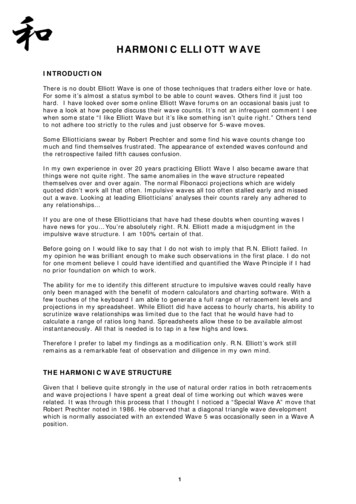
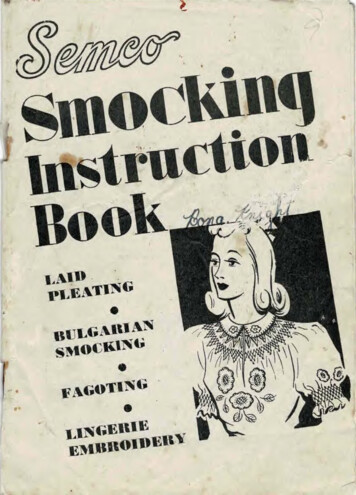
2 Velocity Models Incorporating the Cascadia Subduction Zone—Update for Open-File Report 2007–13485 0 0 '0 " N130 0'0"W125 0'0"W120 0'0"W5 0 0 '0 " NCanada!!4 5 0 '0 " N4 5 0 '0 " NWashingtonService Layer Credits: Content may not reflectNational Geographic's current map policy.Sources: National Geographic, Esri, DeLorme,HERE, UNEP-WCMC, USGS, NASA, ESA,METI, NRCAN, GEBCO, NOAA, increment PCorp.Oregon!0130 0'0"W87.5!175350 km125 0'0"WService Layer Credits: Content may notreflect National Geographic's current mappolicy. Sources: National Geographic,Esri, DeLorme, HERE, UNEP-WCMC,USGS, NASA, ESA, METI, NRCAN,GEBCO, NOAA, increment P Corp.4 0 0 '0 " N4 0 0 '0 " NCalifornia120 0'0"WFigure 1. Region of velocity models described in this report. Base map shows the urban centersof Portland, Oreg., Seattle, Wash., and Vancouver, British Columbia. Red polygon is approximateboundary of velocity property volumes that include the Cascadia subduction zone. Latitude andlongitude coordinates at corners of red polygon are, clockwise from upper left, 50 N., 129 W.; 50 N.,122 W.; 40.2 N., 122 W.; and 40.2 N., 129 W. Projection is World Geodetic System 1984 (WGS 84)datum.
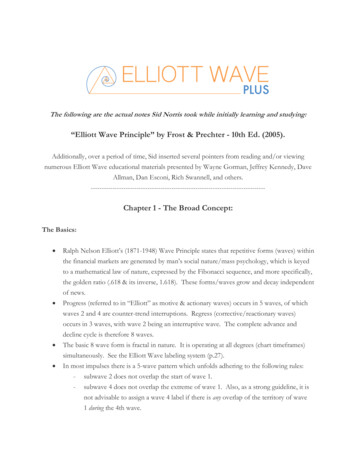
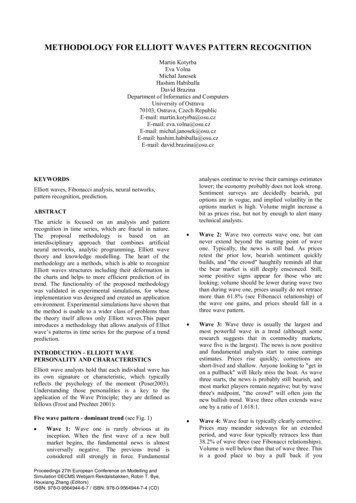
5.5Investigations Using Model V1.3x1062550V5North-South UTM Coordinate, in metersIntroduction 3SP5.0N4.5150,000metersThe first released version of model V1.3 found importantuse in the seismological and physics communities. A noncomprehensive list of published investigations using all or partof model V1.3 includes: (1) Frankel and Stephenson (2000)and Stephenson and Frankel (2003), who used subregionsof V1.3 for ground motion simulations valid up to 0.1 hertz(Hz); (2) Frankel and others (2007) used a larger subregionof model V1.3 that included the structural and geophysicaldetail in the southern Puget Lowland for scenario earthquakesimulations, including 3D basin effects in the Seattle basin,that were incorporated into the Seattle Urban Seismic HazardMaps; (3) Olsen and others (2008) used the entire modelvolume to carry out a deterministic Cascadia simulation up to0.5 Hz using a Sumatra-Andaman Islands rupture scenario;(4) Delorey and Vidale (2011) used the model for comparisonwith VS derived from ambient noise tomography in the Seattlebasin; (5) Molnar and others (2014) used the northern halfof the model as a starting point for ground motion modelingand seismic hazards investigations in the Vancouver, BritishColumbia region; and (6) Wagner and others (2012) used themodel in a theoretical physics experiment to test the weakequivalence principle.x10502.55.0East-West UTM Coordinate, in meters Primary Differences Between Models V1.3 andV1.6Figure 2. Contour map of Cascadia subducting slab uppersurface in model region (McCrory and others, 2012; Blair andothers, 2013). Contours are from 5 km to 60 km depth, in kilometersbelow mean sea-level. Gray region is continental North America,with the cities of Vancouver, British Columbia (V), Seattle, Wash.(S), and Portland, Oreg. (P), shown. UTM, Universal TransverseMercator.Several important modifications were done in thedevelopment of model V1.6. First, density (rho) values forall V1.6 model units are not provided as a separate propertyvolume as was done for model V1.3. Instead, end-userswill need to estimate the rho parameters for their specificpurpose. Lacking an alternative approach, we still recommendcalculation of rho directly from P-wave velocity (VP) usingthe empirical relationship of Brocher (2005), which isapproximately the deterministic form of the Nafe-Drake law.This empirical equation is:rho 1.6612* VP – 0.4721* VP2 0.0671* VP3 –The model volume incorporates bathymetry but does notincorporate topography. Topography is not included in modelV1.6 because the objective in developing these models wasfor use in 3D finite-difference ground motion calculationswith modeling codes that do not allow grid points for terrain.However, topography will be included in any future updateof this model, likely as part of the NCM, to accommodateadvances in ground motion simulations. Finally, there has beenlimited research into adding a geotechnical velocity gradientto approximate weathering in the shallow crust (for example,Shaw and others, 2015) and adding randomness to the velocityproperty values. These additional parametrizations showpromise for improving ground motion simulations, but havenot been included in model V1.6.0.0043* VP4 0.000106* VP5where VP is in kilometers per second (km/s) and rho is densityin grams per cubic centimeter) (g/cm3). After this calculation,we recommend the minimum and maximum non-waterdensities be constrained to 2.0 and 3.5 g/cm3, respectively,and ocean water be set to 1.028 g/cm3.Within the model volume, several notable changes togeologic structure and property parameter datasets were made:(1) the surficial contact between Quaternary and Tertiarysediments in western Washington State was redefined at higherresolution using the geologic map of Schuster (2005); (2) VSfor the continental crust and mantle were modified to use thetomographic results of Moschetti and others (2007), with VPin these units now calculated from empirical relationships
4 Velocity Models Incorporating the Cascadia Subduction Zone—Update for Open-File Report 2007–1348of Brocher (2005) at locations distal to the Puget Lowland;(3) bathymetry was updated to use the General BathymetricChart of the Oceans 2014 (GEBCO 2014) gridded data(GEBCO, 2015); (4) the surface geometry of the subductingslab was updated with the data of McCrory and others (2012)and Blair and others (2013); (5) the base of the subductingoceanic crust was redefined from downward projection of asmoothed version of the data of McCrory and others (2012)and Blair and others (2013).The Primary Geology-Based ModelUnits and Their Velocity PropertiesThe following section is from Stephenson (2007). Thebackbone of the velocity property volumes is the geologicmodel, consisting of autonomous units representing simplifiedgeologic units. Six primary units were defined for this model.As shown in figure 3, these are: (1) continental sedimentarybasins (subdivided into Quaternary and Tertiary basin units),(2) continental crust, (3) continental mantle, (4) oceanicsediments, (5) oceanic crust, and (6) oceanic mantle.In addition to the Cascadia subduction interface, theSeattle fault was incorporated into these models because ofits use as a seismogenic source in the Seattle Urban HazardsMaps (Frankel and others, 2007; fig. 4). The modelingdemands for the smaller-scale Seattle maps also drove themore detailed, complex overall appearance of the PugetLowland region in the current velocity models. The Seattlefault delimits the southern edge of the Seattle basin and thrustscrystalline crust over basin sediments, creating a sharp lateralvelocity contrast. Its surface trace was extracted from Blakelyand others (2002) and projected to a depth of about 20 kmassuming a 45 south dip. This dip angle is a median valuebased on the range of dips published from seismic reflectionsurveys (Pratt and others, 1997; Johnson and others, 1999; tenBrink and others, 2002; Calvert and others, 2003). Additionalcrustal faults can be incorporated into the model as interestand additional information arise.Published velocity information for the Cascadia regionincludes both regional VP and VS datasets, but there is limitedoverlap in the locations of the VP and the VS studies. Ingeneral, we used the available velocity data independently;however, in many of the geologic units, VP is derived from VS,or VS from VP , depending on data coverage. In units other thanthe continental sedimentary basins, the empirical relationsof Brocher (2005) are used for the velocity conversion. Thevelocities within the Quaternary and Tertiary sedimentarybasin units are described in detail in a later section, entitled“Continental Sedimentary Basins.”Continental Sedimentary BasinsContinental sedimentary basin deposits are subdividedinto Quaternary and Tertiary geologic units. The thicknessof the Quaternary units through the southern Puget Lowlandwas constrained using the borehole data of Jones (1996) andinterpreted depths from the marine seismic reflection dataof Johnson and others (1999), including the detailed surfaceof the Seattle uplift and basin from Frankel and Stephenson(2000). For the Quaternary thickness through eastern Juande Fuca Strait, the data of Mosher and Johnson (2000) wereincorporated to create the Quaternary-Tertiary interfacethroughout the northern Puget Lowland.Quaternary deposits in the Willamette Valley (includingthe Portland and Tualatin Basins) are generally less than30 meters (m) in thickness and are not explicitly includedin the model region. Future consideration of simulationsrequiring grid spacing less than 100 m should explicitlyinclude a thin Quaternary layer. Additionally, recent gravitymodeling has suggested that a significant thickness of lowerdensity sediment may exist in the Tualatin basin west ofPortland, below the interpreted base of basin sediments inthis model (about 6-km depth versus about 1.0-km depth inmodel V1.6; see McPhee and others, 2014). An image of theCascadia model V1.6 sliced through the Puget Lowland isshown in figure 5.The Quaternary VP property model varied onedimensionally with values of 1,500, 1,905, and 1,980 metersper second (m/s) at 0, 200, and 1,000 m depth, respectively.These values were derived from land surface measurementsand high-resolution marine seismic surveys (Williams andothers, 1999; Calvert and others, 2003). The Quaternary VSproperty model is derived from VS 30 and VP 30 measurementsat the surface to constrain VP/VS ratio to approximately 2.5.Setting this ratio to 2.5 in the near-surface is also consistentwith average borehole measurements in the upper 150 m byOdum and others (2004). To ensure a contrast in VS at the baseof Quaternary deposits, the VP/VS ratio was set to 2.2 at 1 kmdepth. The minimum VS in the Quaternary unit, including allnon-ocean regions within the model volume, was constrainedto 600 m/s as a limit for ground motion modeling, althoughnumerous VS measurements demonstrate lower VS in thelowland basins (for example, Williams and others, 1999;Stephenson and others, 2012). The maximum VS within theQuaternary unit was set to 900 m/s. The overall VS -versusdepth structure of the Quaternary deposits is generallyconsistent with estimates from Odum and others (2004),Delorey and Vidale (2011), and Stephenson and others (2012)in the top kilometer.
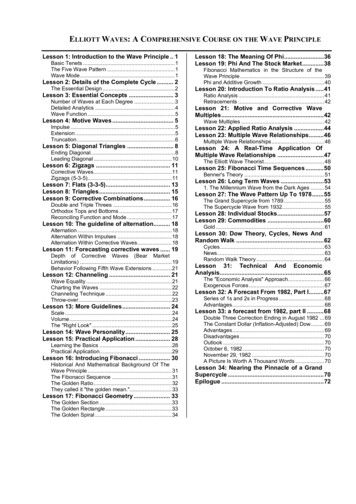
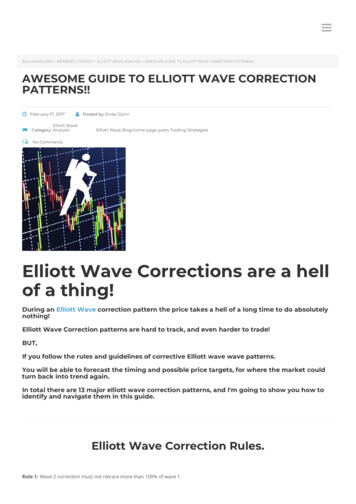
The Primary Geology-Based Model Units and Their Velocity Properties 5SeattleBasinPortlandBasinet 5.5er x1s062.0atrdooTMCordinate,U4.0thCoouMin6.0x1meter 0 , in metersx1040.0Quaternary sedimentsTertiary sedimentsOceanic sedimentsContinental crustContinental mantleOceanic crustOceanic mantleFigure 3. Geologic model volume including the Cascadia subduction zone. VP and VS property models cover the region from 40.2 to 50 N. latitude, 122 to 129 W. longitude, and from 0- to 60-km depth. Location of Seattle and Portland basins shown by arrows. Axes areannotated in Universal Transverse Mercator (UTM) zone 10 coordinates. Bathymetry (GEBCO, 2015) is included while topography abovemean sea level (0 m) is excluded. Model projected into UTM zone 10 north coordinates, World Geodetic System 1984 (WGS84) datum.View shows the seven basic geology-based model units and their relationships at depth. Cascadia subduction fault surface is inferredalong top of oceanic crust model unit.
6 Velocity Models Incorporating the Cascadia Subduction Zone—Update for Open-File Report 2007–13480–12 kilometersSeattle fault12–24 kilometers24–36 kilometers0.04.536–48 kilometers6.0East-Westx105Coordinate UTM, in meters48–60 kilometers5 06.5 x1M rsTU etehut in mo-S ,th naterNo rdioCoQuaternary sedimentsTertiary sedimentsOceanic sedimentsContinental crustContinental mantleOceanic crustOceanic mantleFigure 4. Horizontal subsections through Cascadia model V1.6. Each slab is 12 kilometers (km) thick. Model slabs are orthographicallyprojected for comparison. Location of Seattle fault shown in 12–24 km slab as a red line, underlying the Puget Lowland basins. Slabscover the entire model volume.
The Primary Geology-Based Model Units and Their Velocity Properties 70Depth, in me000,8-1soc ubdea ucnic tincru gstSeattle basinesWst-tersEaTMtUSeattle faultorCo30,000,300e,atdin85,53 rsemete, inins006,052eretmMT00th U0u,o85,20 North-StdinarCooFigure 5. Sliced view of Puget Lowland with Seattle basin. Seattle fault (red line, dashed where projected to surface),and subducting oceanic crust are labeled. Vertical exaggeration is approximately 6X. The Seattle fault dips at 45 southwithin the model volume. Axes are annotated in Universal Transverse Mercator (UTM) zone 10 north coordinates.Oceanic mantle unit is green, oceanic crust is olive, oceanic sediments unit is gray, continental crustal unit is tan,Tertiary sediments unit is purple, and Quaternary unit is pink.The base of the Tertiary sediments within the PugetLowland is interpreted to be at the 4,500 m/s velocity contour,based on oil-industry borehole data (Brocher and Ruebel,1998). This iso-contour surface was extracted from theSeismic Hazards Investigations in the Puget Sound (SHIPS)and earthquake data 3D P-wave tomography of Ramachandranand others (2006), which incorporate similar data from severalprevious tomography studies in the lowland (for example,Stanley and others, 1999; Brocher and others, 2001; VanWagoner and others, 2002). The Portland area sedimentarybasin thicknesses are derived from well data that intersectcrystalline rocks under (generally) Tertiary deposits (Yeatsand others, 1996; Gannett and others, 1998).VP of the Tertiary subunit in the Puget Lowland basinsis defined by tomography of Ramachandran and others(2006). A constant VP/VS ratio of 2 was imposed on theTertiary subunit to obtain VS. This value was selected toensure a distinct contrast in VS at the contact between thecontinental crust and Tertiary geologic units that are broadlyconsistent with VS interpreted by Snelson and others (2007).VP parameters within the Willamette Valley basin depositswere similar to the velocity-versus-depth structure of thePuget Lowland with several exceptions. Because Quaternaryage deposits are not explicitly defined in the basins within theWillamette Valley, the upper 100 m was sufficiently loweredto represent “Quaternary-like” deposits. In a manner similar
8 Velocity Models Incorporating the Cascadia Subduction Zone—Update for Open-File Report 2007–1348to our treatment of shallow VP , VS at the surface was set toapproximate VS 30 values in the Willamette Valley region usingdata from Odum and others (2010) to represent lower-velocityQuaternary deposits. A VP/VS ratio of 2 was imposed on theTertiary subunit in this region to calculate VP at the surface, tobe consistent with the surface VS values of Odum and others(2010), while VS to the base of the valley sediments wascalculated from VP .Continental CrustThe surface of the continental crust was set to mean sealevel (MSL) outside of sedimentary basins and east of theoceanic sedimentary deposits (see fig. 3) because topographyis not included in model V1.6. The surface of the continentalcrust below MSL was controlled by a smoothed continentalshoreline and numerous published active and passive sourceseismic results along the continental margin (for example,Trehu and others, 1994; Clowes and others, 1997; Flueh andothers, 1998; Fuis, 1998; Gulick and others 1998; Fleming andTrehu, 1999; Parsons and others, 1999; Stanley and Villaseñor,2000; Bostock and others, 2002; and Ramachandran andothers, 2006).Two primary datasets were integrated to form the VPand VS property volumes within the continental crust. TheSHIPS tomographic data (Ramachandran and others, 2006)formed the basis for VP throughout the Puget Lowland region,while the tomographic data of Moschetti and others (2007)formed the basis of VS throughout the remainder of the modelvolume. We once again rely on the empirical relationshipsbetween VP and VS of Brocher (2005) to calculate thecompanion property for both of these tomographic datasets.The final VP and VS property data were merged prior tovolumetric gridding within the geologic unit. Although notdirectly incorporated into the property calculation, the VPvalues calculated for the unit are broadly consistent with thenumerous studies referenced above.Continental MantleThe top of the continental mantle is derived from dataof Bassin and others (2000). These data were edited andsmoothed to create the surface of this unit. Property VS wasderived from the tomography results of Moschetti and others(2007). The VS tomography of Moschetti and others (2007)was used to define VP throughout the geologic unit fromthe relationships of Brocher (2005). These VP are generallyconsistent with the earlier tomography of Stanley and others(1999) from the Puget Lowland area, which was used toconstrain upper mantle VP in model V1.3.Oceanic SedimentThe oceanic sediment unit represents the accretionarywedge, composed of accreted oceanic and continentallyderived sedimentary deposits, which overlies the top of thecontinental crustal unit and the subducting oceanic crust. Theeastern portion of the bathymetric surface was used to defineelevation at the top of the oceanic sediment (figs. 3 and 5).Parameter VP is derived from results of Parsons and others(1999) and numerous active-source marine seismic surveys(Trehu and others, 1994; Clowes and others, 1997; Flueh andothers, 1998; Fuis, 1998; Gulick and others, 1998; Flemingand Trehu, 1999; Parsons and others, 1999; Stanley andVillaseñor, 2000; Bostock and others, 2002). Parameter VPvaries primarily as a function of depth. VS was derived fromVP using the empirical relationship of Brocher (2005). Theground motion simulation study of Olsen and others (2008)suggests this unit will be subject to intense shaking during aCascadia megathrust event, due in part to its proximity to thefault. Although this study used model V1.3, there are veryminor differences in this unit’s properties and geometry withinmodel V1.6.Oceanic CrustThe top of the subducting oceanic crust unit is definedby Blair and others (2011) and McCrory and others (2012).These data were merged with bathymetric data (GEBCO,2015) west of the oceanic sediment terminus to create theupper surface of the oceanic crust, which in the subsurface isinferred to be the top of the Cascadia subducting slab. Basedon available marine seismic-reflection profiling (for example,Fuis, 1998) and studies worldwide (for example, Turcotte andShubert, 1982), the thickness of the oceanic crust was set to5,000 m, which is likely on the low end of realistic values.Average velocity values derived from marine seismic surveyswere extrapolated to obtain VP (for example, Trehu and others,1994; Flueh and others, 1998; Fuis, 1998; Gulick and others,1998; Fleming and Trehu, 1999; and Ramachandran andothers, 2006) and extrapolated uniformly to 60,000 m depth.VS was derived from VP using the empirical relationship ofBrocher (2005).Oceanic MantleThe oceanic mantle is the only unit in the modelunderlying oceanic cru
Open-File Report 2017-1152 Version 1.1, September 2019 Supersedes USGS Open-File Report 2007-1348 Earthquake Hazards Ground Motion Investigations