Transcription
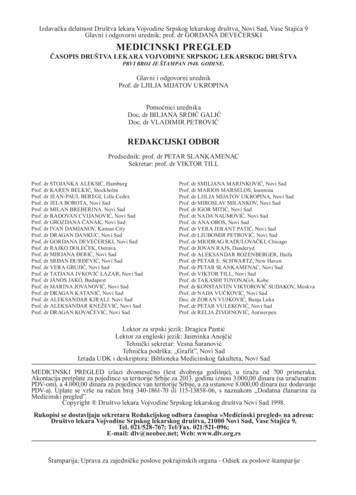
THE VALUATION OFASSET MANAGEMENT COMPANIESProf. Roberto Moro Visconti –Università Cattolica del Sacro Cuore, Milano, Italy roberto.moro@unicatt.itAbstractAsset management firms are characterized by having quite high margins, although working ina highly competitive industry. However, the nature of their businesses makes it difficult todefine both debt and reinvestment, making the estimation of cash flows much more difficult.It is reasonable to assume that Free Cash Flows to Equity-holders (FCFE) are proxied by netearnings because of a negligible level of investments, depreciation, and net working capital.For Asset Management firms, dividends are often the only tangible cash flow that we canobserve or estimate.The common methods used to value asset management firms are the discounted cash flow, themultiples, and the Dividend Discount Model, with some adaptions.Despite their simplicity, rules of thumbs are often characterized by the inaccuracy of the finalvalue.Keywords: Assets under Management, Discounted Cash Flows, Dividend Discount Model,multiples, rules of thumb, fees.1. FrameworkAsset Management companies can be independent investment companies or a part of a bank;they usually do not invest in their own account but on behalf of their clients. This is onedistinguished difference between asset management companies with other financial institutionssuch as commercial banks, investment banks, or insurers (Elliott, 2014).MorningStar defines investment management firms as “firms offering diversified services suchas asset administration, investment advice, portfolio or mutual fund management, moneymanagement, venture capital, and investment research”.According to the recent academic literature, the three methods commonly used for the valuationof the asset management firms are:1.the discounted cash flows - DCF (Damodaran, 2013);2.the multiples / rule of thumb (Bigelli & Manuzzi, 2019)3.the dividend discount model – DDM (Damodaran, 2018; Joenväärä & Scherer,2017), as illustrated in the following figure 1.:Roberto Moro Visconti – www.morovisconti.com1
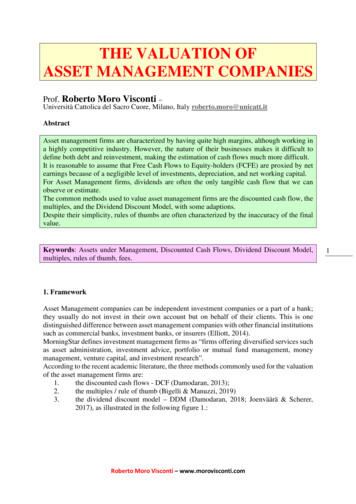
Figure 1. – Valuation methods of asset management firmsASSET MANAGEMENT FIRMSVALUATION METHODSMultiples /Rules ofthumbDiscountedCash Flows(DCF)DividendDiscountModel(DDM)Those approaches are landed from the standard valuation approaches (Moro Visconti, 2020,chapter 2), with some specific adaptions (Borroni & Rossi, 2019; Huberman, 2006; Malkiel,2013).Table 1. shows the principal factors that directly impact the valuation of those firms, includingcompany-specific risk as well as relative valuation multiples (Elliott, 2014; Iannotta, 2010):Table 1. – Value drivers for Asset Management firmsDriverSizeRevenue GrowthRevenue SourceClient DemographicsRelationshipsManagementEmployee DemographicsDescriptionReaching scale is importantOrganic growth or market growthCommission-based or fee-basedClient concentration, client tenure, new client ratio, client ageRelationship of revenue to the owner of the assetmanagement firmCompensation and expense managementNumber of employees, tenure, relationships with clientsOnce the most suitable evaluation approach has been defined, it might be appropriate to useanother evaluation approach, to double-check the evaluation carried out with the main approach(Fazzini, 2018).The use of a control approach is applied in all cases where it is possible to estimate the marketvalue of the company from complementary angles to arrive at a range of values within whichthe market value must be positioned (Koller & Goedhart, 2015).Roberto Moro Visconti – www.morovisconti.com2
2. The uneasy estimate of cash flows for financial companiesThe financial approach is based on the principle that the market value of the company is equalto the discounted value of the cash flows that the company can generate (“cash is king”). Thedetermination of the cash flows is of primary importance in the application of the approach, asis the consistency of the discount rates adopted (Singh, 2013).Damodaran (2013) highlights that it is not easy to estimate cash flows made by financial firms(not only asset management firms, but also banks, insurance firms, etc.). Even if financial firmswork in a regulated framework, their cash flows cannot be easily estimated, since items likecapital expenditures, working capital, and debt are not clearly defined.He, therefore, concludes that financial service firms are best valued using equity valuationmodels, rather than enterprise valuation models. When we evaluate an asset management firm,it is also reasonable to assume that Free Cash Flows to Equity-holders (FCFE) are proxied bynet earnings because of a negligible level of investments, depreciation, and net working capital.Asset management firms are characterized by having quite high margins, although working ina highly competitive industry (Berk & Green, 2004).Joenväärä and Scherer (2017), and the consistently Bigelli & Manuzzi, 2019, state that the netearnings by an asset management firm can be determined as the product of three components the assets under management (AUM), the ratio of fees on AUM (f), and the earnings margin,given by the ratio of the net earnings: / / (1)3. Applying DCF to Asset Management firms3Huberman (2006) adapts the Discounted Cash Flow model (DCF) to asset management firmsand concludes that the 2-4% P/AUM ratio at which asset management firms are usually tradedis relatively low, as their value on AUM should be closer to the earnings margin (q), which isusually around a 20% value. His model is based on the following hypothesis: net earnings equal the Free Cash Flow to Equity-holders;assets under management have already reached a steady state. No money flows into orout from managed assets, with the exception of the management fees that are debitedon a yearly basis. All dividends and capital gains are reinvested in the managed mutualfunds or the managed clients’ portfolios;the level of fees on AUM is equal to “f” as in Equation (1);the assets under management, net of transaction costs, but gross of (management) fees,yield a yearly return equal to “r”; the discount rate of the cash flows, “R”, is equal tothe return on the assets under management, “r”.Given the above hypothesis, using the more intuitive notation from Joenväärä and Scherer(2017), the Huberman model can be explained in the following way. Net earnings at the end ofthe first year can be defined as:1 (1 ) (2)While earnings at the end of a generic year “i” can be defined as: (1 ) (1 ) 1 Roberto Moro Visconti – www.morovisconti.com(3)
As a result of the above hypothesis, assuming that net earnings are equal to the FCFE, bydiscounting FCFEs at the Equity cost of capital (R), the following discounted cash flow modelfollows:If the returns on the assets under management (r) are equal to the equity cost of capital of thefirm (R), after some mathematical simplifications, Equation (4) can be reduced to thefollowing: 0 [1 (1 ) 1] (5)In addition, by considering an infinite valuation horizon (n ), and rearranging the equationto have the P/AUM ratio on the left-hand side, the model can finally be reduced to the followingresult:/ (6)Since the earning margin (q) is, on average, around 20%, while asset management firms areusually priced about 2-4% of AUM, Huberman (2006) concludes that they somehow quote ata discount.According to this model, the value seems to be insensitive to the level of fees because anincrease in fees will increase the earnings in the short run at the expense of earnings in the longrun. The two effects offset each other when the asset growth rate (gross of fees), “r”, is equalto the discount rate “R” (Bigelli & Manuzzi, 2019).However, this hypothesis seems persuasive and unrealistic, as the average return of assets undermanagement should be lower than the equity cost of capital because assets under managementare also composed of bonds and money market portfolios. Besides, the risk of equity of an assetmanagement firm is anyway amplified by operational and regulatory risk.The equivalence between the perpetual return of the assets under management and the equitycost of capital of the firm is also identified as the main limitation of Huberman’s model byJoenväärä and Scherer (2017). They also argue that it cannot be assumed that the level of assetsunder management increases ad infinitum, as the investment industry suffers from diseconomyof scales, as shown by Berk and Green (2004).Latzko (2014) also empirically reports that economies of scales in mutual fund administrationvanish when about 3.5 billion in fund assets is reached. Joenväärä and Scherer (2017)therefore amend Huberman’s model. By assuming that the asset management firm has alreadyreached its optimal size, they introduce the hypothesis that assets under management areconstant over time, eliminating the previous assumption of a yearly gross revaluation at a yearlyrate equal to “r”.In this way, by assuming that the level of fees and the net margin is also constant over time,the net earnings also become constant over time. The net earnings made in year i can, therefore,be expressed in the following way: (7)Assuming net earnings equal to the FCFE again, the present value of the discounted stream offuture perpetual cash flows becomes as follows:Roberto Moro Visconti – www.morovisconti.com4
1/ (8)If we express the final equation indicating the P/AUM on the left-hand side, the results becomemore easily comparable with those of the previous model, as in the following equation:/ 1/ (9)The Price/AUM ratio is, therefore, simply given by the present value of perpetuity whoseperpetual cash flow is the product of the level of fees on AUM (f) and the net margin (q).The model developed by Joenväärä and Scherer (2017) results in valuations of assetmanagement firms in line with the empirical ones observed on the market. In fact, if we takesome hypothetical values not far from real ones and we set a level of fees equal to 1% of assetsunder management (f), a net margin equal to 20% (q) and a discount rate equal to 6% (R), theresulting multiple P/AUM would be equal to 3%. This value is very similar to the average oneobserved on the market and in the acquisitions of asset management firms (Zask, 2005;Constant, 2004).4. Multiples and rule of thumbsAs Bigelli & Manuzzi (2019) point out, “academic literature has addressed how multiples canbe used in firm valuation (Lie & Lie, 2002; Liu et al., 2002), how the selection of comparablefirms can be relevant (Alford, 1992; Bhojraj & Lee 2002), how the comparable companymethod should be adjusted for the value of corporate control (Finnerty & Emery, 2004), howemerging markets may have specifics factors affecting multiples (Farah Freihat, 2019), howsome multiples can be combined to obtain a better estimate (Yoo, 2006), how firm’s value indifferent industries is better proxied by different multiples (Fidanza, 2010), and whichmultiples work better for banks’ valuation (Forte et al., 2018)”.In the case of comparable companies, the approach estimates multiples by observing similarcompanies (Alford, 1992; Fidanza, 2010). The problem is to determine what is meant by similarcompanies. In theory, the analyst should check all the variables that influence the multiple.In practice, companies should estimate the most likely price for a non-listed company, takingas a benchmark some listed companies, operating in the same sector, and consideredhomogeneous. Two companies can be defined as homogeneous when they present, for the samerisk, similar characteristics, and expectations (Lie & Lie, 2002).According to widespread estimates (Fernandez, 2001; Yoo, 2006), the main factors inestablishing whether a company is comparable are:-Size;Belonging to the same sector;Financial risks (leverage);Historical trends and prospects for the development of results and markets;Geographical diversification;Degree of reputation and credibility;Management skills;Ability to pay dividends.Roberto Moro Visconti – www.morovisconti.com5
The multiple can be reduced by a proper percentage to consider the non-perfect comparabilityof the sample in terms of activity, location and turnover (size discount1) and the non-listing ofa company (illiquidity discount), (Damodaran, 2005). For empirical evidences regarding thesize discount,see e27-Rebranded.pdf.The calculation is:- A company whose price is known (P1);- A variable closely related to its value (X1).The ratio (P1)/(X1) is assumed to apply to the company to be valued, for which the size of thereference variable (X2) is known.Therefore:(P1)/(X1) (P2)/(X2)(10)so that the desired value P2 will be:P2 X2 [ (P1)/(X1)](11)For the valuation of the Asset Management firms, the multiples commonly used are the ratiosEV/AuM and EV/Revenues, considering that the most diffuse ratio EV/EBITDA would besupposedly dependent on the different accounting policies used.Besides those multiples, there is another empirical method, the rules of thumb, which are ashort-cut way to arrive at a value, i.e., the “average” firm in the industry is valued at two timesrevenues or 5 times cash flow.Rules-of-Thumb usually fail to consider (among other items):1.2.3.4.Differences in effective management fees;Profitability;Differences in growth rates;Quality of AUM, clients.As a result, firms of above-average quality can be undervalued, while firms of below-averagequality can be overvalued.5. The Dividend Discount ModelThe dividend discount model (DDM) is a method of valuing a company's stock price based onthe theory that its stock is worth the sum of all its future dividend payments, discounted backto their present value (Farrell, 1985). In other words, it is used to value stocks based on the netpresent value of future dividends.The model simply discounts cash flows at a given rate, just like any other DCF model. Thedifference lies in the fact that dividend discount models consider only “dividends” as beinglegitimate cash flows.1For empirical evidences regarding the size discount, see e27-Rebranded.pdf.Roberto Moro Visconti – www.morovisconti.com6
Therefore, if a firm pays no dividends at all, this model cannot be applied to the firm regardlessof how profitable or cash flow efficient its operations are.According to Damodaran (2013), many analysts accept the reality that estimating cash flowsfor financial service firms is not feasible and fall back on the only observable cash flow –dividends. While this makes sense, these analysts are implicitly assuming that the dividendsthat are paid out by a bank or insurance company are sustainable and reasonable. The focus oncurrent dividends can also create problems when valuing financial service firms that havegrowth potential.If we start with the assumption that equity in a publicly traded firm has an infinite life, wearrive at the most general version of the dividend discount model:(12)whereDPSt Expected dividend per share in period tke Cost of equityIn the particular case where the expected growth rate in dividends is constant forever, thismodel collapses into the Gordon Growth model.(13)In this equation, g is the expected growth rate in perpetuity, and DPS1 is the expected dividendsper share next year. In the more general case, where dividends are growing at a rate that is notexpected to be sustainable or constant forever during a period (called the extraordinary growthperiod), we can still assume that the growth rate will be constant forever at some point in thefuture.The cost of equity for a financial service firm must reflect the portion of the risk in the equitythat cannot be diversified away by the marginal investor in the stock.There is an inherent trade-off between dividends and growth. When a company pays a largerpart of its earnings as dividends, it is reinvesting less and should thus grow more slowly. Withfinancial service firms, this link is reinforced by the fact that the activities of these firms aresubject to regulatory capital constraints (Damodaran, 2013).6. Pros and cons of the valuation methodsThe three valuation methods previously illustrated (DCF, multiples, and DDM) need properadaptions for their applications to the Asset Management firms, and each of them has itsstrengths as well its weakness.Table 2. synthetically shows the principal pros and cons of the above-indicated valuationmethods of Asset Management firms:Roberto Moro Visconti – www.morovisconti.com7
Table 2. – Strengths and weakness of valuation methods of Asset Management firmsMethodDCFStrengthsThe value of a firm ultimately derivesfrom the inherent value of its future cashflows (“Cash is king”)Not influenced by depreciations /capitalisations policiesEasy to use (“quick and dirt”)MultiplesFew parametersDCF strengthsDDMDividends appear as the more objectivecash flows for Asset Management firmsWeaknessesReliability of the future cash flowsestimationSubjectivity of the discount ratesdeterminationsFairness of the selectedmultiples / comparablesAccuracy of the results (rule ofthumbs)Current dividends ignore growthpotentialImplicitly assumes that the dividendspaid out are sustainable andreasonableSELECTED REFERENCESAlford, A.W. (1992). The effect of the set of comparable firms on the accuracy of the priceearnings valuation method. Journal of Accounting Research, 30(1), 94-108.https://doi.org/10.2307/2491093Berk, J.B., & Green, R.C. (2004). Mutual fund flows and performance in rational markets.Journal of Political Economy, 112(6), 1269-1295. https://doi.org/10.1086/424739Bigelli, M., & Manuzzi, F. (2019). The valuation of asset management firms. CorporateOwnership & Control, 16(4), 103-110. http://doi.org/10.22495/cocv16i4art9Bhojraj, A., & Lee, C.M.C. (2002). Who is my peer? A valuation-based approach to theselection of comparable firms. Journal of Accounting Research, 40(2), roni, M., & Rossi, S. (2019). Bank Profitability: Measures and Determinants. In:Banking in Europe. Palgrave Macmillan Studies in Banking and Financial Institutions.Palgrave Pivot, Cham.Constant, M.I. (2004). Brokers and asset managers, September Quarter Broker/InvestmentBank Earnings Preview. Lehman Brothers Report.Damodaran, A. (2005). Marketability and Value: Measuring the Illiquidity les/papers/liquidity.pdf.Damodaran, A. (2013). Valuing financial service firms. Journal of Financial Perspectives, 1,59-74.Damodaran, A. (2018). The Dark Side of Valuation. Pearson FT Press PTG, 3rd edn.Elliott, D. (2014). Systemic Risk and the Asset Management Industry.http://www.brookings.edu/ sk%20asset%20management%20elliott/systemic risk asset management elliott.pdf.Farah Freihat, A. R. (2019). Factors affecting price to earnings ratio (P/E): Evidence from theemerging market. Risk Governance and Control: Financial Markets & Institutions, 9(2), 4756. https://doi.org/10.22495/rgcv9i2p4Farrell, J.L. (1985). The Dividend Discount Model: A Primer. Financial Analysts Journal,41(6), 16-25.Fazzini, M. (2018). Business valuation: theory and practice. Palgrave.Roberto Moro Visconti – www.morovisconti.com8
Fernandez, P. (2001). Valuation using multiples. How do analysts reach their conclusions?IESE Business school, Madrid.Fidanza, B. (2010). The valuation by multiples of Italian firms. Corporate Ownership &Control, 7(3-1), 228-241. https://doi.org/10.22495/cocv7i3c1p7Finnerty, J.D., & Emery, D.R. (2004). The value of corporate control and the comparablecompany method of valuation. Financial Management, 33, 91-99.Forte, G., Gianfrate, G., & Rossi, E. (2018). Does relative valuation work for banks? GlobalFinance Journal, 1-25. https://doi.org/10.1016/j.gfj.2018.09.002Huberman, G. (2006). Is the price of money managers too low? Working paper, ColumbiaBusiness School. https://doi.org/10.2139/ssrn.912774Iannotta, G. (2010). Investment Banking, Springer.Joenväärä, J., & Scherer, R. (2017). A note on the valuation of asset management firms. 287-yKoller, T, & Goedhart, M. (2015). Valuation: measuring and managing in the value ofcompanies. McKinsey & Company.Latzko, D.A. (1999). Economies of scale in mutual fund administration. Journal of FinancialResearch, 22(3), 331-339. Lie, E., & Lie, H.J. (2002). Multiples used to estimate corporate value. Financial AnalystJournal, 58(2), 44-54. https://doi.org/10.2469/faj.v58.n2.2522Liu, J., Nissim, D., & Thomas, J. (2002). Equity valuation using multiples. Journal ofAccounting Research, 40(1), 135-172. https://doi.org/10.1111/1475-679X.00042Malkiel, B.G. (2013). Asset management fees and the Growth of finance. Journal of EconomicPerspectives, 27(2), 97-108. https://doi.org/10.1257/jep.27.2.97Moro Visconti R., (2020), The Valuation of Digital Intangibles. Technology, Marketing andInternet, Palgrave Macmillan, Cham.Singh, J.P. (2013). On the Intricacies of cash flow corporate valuation. Advances inmanagement, 6(3), 15-22.Yoo, Y.K. (2006). The valuation accuracy of equity valuation using a combination of ttps://doi.org/10.1108/14757700610668958Zask, E. (2000). Hedge funds: a methodology for hedge funds valuation. Journal of AlternativeInvestments, 3(3), 43-46. https://doi.org/10.3905/jai.2000.318965Roberto Moro Visconti – www.morovisconti.com9
Asset Management companies can be independent investment companies or a part of a bank; they usually do not invest in their own account but on behalf of their clients. This is one distinguished difference between asset management companies with other financial institutions such as commercial banks, investment banks, or insurers (Elliott, 2014).