Transcription
Bartik, Hershbein & Lachowska Online AppendicesAppendix ADataThis appendix gives more information on our data, estimation sample, and variables.1. KPS ADMINISTRATIVE RECORDS AND VARIABLE DEFINITIONSOur main dataset is derived from administrative records of KPS students from thegraduating classes of 2003 through 2013. From these data, we define graduates based on entryand exit codes provided by KPS.From the KPS records, we obtain information about high school of graduation andstudent demographics, including sex, race/ethnicity (Native American, Black, Asian, Hispanic,or White), and participation in the federal assisted lunch program (a binary yes/no variable). Wealso obtain data for high school of graduation and academic variables (cumulative GPA, highestmath class taken, the number of AP classes taken, and whether the student attended theKalamazoo Area Mathematics and Science Center [KAMSC]). Except for lunch status, weobserve each of these variables for every high school graduate. We do not observe lunch statusfor the class of 2003; instead, we impute this variable as described in section 1.2, below.1.1 Definition of Kalamazoo Promise EligibilityWe use the KPS student entry and withdrawal records to construct our key explanatoryvariable, the indicator for whether a high school graduate is eligible for the Kalamazoo Promise.The KPS school tenure records go back to the 1996–1997 school year, which allows us to trackcontinuous enrollment histories for most students, although earlier cohorts have truncated1
histories. For example, for the high school class of 2003, we observe records back to sixth grade(if the student graduated on time), but not earlier.For the graduates from the classes of 2003 through 2013, eligibility equals one if thestudent would have been eligible for any tuition subsidy (65 percent or more) if he or she residedin the district and had been continuously enrolled in KPS from before the fall count date in ninthgrade. (For the graduates from the classes of 2003–2005, eligibility is assigned had theKalamazoo Promise been in effect at that time.) If the student enrolled after the ninth-grade fallcount date, or was not a district resident, we count that student as ineligible in accord withPromise rules.In the post-Promise period (2006–2013), we can observe actual eligibility based on theadministrative records directly from the Kalamazoo Promise. This allow us to observe the extentof discrepancies between the rules-based eligibility assignment and actual, observed assignment.Appendix Table A1 compares Promise eligibility based on administrative data to Promiseeligibility (observed eligibility) based on the continuous-enrollment rule and shows a closematch: out of 3,947 observations in the post-Promise period, 3,400 are scored as eligible by boththe rules algorithm and the administrative data and 371 are scored as ineligible by both the rulesalgorithm and the administrative data. Only 5 observations show eligibility under the rulesalgorithm but not in the administrative data. These cases appear to be special-education studentswho were not district residents; in our data, the special education code takes precedence over thecode identifying resident status. For 171 observations, the algorithm finds that these studentsshould not be eligible even though they apparently are. The majority of these are high-riskstudents who have moved in and out of KPS and thus had breaks in their continuous enrollment;11From conversations with the Promise administrators, these exceptions to the rules were apparently madeto accommodate students who temporarily left KPS for behavioral or family issues, a rather disadvantaged group.2
however, about one-third are students who successfully appealed their eligibility with Promiseadministrators.Appendix Table A1: Eligibility and Ineligibility Comparison between Administrative Data andContinuous-Enrollment Assignment Algorithm in the Post-Promise PeriodEligible byIneligible byIneligible byEligible byTotal numberadmin. data,admin. data,both admin.both admin.ofineligible byeligible bydata anddata mPanel A: Class l B: .3340.4860.460Subs. lunch0.8130.6000.6630.5340.558High school 10.4210.4000.5470.5310.527High school 20.2980.4000.3370.4010.3911.2 Free or Reduced Lunch Program Participation in 2003Because the KPS data do not record whether students participated in the federal assistedlunch program in 2003, we impute this variable using data from the other two pre-Promise years,2004 and 2005. Using data for these two years, we predict the probability that a student is on thefederal assisted lunch program by logistic regression of the lunch status dummy on a fullysaturated (i.e., all possible interactions) vector of controls: gender, race/ethnicity, and highschool indicator. The regression also includes achievement variables: cumulative school-year-For example, among these 171 students, 81.3 percent are eligible for subsidized lunch, which is higher than theoverall rate of 55.8.3
level GPA as a cubic spline, cumulative AP classes taken, dummies for the highest math classtaken, and a dummy for whether the student participated in the math and science magnetprogram.We define a student as participating in the lunch program using the following two-stepprocedure. First, using a random-number generator, we create a variable that is uniformlydistributed from 0 to 1. Second, we assign a student to the lunch program if the predicted valueof a student’s lunch-program participation probability exceeds his or her corresponding randomnumber value.2. DESCRIPTION OF NSC DATAThe National Student Clearinghouse (NSC) is a nonprofit organization that tracks studentenrollment at nearly all postsecondary institutions at which students can receive federal financialaid. Through the StudentTracker service, school districts can submit student names and birthdates, and NSC will match with their database and return postsecondary enrollment records. Weobtained StudentTracker data from KPS covering the high school graduating classes of 2003through 2013 and the enrollment periods of Fall 2003 through Spring 2014.The data provide the college attended for each term’s enrollment. They also record theintensity of enrollment (full-time, half-time, less than half-time, and whether the studentwithdrew). We also observe whether a credential was received, the type of credential, and thedate of receipt. Together these data are used to construct our outcome variables.We are able to match more than 97 percent of the KPS graduates in our data to NSCrecords (Appendix Table A2).2 Of the unmatched, nearly half are from 2003: for this year, NSC2Discrepancies between the two columns are primarily, but not exclusively, due to failed NSC matches. Avery few additional graduates lacked core data, such as graduation date.4
reports no graduates from KPS’s alternative high school. Our estimates control for high school ofgraduation by year, so this exclusion is not problematic.Appendix Table A2: Final Match RatesClass yearFinal Matched Estimation SampleAll KPS 265312013513519Total5,4155,549Note: All KPS grads refer to graduates earning a regular high school diploma.Although the match rate is high, the NSC has shortcomings. As detailed by Dynarski,Hemelt, and Hyman (2015), NSC data do not cover all colleges, especially in the earlier period,and some records are blocked because of student or school requests under the FamilyEducational Rights and Privacy Act (FERPA). They show that coverage ranged from about 83percent of students in 2003 to 90 percent in 2011. For Michigan colleges, coverage was slightlylower than for the nation in 2003 and slightly higher in 2011. For-profit institutions have lowercoverage than other institution types.The most relevant coverage issue for this paper is for Kalamazoo Valley CommunityCollege (KVCC), the local public two-year school, which approximately one-third of KPSgraduates attend. KVCC did not provide student records to NSC before 2005. As a substitute, we5
obtained equivalent data for KPS graduates for the Summer 2003 through Summer 2005 perioddirectly from KVCC upon special request, in cooperation with KPS and the Kalamazoo Promise.There are other schools for which NSC coverage began during our sample period, but none are(or were) attended in large numbers by KPS graduates.32.1 Construction of Outcome VariablesThe NSC data contain the dates enrollment begins and ends for each college attended.We combine these data with dates of high school graduation to determine whether and what typeof postsecondary institution was attended within different time frames of high school graduation.We do not count college enrollment that began before high school graduation (i.e., dualenrollment).The NSC data do not contain the number of credits attempted or earned, but they docontain a measure of enrollment intensity: full-time, half-time, less than half-time, or withdrawn.For institutions on a semester system, we assign 12 credits, 6 credits, 3 credits, and 0 creditsattempted to each of the categories, respectively. For institutions on a trimester or quartersystem, we assign credits per term that are proportionally adjusted to accord with the semestersystem over a standard academic year. We determine timing based on enrollment end dates andhigh school graduation dates, as above. The credit assignments are approximations, but as longas actual credits attempted to do not differentially vary by eligibility over time, our estimatesshould not be biased. The NSC data also provide the type and date of degrees or credentialsearned, separately from enrollment.3Within Michigan, coverage for Wayne State University (four-year public) and Washtenaw CommunityCollege (two-year public) began in 2004, Michigan Tech University (four-year public) began in 2008, BakerCollege of Flint and Davenport University (both four-year private nonprofit) began in 2009, and Everest Institute ofKalamazoo (four-year for-profit) began in 2011. Outside of Michigan, coverage for the University of Phoenix beganin 2006.6
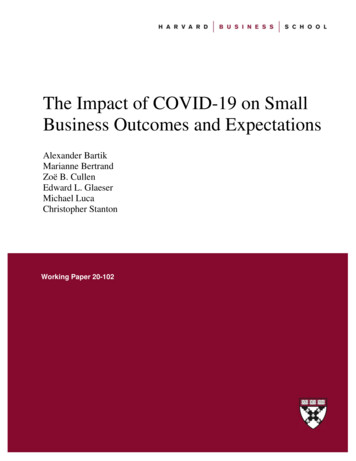
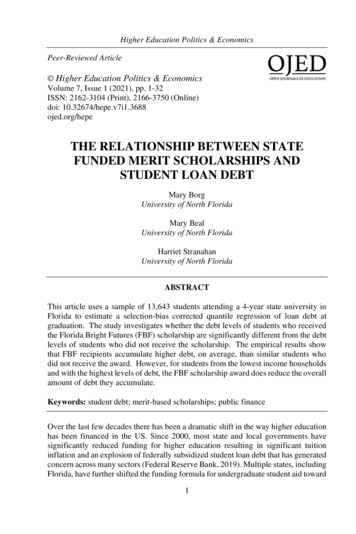
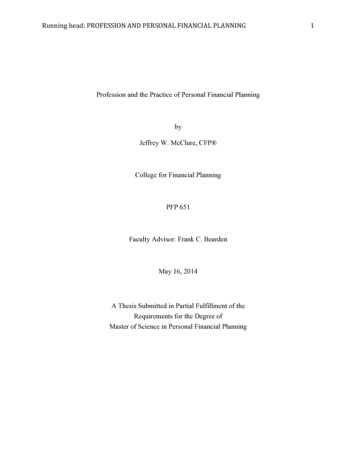
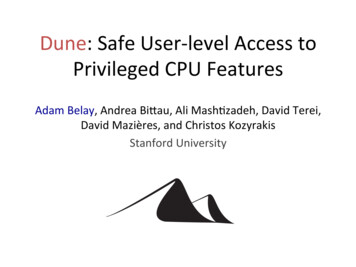
Appendix BIn- and Out-Migration Before and After the PromiseIn this appendix, we reproduce part of the analysis of examining in- and out-migrationbefore and after the Promise from the paper “A Second Look at Enrollment Changes after theKalamazoo Promise” (Hershbein 2013). Figures 1 and 2 from that paper (presented below) showthat in-migration increased only in the year immediately following the Promise announcement,and only for grades K–9 (Promise-eligible grades). Exit rates permanently fell after the Promise,but to a lesser extent in the high school grades.Moreover, in terms of student composition, Hershbein (2013) shows that while the newstudents who entered KPS in 2006—the year after the announcement—were moresocioeconomically advantaged than previous new students, this selection was relatively modest.Whereas previous new entrants were highly disadvantaged, the new entrants in 2006 moreclosely resembled incumbent students (who still were well below the state average on test scoresand income proxies). For example, Figure 8 from that paper, also reproduced below, shows nosystematic change in standardized math or reading scores among third through eighth gradersbefore and after the Promise, when comparing incumbent students (“stayers”) to new entrantsinto the district.Additionally, there is suggestive evidence of slight positive selection on exiting students.Hershbein concludes (p. 32): “While the Promise may have attracted students from a greatersocioeconomic stratum, its effectiveness at keeping them is more subdued. Because exit rates felloverall, more of these types of students stayed in the district, although poorer students were evenmore likely to stay. As these changes were too small to affect the makeup of the student body as7
a whole, composition is likely to play a minimal role in macro effects from Promise-typeprograms.”Consequently, selective migration should not be a major issue. While it would bedesirable to test whether the Promise affects high school graduation, such a test is difficult due tothe nature of the program, as anyone who begins in KPS in ninth grade is presumed Promiseeligible. Moreover, to the extent that the Promise does affect high school graduation, it islogically more likely to do so for eligible students at the margin, for whom the Promise wouldincrease the option value of graduation. However, such students are likely to lead to negativeselection into the eligible population post-Promise, biasing our estimates downward.ReferencesHershbein, Brad. 2013. “A Second Look at Enrollment Changes after the Kalamazoo Promise.”Upjohn Institute Working Paper No. 200. Kalamazoo, MI: W.E. Upjohn Institute forEmployment Research.8
Figures 1, 2, and 8 from Hershbein, Brad J. 2013. “A Second Look at Enrollment Changesafter the Kalamazoo Promise.” Upjohn Institute Working Paper 13-200.Figure 1 New Fall Student Entrants to KPS, by Grade and Year IntervalFigure 2 Student Exit Rates from KPS, by Grade and Year Interval529
NOTE: The Michigan Educational Assessment Program (MEAP) is a standardized test given in grades 3–8 that wasredesigned beginning in 2005, so there is a limited pre-Promise period for evaluating trends.10
Appendix COther Results Estimated Using the Between-District MCER Analysis SampleThis appendix presents a more complete set of results for the between-district estimatesof the effects of the Kalamazoo Promise. Appendix Table C1 presents pre- and post-Promisesummary statistics for KPS, other districts in the Middle Cities Education Association (MCEA),and other Michigan districts statewide.Appendix Table C2 present difference-in-differences estimates of Promise effects,comparing KPS to MCEA districts (first two panels), and KPS to all other Michigan districts(last two panels). The MCEA includes most predominantly urban districts in the state ofMichigan, except Detroit Public Schools.In Appendix Figures C1 through C6, we use the cross-district data to analyze Promiseeffects using the synthetic control method of Abadie, Diamond, and Hainmueller (2010). Thesynthetic control method is motivated by the observation that a weighted average of non-treateddistricts can be a better counterfactual of a treated district than any single district. In practice, thesynthetic control method allows us to use data-driven methods to select a suitable weightedaverage of comparison districts. The specific protocol is described below.11
Table C1Descriptive Statistics for KPS, MCEA districts, and all other Michigan districtsEnrollment in 4 year within 6 monthsEnrollment in public 4 year within 6 monthsEnrollment in flagship within 6 monthsEnrollment in other 4 year within 6 monthsDegree completion within 6 yearsBachelor's completion within 6 yearsStudent teacher ratioPercent FRLPercent BlackPercent WhitePercent HispanicPercent other .4%5.2%MCEA districts other than KPSPost-period Pre-period Overall26.4%22.8% 25.4%18.5%17.1% 18.1%4.0%4.7%4.2%7.9%5.6%7.3%25.5%26.9% 26.1%19.3%20.0% 19.6%18.928.621.552.1%38.4% 48.3%39.5%34.3% 38.1%51.4%58.0% 53.2%5.7%4.9%5.5%2.9%2.6%2.8%All other districtsPost-period 80.2%3.8%2.8%4.0%3.3%SOURCE: Authors' calculations using the Michigan Consortium for Educational Research (MCER) data of district by year 30.2%14.9%77.4%3.5%3.8%
Table C2Promise Effects on Enrollment and Completion using Between-District Analysis (MCEA and all districts,with and without linear time trends)(1)Dependent variable4-yrschoolMCEA: with district time trendsAfter KPSRobust standard errorPermutation p-valueMean DV(2)(3)(4)Enrollment within 6 months at:44-yr. 1**[0.024]0.0320.259(5)(6)Credential at 6 years:AnycredentialBA/BS0.110**[0.019]0.0320.181 [0.012]0.032 0.1610.020[0.015]0.1940.082**[0.017]0.0310.236 012]0.025 0.2100.011[0.011]0.288MCEA: without district time trendsAfter KPSRobust standard errorPermutation p-value0.059**[0.019]0.032All districts: with district time trendsAfter KPSRobust standard errorPermutation p-valueMean DV0.041[0.024]0.1160.328All districts: without district time trendsAfter KPSRobust standard errorPermutation p-value0.033[0.018]0.153NOTE: Standard errors robust to heteroskedasticity are in parentheses. ***, **, and * indicate p less than 0.01, 0.05, or 0.10.p-value is obtained using a placebo-regression permutation inference described in the text. Regressions include district-byyear proportions of students to teachers, students eligible for subsidized lunch, white students, nonwhite students, andHispanic students. For observations missing a covariate, we include a dummy for missing and assign the sample mean. Theregressions control for district fixed effects and year-of-graduation time effects. Observations are weighted by the number ofgraduates in each district-year. The mean of the dependent variable is for the control districts in the pre-Promise period. Thecontrol districts consist either of the Michigan Middle Cities Education Association (MCEA) districts (top two panels) or ofall districts in Michigan (bottom two panels).Synthetic Control ProtocolWe begin with the potential synthetic control donor pool of 511 districts. We keep onlythose with a full balanced panel across years, which reduces the set to 315 districts. Takingaverages across time, we drop districts whose values for the outcomes and student-teacher ratio,13
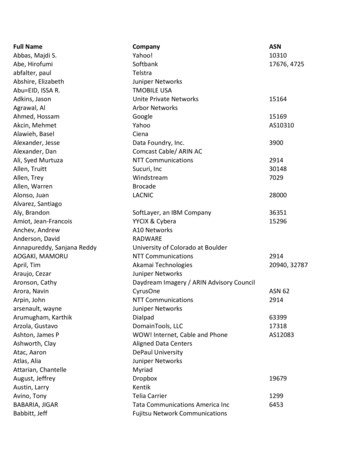
percent free or reduced- price lunch (FRL), and percent white differ by more than 2.43 standarddeviations of the statewide distribution from KPS’s values, leaving a donor pool of 100 districts.Most of the districts trimmed from the donor pool have either high concentrations of whites orvery low concentrations of FRL students; however, a few very highly nonwhite and high FRLdistricts are also trimmed. Districts whose share of FRL students were within [0.039, 0.909] andwhose white student share were within [0.021, 0.924] are kept; these two variables drive much ofthe trimming.We use the “synth” command in Stata, with KPS as the treated unit, selecting the 2003and 2005 values of the outcome variable and the average values over 2003–2005 of the studentteacher ratio, percent FRL, and percent white as the matching variables.For inference, we repeat this procedure, assigning each of the other donor pool districts tobe the treated unit. We collect both the treated unit’s treatment effect and the synthetic control’streatment effect for each run of “synth” and calculate their difference for each year, along withthe root mean squared predicted errors (RMSPE).Finally, we plot the net effect of the Promise across time for all the districts whoseRMSPE is less than a specified cutoff in terms of multiples of KPS’s RMSPE. Our preferredcutoff is 1.25 x KPS’s RMSPE. Below, we present result figures from this analysis.The results are roughly consistent with the between-district regression analysis. Forcollege enrollment outcomes, synthetic controls closely match KPS before the Promise, andPromise effects are unusually high relative to those of placebo districts. For degree completionoutcomes, synthetic controls match KPS less closely before the Promise, and effects, whilepositive, are noisier, and inference is less conclusive.14
ReferencesAbadie, Alberto, Alexis Diamond, and Jens Hainmueller (2010). “Synthetic Control Methods forComparative Case Studies: Estimating the Effect of California’s Tobacco ControlProgram.” Journal of the American Statistical Association 105(490): 493–505.15
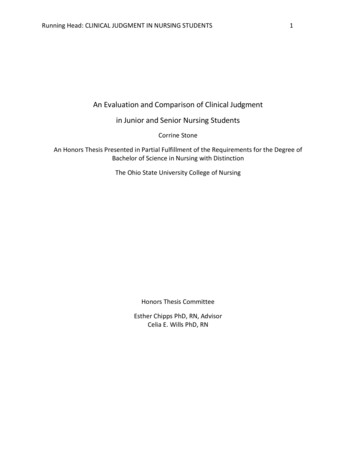
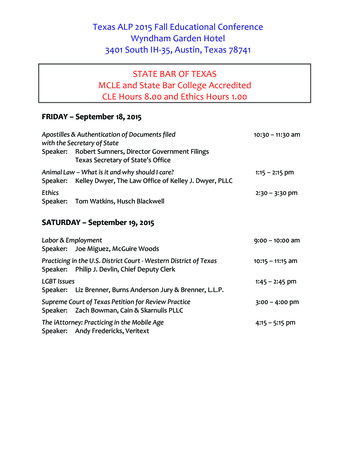
Appendix Figure C1: Enrollment in 4-year college within six months of HS graduationSynthetic Control: KPS.45.4.35Percentage points.5Enrollment in 4 year school within 6 months20032004200520062007 2008 2009Graduation yeartreated unit2010201120122013synthetic control unit-.4-.20Percentage points.2.4Enrollment in 4 year school within 6 months20032004200520062007 2008 2009Graduation year2010201120122013Included districts' RMSPE are within 100 times KPS's KPS is shown in bolded black-.2-.10Percentage points.1.2Enrollment in 4 year school within 6 months20032004200520062007 2008 2009Graduation year201020112012Included districts' RMSPE are within 1.25 times KPS's KPS is shown in bolded black162013
Appendix Figure C2: Enrollment in MSU or UM-AA within six months of HS graduationSynthetic Control: KPS.12.1.08.06Percentage points.14.16Enrollment in flagship 4 year within 6 months20032004200520062007 2008 2009Graduation yeartreated unit2010201120122013synthetic control unit-.2-.10Percentage points.1.2Enrollment in flagship 4 year within 6 months20032004200520062007 2008 2009Graduation year2010201120122013Included districts' RMSPE are within 100 times KPS's KPS is shown in bolded black.050-.05Percentage points.1Enrollment in flagship 4 year within 6 months20032004200520062007 2008 2009Graduation year201020112012Included districts' RMSPE are within 1.25 times KPS's KPS is shown in bolded black172013
Appendix Figure C3: Enrollment in non-Promise 4-year within 6 months of HS graduationSynthetic Control: KPS0Percentage points.2Enrollment in other 4 year within 6 months20032004200520062007 2008 2009Graduation yeartreated unit2010201120122013synthetic control unit-.2-.10Percentage points.1.2Enrollment in other 4 year within 6 months20032004200520062007 2008 2009Graduation year2010201120122013Included districts' RMSPE are within 100 times KPS's KPS is shown in bolded black0-.1-.2Percentage points.1Enrollment in other 4 year within 6 months20032004200520062007 2008 2009Graduation year201020112012Included districts' RMSPE are within 1.25 times KPS's KPS is shown in bolded black182013
Appendix Figure C4: Enrollment in Promise 4-year within 6 months of HS graduationSynthetic Control: KPS.4.35.3.25Percentage points.45Enrollment in public 4 year within 6 months20032004200520062007 2008 2009Graduation yeartreated unit2010201120122013synthetic control unit.20-.2Percentage points.4Enrollment in public 4 year within 6 months20032004200520062007 2008 2009Graduation year2010201120122013Included districts' RMSPE are within 100 times KPS's KPS is shown in bolded black-.2-.10Percentage points.1.2Enrollment in public 4 year within 6 months20032004200520062007 2008 2009Graduation year201020112012Included districts' RMSPE are within 1.25 times KPS's KPS is shown in bolded black192013
Appendix Figure C5: Any degree completion within six years of HS graduationSynthetic Control: KPS.38.36.34.32Percentage points.4Degree completion within 6 years2003200420052006Graduation yeartreated unit20072008synthetic control unit-.2-.10Percentage points.1.2Degree completion within 6 years2003200420052006Graduation year20072008Included districts' RMSPE are within 100 times KPS's KPS is shown in bolded black-.2-.10Percentage points.1.2Degree completion within 6 years2003200420052006Graduation year20072008Included districts' RMSPE are within 1.25 times KPS's KPS is shown in bolded black20
Appendix Figure C6: Bachelor’s completion within six years of HS graduationSynthetic Control: KPS.32.3.28Percentage points.34Bachelor's completion within 6 years2003200420052006Graduation yeartreated unit20072008synthetic control unit0-.1-.2Percentage points.1.2Bachelor's completion within 6 years2003200420052006Graduation year20072008Included districts' RMSPE are within 100 times KPS's KPS is shown in bolded black.050-.05-.1-.15Percentage points.1Bachelor's completion within 6 years2003200420052006Graduation year20072008Included districts' RMSPE are within 1.25 times KPS's KPS is shown in bolded black21
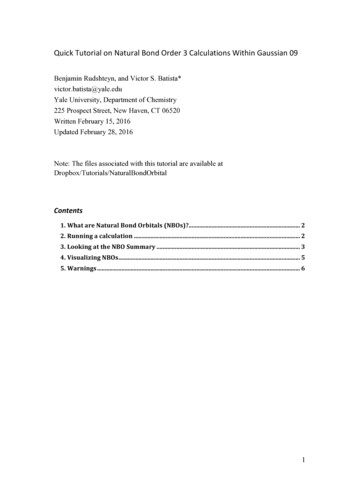
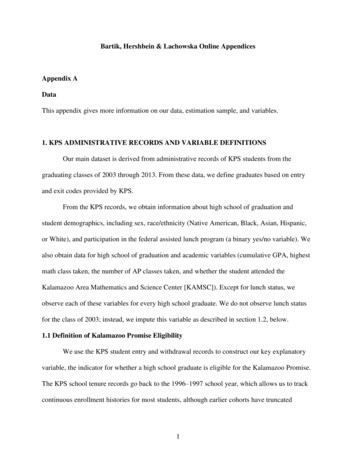
Appendix DOther ResultsThis appendix presents further results that include figures presenting the OLS-estimatedcounterparts to the IV-estimates presented in Figures 2–3 and the OLS-estimated counterparts ofthe heterogeneity results presented in Table 7.Figure D1 Fitted Probabilities of 4-Year College Attendance Within Six Months TE: The plotted values represent fitted probabilities of attending a four-year college within six months of highschool graduation, by class year and Promise eligibility, allowing Promise effects to vary by year. The vertical blackline indicates when the Promise began. Prior to 2006, eligibility is based on Promise rules has the Promise been ineffect at the time (rules-based eligibility). After 2006, eligibility is taken from administrative records from theKalamazoo Promise (observed eligibility). Point-wise 95-percent confidence intervals are shown for the differencebetween eligible and ineligibles.22
Figure D2 Fitted Probabilities of Any Credential Attainment Within Six Years 62007Eligibles2008NOTE: The plotted values represent fitted probabilities of attaining any credential within six years of high schoolgraduation, by class year and Promise eligibility, allowing Promise effects to vary by year. The vertical black lineindicates when the Promise began. See notes to Figure D1. Point-wise 95-percent confidence intervals are shown forthe difference between eligible and ineligibles.23
Table D1Promise OLS Effects by Group6-month attendanceat 4-year6-year BA/BS attainment6-year credential psincomeincomeincomeincomeincomeincomeAfter 591,6411,259p-val of group diff0.5240.4660.498Mean WhiteNon-whiteWhiteNon-whiteAfter 01,5451,360p-val of group diff0.7910.5990.142Mean leFemaleMaleFemaleAfter ,5171,3881,517p-val of group diff0.6390.1440.0353Mean DV0.4000.4050.2950.3040.3640.357NOTE: Standard errors robust to heteroskedasticity are in brackets. *** , **, and * indicates p less than 0.01, 0.05,or 0.10. Timing is since high school graduation. All regressions include dummies for after the Promise’sintroduction, individual (pseudo-) eligibility, and graduation year. Other controls are sex, race/ethnicity,free/reduced-price lunch status, and high school of graduation-by-graduation year (except when subgroup isrestricted on one of these dimensions). Prior to 2006, eligibility is based on Promise rules has the Promise been ineffect at the time (rules-based eligibility). After 2006, eligibility is taken from administrative records from theKalamazoo Promise (observed eligibility). The income groupings pertain to whether the student is eligible forfree/reduced price lunch or not. The race groups are white non-Hispanic versus other groups. The mean of thedependent variable for each group is calculated over the eligible population in the pre-Promise period.24
Appendix EPromise Analysis Restricted to Seventh–Ninth Grade Entrant EligiblesIn this appendix, we present IV estimates in which we restrict the sample of eligiblestudents to those entering KPS in seventh through ninth grade (rather than all students whoentered before tenth grade). As the ineligible group consists of students who first entered in tenthgrade or later, by making the eligibles a group of earlier movers (rather than long-term KPSstudents), the intent of this restriction is to make the eligible group more comparable to theineligible group. However, in practice, this restriction makes the eligible and ineligible groupsless comparable. Students who enter KPS at ninth grade come disproportionately from privateschools, since there are few private high schools in the Kalamazoo area. As a result, the seventhto ninth grade entrants are more advantaged than both students who have been in KPS for alonger time and those who entered after ninth grade.Table E1, which is the analogue to Table 2 in the main text, demonstrates this. Forexample, note the much higher fraction of Promise-eligible white students and the much lowerfraction of Promise-eligible students eligible for subsidized lunch. This sample restrictionimplies that the estimated average treatment effect of the Promise is on a more-advantagedpopulation, one that is less marginal on many college success measures and one that is notrepresentative of the actual treated population. Additionally, the restriction diminishes thesample size of the eligible group dramatically, hurting precision. We thus believe that estimatesbased on this sample are less compelling in calculating an average treatment effect.It is therefore not surprising that in subsequent Tables E2–E6 almost all Promise effectsare severely attenuated, except for s
Bartik, Hershbein & Lachowska Online Appendices Appendix A Data This appendix gives more information on our data, estimation sample, and variables. . For the graduates from the classes of 2003 through 2013, eligibility equals one if the student would have been eligible for any tuition subsidy (65 percent or more) if he or she resided .