Transcription
PAGE TITLE HEREUnderstanding microbusinesses in Northern IrelandERC Research ReportNovember 20181
Understanding micro-businesses in NorthernIrelandNola Hewitt-DundasQueen’s Management School and the Enterprise Research CentreNm.hewitt-dundas@qub.ac.ukStephen RoperWarwick Business School and the Enterprise Research CentreStephen.roper@wbs.ac.ukThe Enterprise Research Centre is an independent research centre which focusses onSME growth and productivity. ERC is a partnership between Warwick Business School,Aston Business School, Queen’s University School of Management, Leeds UniversityBusiness School and University College Cork. The Centre is funded by the Economicand Social Research Council (ESRC); Department for Business, Energy & IndustrialStrategy (BEIS); Innovate UK, the British Business Bank and the Intellectual PropertyOffice. The support of the funders is acknowledged. The views expressed in this reportare those of the authors and do not necessarily represent those of the funders.2
ACKNOWLEDGEMENTThe authors are pleased to acknowledge financial support from the Economic andSocial Research Council for the Micro-business Britain Survey on which this report isbased. Katherine Hathaway, Jane Bourke (UCC and ERC) and Mark Hart (Aston andERC) made important contributions to the success of the survey fieldwork.ABOUT THIS REPORTThis report represents a collaboration between Queen’s University ManagementSchool and the UK Enterprise Research Centre. The production of the report wasfunded by the Department for the Economy Northern Ireland and Invest NorthernIreland. Views in the report are those of the authors alone and do not necessarilyreflect those of the sponsoring organisations.3
EXECUTIVE SUMMARYDrawing on new survey data this report provides a profile of micro-businesses with 1-9employees in Northern Ireland in comparison to UK regional, Irish and US benchmarks.The report provides the first evidence on levels of business ambition, resilience anddigital adoption for this group of firms. The Micro-business Britain Survey covered6,200 firms in the UK - 495 in Northern Ireland – 1,500 companies in Ireland and 2,000in the US.There are currently around 28,500 micro-businesses employing around 111,000people (19.7 per cent of the workforce) in Northern Ireland. In 2017 these firmsgenerated sales of 10.4bn, 17.2 per cent of that by all NI firms.The survey paints a detailed picture of the micro-business sector in Northern Irelandand suggests that: Most micro-businesses are very small, having average employment of 3.3. Mostare well established having traded for an average of 29 years and over thisperiod have provided the basic income for the founding family. This householdbusiness link is crucial to understanding these firms. 78 per cent of micro-businesses in NI are family-owned and in the vast majorityof cases the founder is still involved in the business. Around half of all microbusinesses in NI are home-based. Family-ownership is more important inNorthern Ireland than elsewhere. Four-fifths of NI micro-businesses said their key priority was to ‘keep theirbusiness similar to how it operates now’. Only around a fifth of business leadersaim to build a ‘national or international business’. For most of these firmsstability dominates growth in terms of ambition. 90 per cent of micro-businesses in NI traded profitably over the year prior to thesurvey with around 1:3 micro-businesses reporting international sales. 46 percent of firms reported using sources of external finance.Ambition77 per cent of NI micro-business owners see it as ‘important’ or ‘very important’ to‘keep their business similar to how it operates now’, and a more ambitious 18 per centof all respondents aim to build a ‘national or international business’. Other moreoperational aspirations – employee engagement, HR practices, social benefits - fall4
between these two extremes with 38 per cent of all micro-business owners in NorthernIreland aiming ‘to grow their business rapidly and profitably with a view to exit’. Overall,levels of business ambition are broadly similar in Northern Ireland and other parts ofthe UK.Individuals’ personal ambitions suggest a marked emphasis on the ‘freedom’ and‘flexibility’ which comes from being your own boss. Aside from ‘freedom’ and ‘flexibility’micro-business owners in Northern Ireland place a high priority on ‘building a businessto hand on to my family’ with 54 per cent of business owners in the region regardingthis as important.Finance and exporting39 per cent of NI firms were taking advantage of funding from external lenders, thehighest proportion of firms in any UK region, although well below the 47 per cent offirms in Ireland which reported using external finance from banks or other lenders. Afurther 6 per cent of firms in NI were taking advantage of funding from friends or family.On average, Micro businesses in Northern Ireland derive 10% of their sales fromexport markets. This is marginally higher than the UK average of 9% and slightly belowthat of similar firms in Ireland.Innovation and digital adoption27 per cent of NI micro-businesses reported introducing a new or significantly improvedproduct or service over the three years prior to the survey compared to 32.5 per cent inthe UK as a whole. This level of innovative activity in NI was the lowest of any UKregion and significantly lower than that in micro-businesses in Ireland (40 per cent) andthe US (36 per cent). In terms of organisational innovation, the gap between theproportion of innovating firms in NI and the UK was greater – 13 per cent in NorthernIreland compared to 23 per cent in the UK as a whole.There is little difference in the adoption of CAD and E-commerce between firms in NI,Ireland and GB. For CRM, Web-based Accounting and Cloud Computing adoptionrates in NI lag those in other areas. In terms of newer technologies – AI and machinelearning – adoption levels in NI are broadly in line with those elsewhere although thenumber of firms reporting adopting both technologies remains small.5
Resilience and barriers to growthThe barrier to success most frequently cited by Northern Ireland micro-businesses wasthe extent of competition in the market (48 per cent). Between a third and a half ofNorthern Ireland micro-businesses stated that competition, the extent of regulations orred tape and late payment by customers were significant barriers.The overall profile of resilience strategies adopted by micro-businesses in NI, GB andIreland is relatively similar. Around a quarter of firms deal with challenges when theyarise, a quarter adopt risk mitigating strategies, and around 1: 10 have a formal riskregister.Future research directionsThree main themes emerge from our analysis of micro-businesses in Northern Irelandand comparator areas and could provide the focus for further research:1. How are business ambition and performance related to the characteristics ofowner-managers?– how do the life-stage and characteristics of micro-businessowners shape their level of ambition? How do individuals’ characteristics influenceattitudes to using external finance or undertaking risky innovation? The Micro-businessBritain survey contains detailed information on the characteristics and households ofowner-managers and this data could be analysed alongside that for each firm.2. What drives growth and productivity in micro-businesses? – how do innovation,skills, finance and ambition come together to drive growth in micro-businesses? Whichof these is most important and how do these factors work together? There has beenlittle previous analysis of the drivers of growth in micro-businesses. This analysis wouldadopt a multi-variate modelling approach to the Micro-business Britain data allowingthe strength of each influence to be identified.3.How does the local business eco-system influence micro-businessperformance? – some performance gaps have been identified between microbusinesses in NI and elsewhere. Are these due to structural factors (firm size, sector,ownership) or do they reflect aspects of the business eco-system in NI and elsewhere?This analysis would exploit the international and multi-regional nature of the Microbusiness Britain data along with other local eco-system characteristics.6
CONTENTSACKNOWLEDGEMENT . 3ABOUT THIS REPORT . 3EXECUTIVE SUMMARY. 41. INTRODUCTION . 82. BUSINESS AND PERSONAL AMBITION . 143. USING EXTERNAL FINANCE . 184. EXPORTING AND INNOVATION . 225. ADOPTION . 286. BUSINESS CHALLENGES AND RESILIENCE . 317. FUTURE RESEARCH DIRECTIONS . 347
1. INTRODUCTIONMicro-businesses – defined as having between one and nine employees – play asignificant role in all economies both as an employer and source of future growth. InNorthern Ireland in 2017 there were 28,500 micro-businesses employing around111,000 people (19.7 per cent of the workforce) and generating sales of 10.4bn, 17.2per cent of that by all NI firms. More generally, across the UK there were 1.11m microbusinesses in 2017, employing around 4.09m people (17.6 per cent of the workforce)and generating 552bn in sales, 14.7 per cent of that by all UK firms 1 . Microbusinesses include local plumbers, builders, hairdressers and mechanics. They arealso our architects, designers, artisans, lawyers and accountants.Most micro-businesses start small and stay small. For other entrepreneurs their microbusiness is the launchpad for scale-up. Or, at least, the test-bed for a new businessidea or innovation. The Micro-business Britain Survey (Annex 1) on which this report isbased was designed to shed new light on this diverse segment of the SME populationin the UK. This is important because micro-businesses are often excluded from othernational and international surveys which might help us understand what drives theirgrowth and productivity. For example, we know very little about the nature of innovationactivity in micro-firms as firms with less than 10 employees are excluded from theflagship UK Innovation Survey. Similarly, micro-businesses are also excluded from theOECD Digital Adoption survey so – until now – we have known very little about theadoption of new technologies by micro-firms.The Micro-business Britain project therefore addresses important gaps in ourunderstanding relating to innovation, technology adoption and productivity. It alsofocuses attention on the individuals – or more correctly the households – which areclosely linked to many micro-businesses. What shapes their level of ambition forgrowth or productivity improvement? How does this influence their investment orengagement with external finance providers? To enrich this insight the UK survey –which covered 6,200 firms in all parts of the UK and 495 firms in Northern Ireland –was accompanied by smaller benchmark surveys of micro-businesses in Ireland(1,500) and the US (2,000).1Business Population Estimates for the UK and regions 2017, BEISTable A, page 3. uk/government/uploads/system/uploads/attachment data/file/663235/bpe 2017 statistical release.pdf.8
On average micro-businesses in Northern Ireland have average employment of 3.3and have been operating for 28.7 years (Table 1.1). Around half (48.8 per cent) of allmicro-businesses in NI are home-based, a slightly smaller proportion than that in otherUK regions. 78 per cent of micro-businesses are family-owned and in four out of fivethe founder is still involved in the business. Typically, however the founder is not theonly member of the firms’ leadership team which in most regions has 1.9-2.1 memberson average (Table 1.1).Table 1.1: Profiling micro-businesses across UK regions and comparator areas%Age of %%founderSizeofEmployment business dinvolved team (no)EastEnglandof3.522.851.071.981.81.9East .62.12.1North EastNorth uth EastSouth st .984.92.01.8USA3.519.241.371.095.21.9Source: Micro-business Britain Survey, observations are weighted to providerepresentative results for each area.Perhaps the most noticeable contrast between micro-businesses in Northern Irelandand those elsewhere in the UK is in terms of family ownership. In NI, 78 per cent ofmicro-businesses are family-owned compared to 70 per cent in the UK as a whole andonly 58 per cent in London. The profile of micro-businesses in Northern Ireland isrelatively similar to that in Ireland although compared to the US the level of familyownership is higher and the continued involvement of the founder lower. In the US, 959
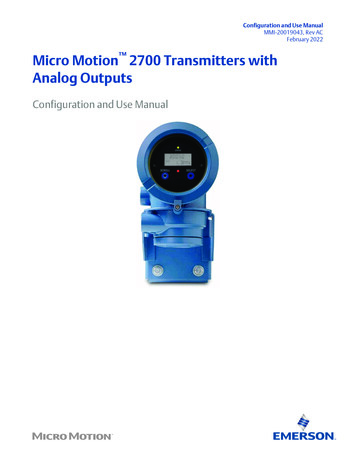
per cent of micro-businesses still involve the founder (NI, 80 per cent).Despite broadly similar average levels of employment (Table 1.1), significantdifferences in average turnover been micro-businesses in different areas are observed.(Figure 1.1). Firms in Northern Ireland reported average turnover of 673k, close to theUK average of 670k and significantly above that in some other regions (Scotland, theNorth East). Micro-businesses in Ireland had slightly higher average turnover at currentexchange rates of 687k.Figure 1.1: Average turnover of micro-businesses: by areaAverage sales growth in the year prior to the survey (2017-18) also varied significantlyby area and region. Again, micro-businesses in NI reported growth of 2.6 per cent,close to the UK average of 2.8 per cent but below the 3.2 per cent achieved in Ireland(Figure 1.2). Around 90 per cent of micro-businesses in NI traded profitably over thisperiod, the highest proportion of any UK region, and a notably higher proportion than ineither Ireland or the US (Figure 1.3). It is possible that this is linked to the higheraverage age and higher share of family owned micro-businesses in Northern Irelandcompared to other areas.10
Figure 1.2: Average turnover growth: by areaFigure 1.3: Percentage of firms reporting profitability: by area11
In the Micro-business survey firms were also asked whether they had ‘sales tointernationally-based customers either B2B or direct to consumers’. Around 1:3 microbusinesses in Northern Ireland reported trading internationally, a slightly higherproportion than that in the UK as a whole but lower than the 40.7 per cent of Irishmicro-businesses reporting international sales (Figure 1.4). Northern Ireland firms weremore likely to report international sales than those in most other UK regions with theexceptions of London and the North East. In part this may reflect the unique position ofNorthern Ireland as the only part of the UK with a land border to another EU country.Figure 1.4: Percentage of exporting micro-businesses: by areaOne factor often linked to growth in smaller firms is their use of external finance frombanks or other lenders. 46 per cent of Northern Ireland micro-businesses reportedusing external finance in the year prior to the survey, the highest percentage in any UKregion, and a significantly higher level than the 39 per cent across the UK as a whole(Figure 1.5). Micro-businesses in Ireland, however, (53 per cent) were even more likelyto be drawing on external finance.12
Figure 1.5: Percentage of firms using external finance: by areaComparing some of these key indicators by sizeband and ownership suggests thecommonality of some firm characteristics (exporting, use of external finance) and alsosome contrasts in growth performance. Turnover and employment growth particularlyappear stronger in slightly larger (5-9 employee), non-family owned firms in NorthernIreland (Table 1.2).Table 1.2: Breakdown of key indicators for NI micro-businessesTurnoverEmploymentUse ofExportinggrowthgrowthexternal(% firms)(avg)(avg)finance (%)A. By ily39.74.46.845.0Family-owned34.62.11.846.5All firms35.72.62.946.2B. By ownership13
2. BUSINESS AND PERSONAL AMBITIONPrevious research has linked owner-managers’ growth ambitions to the subsequentgrowth and performance of the firm2. In the Micro-business Britain Survey we use anew set of ambition questions which reflect the dual structure adopted in somebusiness development programmes. In the Dutch Growth Accelerator programme, forexample, attendees are asked to reflect on their own individual aspirations for thefuture and separately on their aspirations for the future of their business3. Given thenature of micro-businesses these two sets of aspirations are often strongly interlinkedbut for many owner-managers their aspirations for the business will be a meanstowards a more personal ambition.Looking first at respondents’ aspirations for their micro-business we consider theproportion of respondents ranking each aspiration as ‘important’ or ‘very important’.This suggests a sharp distinction between 77 per cent of NI respondents’ who aim to‘keep their business similar to how it operates now’, and a more ambitious 18 per centof all respondents who aim to build a ‘national or international business’ (Figure 2.1).Other more operational aspirations – employee engagement, HR practices, socialbenefits - fall between these two extremes with 38 per cent of all micro-businessowners in Northern Ireland aiming ‘to grow their business rapidly and profitably with aview to exit’ (Figure 2.1).Overall, the profiles of business ambition are broadly similar in Northern Ireland andother areas. Micro-business owner-managers in Northern Ireland are, however, lesslikely than those in other areas to aim to ‘build a national or international business’. Anotable contrast between the US and the UK and Ireland is also the proportion of firmswhich aim to ‘grow rapidly with a view to exit’: 58 per cent in the US compared to 30-40per cent across the UK and Ireland (Figure 2.1).2Hermans, J., Vanderstraaeten, J., Van Witteloostuijn, A., Dejardin, M., Ramdani, D., & Stam,E. (2015). Ambitious entrepreneurship: a review of growth aspirations, intentions andexpectations. In Entrepreneurial growth: individual, firm and region (Vol. 17, pp. 127-160).3 OECD. (2012). An International Benchmark analysis of public programmes for high growthfirms’. Paris.14
Turning to individuals’ personal ambitions suggest a rather different set of priorities,with a marked emphasis on ‘freedom’ and ‘flexibility’ (Figure 2.2). This is consistentwith much of the research literature on self-employment and entrepreneurship whichstresses the financial as well as the non-financial benefits of being your own boss. Thefinancial aspect of running a business proves important for some however with 37 percent of all business owners in Northern Ireland regarding it as important ‘to build greatwealth or a very high income’ (US 63 per cent). Aside from ‘freedom’ and ‘flexibility’micro-business owners in Northern Ireland place a high priority on ‘building a businessto hand on to my family’ with 54 per cent of business owners in the region regardingthis as important (Figure 3.2). This undoubtedly reflects the relatively high level offamily ownership of micro-businesses in Northern Ireland noted earlier (Table 1.1).Figure 2.1: Indicators of business ambition15
Figure 2.2: Indicators of personal ambitionFocussing in more detail on two of the key business ambition metrics, Figures 2.3 and2.4 compare levels of business ambition in Northern Ireland to other UK regions. Theproportion of micro-business owners in Northern Ireland seeking to grow a national orinternational business – 18 per cent – is around 4 percentage points below that in theUK as a whole. The UK average is however influenced significantly by particularly highlevels of ambition in London and ambition levels in Northern Ireland are broadly in linewith the UK outside London. There is a more significant ambition gap between firms inNorthern Ireland, Ireland and the US, however (Figure 2.3). Conversely, NorthernIreland has one of the highest proportions of owner-managers seeing ‘keeping thebusiness as it is now’ as their most important priority (Figure 2.4).16
Figure 2.3: Desire to grow a national or international business: by areaFigure 2.4: Desire to keep the business the same as it is now: by area17
Looking more closely at micro-businesses in Northern Ireland, the broad profile ofbusiness ambition is consistent across both firm sizebands and ownership (Table 2.1).For each group the most common motivation remains (for around three-quarters offirms) maintaining the status quo, with around 1:5 businesses seeking growth tonational or international status. Perhaps unsurprisingly larger firms and family-ownedbusinesses are marginally more likely to emphasise the importance of moreprofessional HR practices, employee engagement and environmental factors (Table2.1).Table 2.1: Business ambition in Northern Ireland: by sizeband and ownershipNo. of employeesOwnership1-45-9FamilyNon-familyTo build a national and/orinternational business17.520.716.818.4To keep my business similar to howit operates now77.873.979.176.4To grow my business rapidly andprofitably with a view to .549.157.353.550.2To develop more professional HRpractices in the businessTo create a culture of employeeengagementTo increase the social andenvironmental benefits of thebusiness3. USING EXTERNAL FINANCEExternal finance often enables investment and growth in smaller companies but ownermanagers are often reluctant to engage with finance providers fearing debt and, whereequity is involved, dilution of ownership. Indeed, evidence from the SME FinanceMonitor suggests that since 2011 the proportion of SMEs seeking external finance hasdeclined monotonically year-on-year. Discouraged borrowing may be one factor herealongside the legacy of poor banking practice and relationships during the recessionperiod4.4Kon, Y., & Storey, D. J. (2003). A Theory of Discouraged Borrowers, Small BusinessEconomics, 21, 37-49. Fraser, S (2014) ‘Back to borrowing? Perspectives on the ‘arc ofdiscouragement’, ERC White Paper, No. 8.18
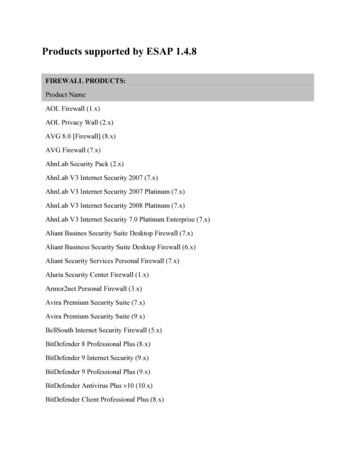
The Micro-business Britain survey suggests that around 7 per cent of UK firms wereusing external finance provided by friends or family (Figure 3.1), while another 31 percent were using bank lending or other external finance (Figure 3.2). Finance fromfamily, friends was marginally less common in Northern Ireland 6 per cent, while 39 percent of NI firms were taking advantage of funding from external lenders. This was thehighest proportion of firms in any UK region although well below the 47 per cent offirms in Ireland which reported using external finance from banks or other lenders(Figure 3.2). Firms in the US reported particularly high levels of funding from friendsand family (Figure 3.1).Figure 3.1: Using external finance from friends, family etc.19
Figure 3.2: Using external finance from banks or other lendersWhile Northern Ireland has the highest proportion of micro-businesses currentlyaccessing bank finance the proportion of firms in the region seeking additional financehas been the lowest of any UK region over the last year (Figure 3.3). At 8 per cent theproportion of NI micro-businesses seeking additional finance was also below that inIreland (13 per cent) and the US (10 per cent).20
Figure 3.3 sought additional finance during the last yearLarger micro-businesses, and those in the production sector and non-family ownershipwere more likely to be using family and friends finance (Table 3.1). In terms of bankborrowing, the key difference was between the production and services sectors usedby 48 per cent of production companies and 35 per cent of services businesses.Family-owned, production, and larger businesses were more likely to have soughtadditional external finance during 2017.Table 3.1: External finance in Northern Ireland: by size, sector and ownershipUsing financefrom family andfriends (% firms)Borrowingfrom banks orother providers(% firms)Sought additionalfinance during theyear (% .3Services5.334.77.7Non family7.839.06.2Family5.839.48.4A: By sizebandB: By industryC. By ownership21
4. EXPORTING AND INNOVATIONInnovation and exporting both have the capacity to enable firms to increase productivityand growth. Innovation, many enable firms to achieve a position of leadership throughtechnology or best practice in the markets they serve. Exporting may complimentinnovation, allowing firms to spread the cost of developing new products or servicesacross larger sales volumes 5 . Firms in Northern Ireland have particular exportopportunities due to the land border with Ireland. Existing relationships may howeverbe challenged by Brexit depending on the nature of the final settlement. Whatever thenature of the final Brexit settlement however, innovation will remain key to firms’continuing competitiveness.Previously studies of innovation in micro-businesses in Northern Ireland have stressedthe importance of innovation for growth and the importance for innovation itself ofcollaboration. Micro-businesses may have limited internal technical and managerialresources and collaboration with universities, other businesses or consultants mayallow access to otherwise unavailable resources6.We begin this section with a focus on exporting before moving on to consider levels ofinnovative activity in Northern Ireland micro-businesses.On average, micro-businesses in Northern Ireland derive 10% of their sales fromexport markets (Figure 4.1). This is marginally higher than UK average of 9% andsignificantly greater than some other regions such as Scotland, the West Midlands, andthe North West, often seen as strong industrial regions within the UK. Having said this,levels of export sales among micro-businesses in Northern Ireland lag marginallybehind those of similar firms in Ireland. Export sales in Northern Ireland are higheramong slightly larger firms, among firms in the production industries and in familyowned firms (Table 4.1).5Love, J. H., & Roper, S. (2015). SME innovation, exporting and growth: A review of existingevidence. International Small Business Journal, 33(1), 28-48. doi:10.1177/02662426145501906 Department of Enterprise, (2014). Innovation survey of micro-businesses in Northern Ireland.Belfast. Roper, S., & Hewitt-Dundas, N. (2017). Investigating a neglected part of Schumpeter'screative army: what drives new-to-the-market innovation in micro-enterprises? Small BusinessEconomics, 49(3), 559-577. doi:10.1007/s11187-017-9844-z22
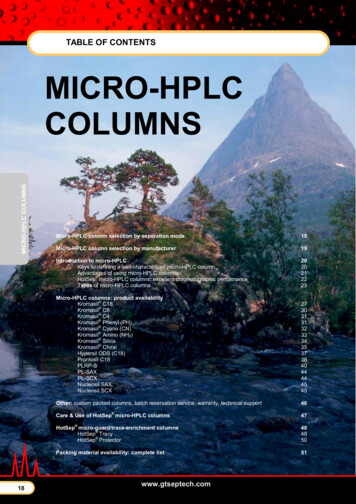
Figure 4.1: Percentage of sales derived from international marketsTable 4.1: Percentage of sales derived from exporting: Northern IrelandPercentage of sales derivedfrom exports%A. By sizeband1-4 employees5-9 employees9.911.8B. By sectorProductionServices11.49.6C. By ownershipNon-familyFamily9.610.5Turning to innovation we consider two indicators relating to whether micro-businessesintroduced new or improved products or services over the three years prior to thesurvey or new business models or forms of organisation (Figure 4.2). On both metricsmicro-businesses in Northern Ireland lag those in other areas although the gap is23
somewhat larger in terms of organisational innovation. 27 per cent of NI microbusinesses reported introducing a new or significantly improved product or service overthe three years prior to the survey compared to 32.5 per cent in the UK as a whole.This level of innovative activity in NI was the lowest of any UK region and significantlylower than that in micro-businesses in Ireland (40 per cent) and the US (36 per cent).In terms of organisational innovation, the gap between the proportion of innovatingfirms in NI and the UK was greater – 13 per cent in Northern Ireland compared to 23per cent in the UK as a whole. Again, levels of organisational innovation in NI microbusinesses lagged those in all UK regions and the international benchmarks. In Irelandthe proportion of firms undertaking organisational innovation was around twice that inNorthern Ireland (Figure 4.2).The relatively low level of innovation activity in Northern Ireland micro-businesses isreflective of other recent evidence. The UK Innovation Survey 2017 suggests that theproportion of all firms in the Northern Ireland economy which were ‘innovation active’was the lowest of any UK region7.Figure 4.2: Percentage of micro-businesses undertaking k/government/uploads/system/uploads/attachment data/file/700472/ukis 2017 headlines final.pdf24
The relatively low proportion of micro-businesses in Northern Ireland which areinnovating is also reflected in another key indicator of innovation – the proportion ofsales derived from innovative products or services (Figure 4.3). This measure providesan indication of the extent to which firms are able to derive sales from new products orservices – a measure of innovation success. In the year prior to the survey NI firmsderived around 7 per cent of their sales from innovative products/services compared to9 per cent for the UK as a whole and 11 per cent in Ireland. Northern Ireland againlagged all other UK regions on this metric.Figure 4.3: Percentage of sales from in
micro-businesses in NI are home-based, a slightly smaller proportion than that in other UK regions. 78 per cent of micro-businesses are family-owned and in four out of five the founder is still involved in the business. Typically, however the founder is not the only member of the firms' leadership team which in most regions has 1.9-2.1 members