Transcription
LIFE IN HAMPTON ROADS2021The 12th Annual Life in Hampton Roads Survey ReportReport compiled by Dr. Tancy Vandecar-Burdin, Dr. Randy Gainey, Dr. JesseRichman, Steve Parker, Wendi Wilson-John, & James ValliereWith contributions by Dr. Joshua Behr, Dr. Jennifer Whytlaw, Drew Avery & Adam PyechaOLD DOMINION UNIVERSITYFor any questions concerning the data or report for the 2021 Life in Hampton Roads Survey, please contact Dr.Tancy Vandecar-Burdin (SSRC Director) at tvandeca@odu.edu.
ContentsExecutive Summary . 1Introduction & Methodology . 4Sample Demographic Coverage . 6Quality of Life. 10Quality of Life by City . 12Perceptions of the Economy . 15Employment & COVID-19 . 18Education & Public Schools . 24Health, Experiences with COVID & Vaccines . 28COVID-19 Vaccination Status . 29COVID-19 Response . 31Politics & Ethics in Government . 33Support for Marijuana Decriminalization & Casinos . 38Perceptions of the Police . 39Experiences with Police . 39Perceptions of Police. 42Perceptions of the Police by City . 45Flooding, Hurricane Evacuation, & Sheltering During COVID-19 . 47
Executive SummaryThe Social Science Research Center (SSRC) at Old Dominion University is pleased topresent the results from the 12th annual Life in Hampton Roads (LIHR) survey. The purpose ofthe survey was to gain insight into residents’ perceptions of the quality of life in Hampton Roads.It is important to note that the methodology for this year’s survey differs from previous Life inHampton Roads surveys. The first ten years of the survey were conducted using a randomsample of Hampton Roads residents via telephone. Last year state and university COVID-19restrictions did not allow for staffing of the SSRC call center during the survey period.Therefore, on-line survey panels were used to solicit respondents to complete a web-basedsurvey. This year, a mixed methods approach of telephone calls and web surveys were used toadminister the survey. Given the continued and evolving pandemic conditions in Hampton Roadsand the rest of the world, many of this year’s questions focused on residents’ experiences withand responses to continuing COVID-19 conditions.Despite the pandemic and stay-at-home restrictions, more than two-thirds of respondentsrated the quality of life in the region as excellent or good (65.4%). About one in four ratedHampton Roads’ quality of life as fair (28.5%) and 3.9% rated it as poor. Consistent withprevious years, respondents rated the quality of life in their city and their neighborhood morehighly than they did for the region as a whole. Sixty-eight percent rated the quality of life in theircity as good or excellent and 26.1% rated their city as fair. Only 4.3% rated their city’s quality oflife as poor. Neighborhood ratings of quality of life were the highest, with 79% rating theirneighborhood as excellent or good. Only 16.3% rated their neighborhood quality of life as fairand a mere 4.2% rated it as poor.1
The impacts of the pandemic are seen in responses to questions about employment andthe economy. Less than half of those responding to this year’s survey (47.8%) wereemployed full-time while another 13.3% were employed part-time. All respondentsregardless of employment status were asked if they had been laid off, furloughed or hadhours reduced because of COVID-19 conditions. Almost one-quarter (23.7%) indicatedyes. The transition to working from home during the COVID-19 pandemic was reflectedin that about one-quarter (24.2%) of respondents indicated that they are only workingfrom home (14.3%) or are working mostly from home (9.9%). Hampton Roads residents had mixed perceptions of the economy but showed someoptimism about their own financial situation. Less than half (47.5%) of those surveyedrated the economic conditions in Hampton Roads as excellent (6.5%) or good (41.0%).Respondents showed some optimism for the future, with 35.8% indicating that they thinkthey and their family will be better off financially a year from now. Just under half(48.3%) think they will be the same and only 9.2% believe they will be worse off.Residents are perhaps hopeful that the personal financial impacts of COVID-19 will beshort-lived, and the economy at large will soon get back to a sense of normalcy. Despite the COVID-19 pandemic, about three-quarters (72.3%) of Hampton Roadsresidents felt that their health in general was good (54.4%) or excellent (17.9%). Only3.8% rated their health as poor while one in five rated their health as fair (23.3%). Overhalf (51.6%) of respondents indicated that they personally knew someone who was ill asa result of COVID-19 (but not seriously ill) and one in five (20.3%) knew someone whohad died as a result of COVID-19.2
The effects of the COVID-19 pandemic were seen in the reported ways that children werebeing schooled in the spring of 2021. Over a quarter of respondents reported havingschool-aged children (26.1%). More than forty percent (44.4%) of respondents withschool-aged children reported that their children were attending public school with onlyvirtual classes and another 10.6% were home-schooled. Another 44 percent wereattending public school with at least some in-person classes. Nearly three-quarters of respondents reported being very satisfied (31.9%) or somewhatsatisfied (42.9%) with the local police. However, respondents reported negativeexperiences with police varied significantly between races. Only 9.5% of whiterespondents reported that they or someone close to them had a negative experience withpolice compared to 29.1% of black respondents and 16.9% of respondents of other races.This year’s report also includes breakdowns for many questions by race and/or city ofresidence. In some cases, there are significant differences among these groups.3
Introduction & MethodologyThe Social Science Research Center (SSRC) at Old Dominion University recently completeddata collection for the 12th annual Life in Hampton Roads (LIHR) survey. The purpose of thesurvey is to gain insight into residents’ perceptions of the quality of life in Hampton Roads andthe COVID-19 pandemic, as well as other topics of local interest such as perceptions of police,employment, and other issues. Questions were generated via email invitations to facultythroughout the University community. Questions of interest were submitted, and the overallpool of questions was narrowed down by SSRC staff and former SSRC faculty directors. Severalnew questions, particularly those focused on residents’ experiences and perceptions of COVID19, were included along with several questions from previous Life in Hampton Roads surveys.Funding for the 2021 survey was provided by the Social Science Research Center. The SSRCwould like to thank the College of Arts and Letters and the ODU Office of Research for theircontinued support of the survey. A total of 796 surveys were completed between July 12th andOctober 3rd, 2021.It is important to note that the methodology this year differs from previous Life in HamptonRoads surveys. In all years prior to 2020, we used a telephone survey methodology. In 2020,due to COVID-19 social distancing restrictions and telework directives, we employed only aweb-based survey using two panels of respondents. This year, due to continued concerns aboutsocial distancing as well as labor shortages, we used a mixed mode approach to includetelephone surveys and web-based surveys using two panels of respondents. Telephone surveys(n 160, landline and cell phones) were completed between July 12th and September 23rd. Theweb-based surveys (n 636) overlapped telephone survey attempts slightly and were completedbetween September 10th and October 3rd. The first panel was obtainedfrom Qualtrics which partners with over 20 online sample providers to supply a network ofdiverse respondents (for more information, please see ample/). Qualtrics panel participants are recruited from various sources,including website intercept recruitment, member referrals, targeted email lists, gaming sites,customer loyalty web portals, permission-based networks, and social media. The second panelwas a proprietary SSRC panel consisting of Hampton Roads residents who had previouslyparticipated in a Life in Hampton Roads telephone survey between 2014 and 2019, provided4
their email address at the end of the interview, and agreed to be contacted for future web-basedsurveys.These changes limit to some degree the ability to compare the 2020 and 2021 results with thosefrom previous years or to confidently generalize results to the Hampton Roads population as awhole. Because the online panels used for this survey (with the partial exception ofthe SSRC panel) are opt-in rather than randomly sampled, we have not calculated randomsampling-based confidence intervals for this year’s survey. Nonetheless, we note that anincreasing number of surveys have moved online in recent years, and that in many instancesuseful data has been developed despite the challenges and limitations of both telephone andonline survey research. As in previous years, responses were weighted to match city level race,age and gender demographics. Responses were also weighted based upon technologyavailability including landline versus cell phone and high-speed internet availability. Thisweighting should improve the degree to which survey data is comparable across years.5
Sample Demographic CoverageUnlike nearly all other data presented in the 2021 Life in Hampton Roads survey report,demographic data described here is presented unweighted in order to give curious readers a senseof the demographic coverage achieved by the survey. Of the 796 citizens interviewed, 59.6%were white, 28.6% were Black or African-American, and 9.9% considered themselves to beanother race/ethnicity; including 1.4% American Indian or Alaskan Native, 0.3% NativeHawaiian or Pacific Islander, 2.5% Asian, and 2.8% indicated they were multiracial. In aseparate question, 8.7% of respondents indicated that they were of Hispanic/Latino origin. Justover one-third of respondents were male (34.8%) and 63.6% were female. Almost half (47.0%)of the respondents received a high school diploma or GED, completed trade or professionalschool, or attended some college. An additional 38.3% of respondents completed anundergraduate or graduate degree. More than forty percent of respondents were married (44.3%)and 19.8% were divorced, separated, or widowed. One-quarter of those surveyed were singleand not living with a partner (24.9%) while a small portion of single people reported living witha partner (10.7%).Race or EthnicityWhiteBlack or AfricanAmericanAmerican Indian orAlaskan NativeAsianNative Hawaiian orPacific IslanderMultiracialOtherDon’t Know/RefusedGenderMaleFemaleHighest level of schoolcompletedSome grade schoolSome high Percentage34.8%63.6%Percentage0.0%3.5%6
High Some collegeAssociate’s degreeBachelor’s degreeGraduate degreeOtherDon’t Know/RefusedAgeAverage age (years)Marital StatusSingle, not living with partnerSingle, living withpartnerMarriedDivorced/separatedWidowedDon’t ge in sistent with population estimates from the census, the majority of respondents lived in threeof the seven major cities, Virginia Beach (25.6%), Norfolk (20.4%) and Chesapeake (17.5%).The majority of survey participants were employed (55.9%), 13.3% worked part-time while42.6% reported that they worked full-time. Of the remaining respondents, 25.9% were retired,8.7% were unemployed but looking for work, and 8.5% were not employed and not looking forwork. The majority of respondents reported that neither themselves, nor anyone in theirhousehold were active-duty military (87.1%). Only 8.9% of respondents were active-dutymilitary and/or had a spouse/partner that was in the military. About one-fifth (21.0%) ofparticipants reported their family household income for last year as 30,000 or less, 33.6%reported earning more than 30,000 to 75,000, while 33.5% earned more than 75,000.Respondents were also asked to identify their type of household phone usage. The vast majorityof respondents indicated that their household was cellphone only or cellphone mostly (57.9% and29.3%, respectively). Comparatively, only 11.8% of respondents said their household waslandline mostly and only 1.0% said their household was landline only.7
Which Hampton Roads city do you live Newport k6.0%Virginia Beach5.0%0.0%What is your employment status?45.0%42.6%Employed full-time40.0%Employed part-time35.0%30.0%25.9%Not employed, but lookingfor work25.0%Not employed, NOT lookingfor work20.0%15.0%10.0%5.0%13.3%8.7%Not employed, retired8.5%1.0%Don't know/Refused0.0%8
What is your annual household income?25.0%Less than 15K19.6%20.0%More than 15K to 30KMore than 30K to 50K15.0%10.0%13.3%14.0%12.8%More than 50K to 75K13.5%12.0%More than 75K to 100KMore than 100K to 150K7.7%More than 150K to 200K5.0%4.7%2.5%More than 200KDon't know/Refused0.0%9
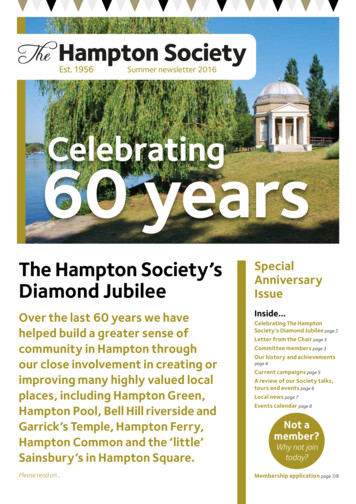
Quality of LifeAlmost two-thirds of respondents rated the quality of life in the region as excellent or good(65.4%). This is slightly lower than in previous, non-COVID years (ranging from 68% to 71%between 2017-2019). About 28% rated Hampton Roads’ quality of life as fair (28.5%) and 3.9%rated it as poor.Consistent with previous years, respondents rated the quality of life in their city and theirneighborhood more highly than they did for the region as a whole. Just over 68% rated thequality of life in their city as good or excellent (68.6%) and 26.1% rated their city as fair. Only4.3% rated their city’s quality of life as poor.10
How would you rate the overall quality of life inyour .0%Fair26.1%Poor17.3%Don't know/Refused4.3%0.9%0.0%Neighborhood ratings of quality of life were the highest, with 79% rating their neighborhood asexcellent or good. Only 16.3% rated their neighborhood quality of life as fair and 4.2% rated it aspoor.11
Quality of Life by CityThe ratings clearly and statistically varied based on where respondents live. Across all cities,only a small percentage rated the quality of life in Hampton Roads as poor with the highestpercentage in Newport News with 11% followed by the city of Hampton with 6%. Less than 5%of residents in the other cities rated the quality of life in the area poorly. A larger proportion ofresidents rated the area as excellent with about 20% of those living in Norfolk, Virginia Beachand Suffolk reporting that the quality of life is excellent. Combining positive responses (goodand excellent), Hampton and Virginia Beach residents were the most likely to rate the regionalquality of life as excellent or good (75 and 76%, respectively). More than 60% of residents inNorfolk (62%), Chesapeake (66%), and Suffolk (68%) rated the area favorably while 58% ofPortsmouth residents and just half of Newport News residents did so (49.5%).The differences are even more pronounced, however, when looking at residents’ rating of thecity where they live. In most cities, very few people rated the quality of life as poor--less than12
1% in Virginia Beach and Chesapeake and less than 5% in Suffolk. Less than 9% rated thequality of life of as poor in Norfolk, Newport News and Hampton with only Portsmouth reachingdouble digits (16%). On the other end of the spectrum, over one-quarter of residents rated thequality of life as excellent in Virginia Beach and Suffolk while less than 10% rated the quality oflife as excellent in Portsmouth and Newport News. After combining excellent and goodresponses, over 80% of residents in Virginia Beach and Chesapeake rate the quality of lifefavorable as more than 70% of Suffolk and Hampton residents. Over half of Norfolk residentsrate their quality of life favorably while less than half of Newport News and Portsmouthresidents report that their city quality of life is excellent or good.There is considerable variation in the sociodemographic and socioeconomic conditions of theneighborhoods within each of the cities of Hampton Roads and likely in the perceived quality oflife across residents within each of the cities. When asked about quality of life in theneighborhoods they reside, responses also varied greatly across cities. Clearly though and incontrast to perception of their city or the region as a whole, respondents viewed their13
neighborhoods favorably. In none of the cities did truly negative quality of life ratings (poor) inthe neighborhood reach double digits. Furthermore, respondents across cities were more likelyto rate the quality of life in their neighborhood as excellent with only Newport News having lessthan 15%. Over one-third of residents rated the quality of life in their neighborhoods asexcellent in Suffolk, Chesapeake, and Virginia Beach. When positive responses are combined(good and excellent), well over half of residents across all cities rated the quality of life in theirneighborhood positively.Quality of Life in the Respondents' ort nia BeachPoor14
Perceptions of the EconomyHampton Roads residents had mixed perceptions of the economy but showed some optimismabout their own financial situation. Less than half (47.5%) of those surveyed rated the economicconditions in Hampton Roads as excellent (6.5%) or good (41%). More than 40% (41.4%) ratedeconomic conditions as fair and 8% rated them as poor. Interestingly, despite the impacts ofCOVID-19, these ratings are not that much different than in past years of the survey. In 2019,49.9% of respondents rated economic conditions as good or excellent. This year’s ratings areactually higher than in 2018 (45.3% rating excellent or good).When asked if they and their family were better or worse off financially compared to a year ago,24.1% reported that they were better off and 56.0% reported that they were about the same.About 18% indicated that they and their family were worse off financially. These numbers showa slightly more positive view of residents’ financial standing compared to 2020 (22.8% thoughtthey were better off and 52.9% thought they were about the same).15
Respondents showed some optimism for the future, with 35.8% indicating that they think theyand their family will be better off financially a year from now. Just under half (48.3%) think theywill be the same and less than 10% (9.2%) think they will be worse off. Residents are perhapshopeful that the worst of the financial impacts of COVID-19 will not be long-lasting.16
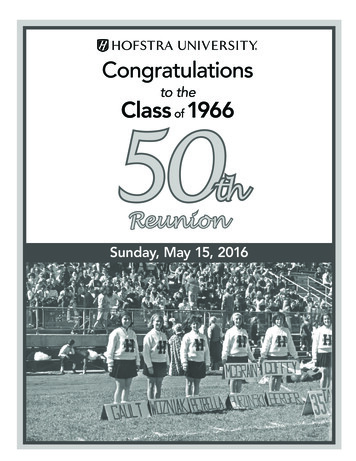
The outlook for home purchasing, however, may be less optimistic. Over 40 percent (41.3%) ofrespondents think that now is a bad time to buy a house and only 27.8% think that it is a goodtime to buy a house. One in four (25.1%) think that it is neither a good nor bad time. This is amajor shift from 2019 when over 40 percent (45.4%) thought it was a good time to buy a house.These shifting sentiments perhaps reflect data showing a decrease in home listings (supply) andan increase in prices.1Generally speaking, do you think now is a good time,a bad time, or neither a good nor a bad time to buy 0%15.0%10.0%5.8%5.0%0.0%Good timeNeither good nor badtimeBad timeDK/Refused1For example, see: oads-reports-continued-sellers-marketfor-homes/17
Employment & COVID-19As can be seen from the graph below, less than half of those responding to this year’s surveywere employed full-time (47.8%) while another 13.3% were employed part-time. Just over 20%were retired. About 9.6% were not employed but looking for work while 8.0% were notemployed and not looking for work.Employment Status60.0%Employed full-time50.0%47.8%Employed part-time40.0%Not employed, but looking forwork30.0%Not employed, NOT lookingfor work20.5%20.0%Not employed, retired13.3%10.0%9.6%8.0%Don't know/Refused0.8%0.0%Regardless of employment status, all respondents were asked if they were laid off, furloughed, orhad hours reduced at work at any time during the past year because of COVID-19 conditions.More than one in five respondents (23.7%) indicated that their employment had been impactedbecause of the pandemic.18
Regardless of your current employment status,were you laid off, furloughed, or had hoursreduced at work at any time during the past yearbecause of COVID-19 conditions?15.2%23.7%61.1%YesNoNo, retiredA third (33.3%) of Newport News respondents reported that they had been laid off, furloughed orhad hours reduced at work during the past year. More than one-quarter of respondents fromPortsmouth (30.2%), Norfolk (28.7%) and Chesapeake (25.6%) also reported they had eitherbeen laid off, furloughed or had their hours reduced. The city of Hampton had the lowestpercentage of respondents (10.7%) who reported being laid off, furloughed or had their hoursreduced.19
Respondents who indicated working full- or part-time were asked about their current workingarrangement. More than half (51.7%) indicated that they were working only outside of thehome. About 14% were working either mostly outside of the home/working occasionally fromhome. About 9-10% reported splitting time equally between working from home and workingoutside of the home or were working mostly from home/occasionally working outside of thehome. Another 14 percent (14.3%) reported working ONLY from home. These numbers reflecta partial shift back towards working away from home as pandemic restrictions have eased. In the2020 survey nearly 3 in 10 respondents (29.8%) reported working only from home, and an onlyslightly greater portion (33.2%) reported working only away from home.20
Are you currently:Other0.6%Working ONLY outside of the home51.7%Working MOSTLY outside of the home/occasionallyworking from homeSplitting time equally between working from home andworking outside of the homeWorking MOSTLY from home/occasionally workingoutside of the home14.1%9.1%9.9%Working ONLY from ents who were working at least part-time were asked to rate their level of work burnoutin their current, main job on a scale of 0 to 10 with 0 meaning “not feeling burned out at all” and10 meaning “feeling completely burned out”. The average score was 5.1 which was downslightly from 2020 (average 5.3). However, these burnout scores are both higher thanrespondents in 2019 who only averaged 4.2. Further, the percentage of those rating their burnoutscore as 10 (completely burned out) almost doubled from 2019 (5.8%) to 2021 (10%). It is likelythat the higher burnout levels in 2020 and 2021 reflect the increased stresses and challengessome respondents have experienced as a result of the pandemic.2All respondents who were not working full-time and not retired were asked about barriers thatmay be keeping them from working or working full-time. More than one in four cited concernsabout health/safety due to COVID (26.1%) and 21.3% cited not wanting to work full-time.About one in five (19%) indicated that they had a child or children who need them at home and13.8% were disabled or unable to work. Just over 13% indicated that they could not find a joband 9.1% indicated that the salary/wages offered were not sufficient.2For example, see -is-here-employee-burnout-needs-togo.html21
Those respondents who indicated more than one barrier to full-time employment were askedwhich barrier was the most significant. About 42 percent (42.1%) indicated that concerns abouthealth and safety due to COVID-19 was the most significant barrier.What barriers have you faced that are keeping you fromworking full-time?30.0%I don't want to work full-time26.1%Disabled/Unable to work25.0%21.3%Concerned about health/safetywith COVID19.0%20.0%17.4%15.0%13.8%Have child/children who need meat homeCan't find a job13.4%Better off not working givencurrent unemployment benefits9.1%10.0%6.7%5.0%2.8%Salary/wages offered are notsufficientOtherPrefer not to answer0.0%22
Which of those barriers would you say was the mostsignificant?45.0%42.1%I don't want to work full-time40.0%Disabled/Unable to work35.0%30.0%Concerned about health/safetywith COVID25.0%Have child/children who need meat homeCan't find a job20.0%13.6%15.0%10.0%14.6%12.9%6.9%6.6%Better off not working givencurrent unemployment benefitsSalary/wages offered are notsufficientOther5.0%1.5%1.8%0.0%This data has important implications for labor market supply in Hampton Roads. Theunemployment rate in Virginia was only 3.6% in Virginia in October 2021, and the labor forceparticipation rate of 63% was well below pre-pandemic levels.3 As a result, employers in thestate – as with employers nationwide – reported difficulties finding workers, and policymakershave struggled to find a solution. These survey results suggest that reduced concern about theCOVID-19 pandemic would increase labor supply, followed by improvements to childcareavailability.3For example, see https://fred.stlouisfed.org/series/LBSSA5123
Education & Public SchoolsAbout one in four (26.1%) of respondents reported having a school-aged child/children and17.7% of those parents indicated they had a school-aged child with a disability. Those withschool-aged children were asked where/how their children were attending school in the spring of2021 given COVID-19 conditions. Similar percentages of parents reported that their childattended public school with only virtual classes (44.4%) or attended public school with at leastsome in-person classes (44%). About 10 percent (10.6%) indicated that their child was homeschooled and 8.7% indicated that their child/children attended private school with at least somein-person classes.Do you have school-agedchildren?Do any of your school-agedchildren have a disability?1.0%1.1%17.7%Yes26.1%No81.3%72.8%Prefer not toanswerYesNoRefused24
During the spring of 2021, were your school-aged childrenin:Home schoolPrivate school with only virtual classes10.6%0.5%Private school with at least some in-person classes8.7%Public school with only virtual classes44.4%Public school with at least some in-person classes44.0%0.0% 6.0% 12.0% 18.0% 24.0% 30.0% 36.0% 42.0% 48.0%Those respondents with school-aged children were asked to compare the quality of educationtheir children received since the pandemic began to prior to COVID-19. The majority (60%)indicated that the education their child received since the pandemic began was either much worse(25%) or a bit worse (35%) than the education received prior to the pandemic. Only 6.3% ofparents felt that the education their child received since the pandemic was a bit or much betterand 28.3% felt that the education was about the same. This continues the pattern seen in 2020when 55.9% of respondents thought that their child’s education was a bit worse or much worse.In 2021, 60.0% held this view. The increase occurred mostly among those responding that theirchild’s education was much worse (19% to 25%).25
In general, compared to the education yourchildren received prior to COVID-19, do you thinktheir education since the COVID-19 pandemicbegan has .0%25.0%28.3%5.7%5.3%0.6%Much worse A bit worseAbout thesameA bit better Much better Don't knowParents of school-aged children were asked about difficulties their child/children hadexperienced due to changes in their daily routines because of COVID-19 conditions. About14.5% of parents reported no difficulties. More than half of parents indicated that their child wasnot able to spend time with friends (56%) or had problems concentrating or focusing (51.7%).O
The Social Science Research Center (SSRC) at Old Dominion University is pleased to present the results from the 12th annual Life in Hampton Roads (LIHR) survey. The purpose of the survey was to gain insight into residents' perceptions of the quality of life in Hampton Roads.