Transcription
www.epa.govAugust 1993Method 351.2, Revision 2.0:Determination of Total KjeldahlNitrogen by Semi-AutomatedColorimetry
METHOD 351.2DETERMINATION OF TOTAL KJELDAHL NITROGEN BY SEMIAUTOMATEDCOLORIMETRYEdited by James W. O'DellInorganic Chemistry BranchChemistry Research DivisionRevision 2.0August 1993ENVIRONMENTAL MONITORING SYSTEMS LABORATORYOFFICE OF RESEARCH AND DEVELOPMENTU.S. ENVIRONMENTAL PROTECTION AGENCYCINCINNATI, OHIO 45268351.2-1
METHOD 351.2DETERMINATION OF TOTAL KJELDAHL NITROGEN BY SEMI-AUTOMATEDCOLORIMETRY1.02.03.0SCOPE AND APPLICATION1.1This method covers the determination of total Kjeldahl nitrogen in drinking,ground, and surface waters, domestic and industrial wastes. The procedureconverts nitrogen components of biological origin such as amino acids,proteins and peptides to ammonia, but may not convert the nitrogenouscompounds of some industrial wastes such as amines, nitro compounds,hydrazones, oximes, semicarbazones and some refractory tertiary amines.1.2The applicable range is 0.1-20 mg/L TKN. The range may be extended withsample dilution.SUMMARY OF METHOD2.1The sample is heated in the presence of sulfuric acid, H2SO4 for two and onehalf hours. The residue is cooled, diluted to 25 mL and analyzed forammonia. This digested sample may also be used for phosphorusdetermination.2.2Total Kjeldahl nitrogen is the sum of free-ammonia and organic nitrogencompounds which are converted to ammonium sulfate (NH4)2SO4, under theconditions of digestion described.2.3Organic Kjeldahl nitrogen is the difference obtained by subtracting the freeammonia value from the total Kjeldahl nitrogen value.2.4Reduced volume versions of this method that use the same reagents and molarratios are acceptable provided they meet the quality control and performancerequirements stated in the method.2.5Limited performance-based method modifications may be acceptable providedthey are fully documented and meet or exceed requirements expressed inSection 9.0, Quality Control.DEFINITIONS3.1Calibration Blank (CB) -- A volume of reagent water fortified with the samematrix as the calibration standards, but without the analytes, internalstandards, or surrogate analytes.3.2Calibration Standard (CAL) -- A solution prepared from the primary dilutionstandard solution or stock standard solutions and the internal standards and351.2-2
surrogate analytes. The CAL solutions are used to calibrate the instrumentresponse with respect to analyte concentration.3.3Instrument Performance Check Solution (IPC) -- A solution of one or moremethod analytes, surrogates, internal standards, or other test substances usedto evaluate the performance of the instrument system with respect to a definedset of criteria.3.4Laboratory Fortified Blank (LFB) -- An aliquot of reagent water or other blankmatrices to which known quantities of the method analytes are added in thelaboratory. The LFB is analyzed exactly like a sample, and its purpose is todetermine whether the methodology is in control, and whether the laboratoryis capable of making accurate and precise measurements.3.5Laboratory Fortified Sample Matrix (LFM) -- An aliquot of an environmentalsample to which known quantities of the method analytes are added in thelaboratory. The LFM is analyzed exactly like a sample, and its purpose is todetermine whether the sample matrix contributes bias to the analytical results.The background concentrations of the analytes in the sample matrix must bedetermined in a separate aliquot and the measured values in the LFMcorrected for background concentrations.3.6Laboratory Reagent Blank (LRB) -- An aliquot of reagent water or other blankmatrices that are treated exactly as a sample including exposure to allglassware, equipment, solvents, reagents, internal standards, and surrogatesthat are used with other samples. The LRB is used to determine if methodanalytes or other interferences are present in the laboratory environment, thereagents, or the apparatus.3.7Linear Calibration Range (LCR) -- The concentration range over which theinstrument response is linear.3.8Material Safety Data Sheet (MSDS) -- Written information provided byvendors concerning a chemical's toxicity, health hazards, physical properties,fire, and reactivity data including storage, spill, and handling precautions.3.9Method Detection Limit (MDL) -- The minimum concentration of an analytethat can be identified, measured and reported with 99% confidence that theanalyte concentration is greater than zero.3.10Quality Control Sample (QCS) -- A solution of method analytes of knownconcentrations that is used to fortify an aliquot of LRB or sample matrix. TheQCS is obtained from a source external to the laboratory and different fromthe source of calibration standards. It is used to check laboratory performancewith externally prepared test materials.351.2-3
3.114.05.06.0Stock Standard Solution (SSS) -- A concentrated solution containing one ormore method analytes prepared in the laboratory using assayed referencematerials or purchased from a reputable commercial source.INTERFERENCES4.1High nitrate concentrations (10X or more than the TKN level) result in lowTKN values. If interference is suspected, samples should be diluted andreanalyzed.4.2Method interferences may be caused by contaminants in the reagent water,reagents, glassware, and other sample processing apparatus that bias analyteresponse.SAFETY5.1The toxicity or carcinogenicity of each reagent used in this method have notbeen fully established. Each chemical should be regarded as a potential healthhazard and exposure should be as low as reasonably achievable. Cautions areincluded for known extremely hazardous materials or procedures.5.2Each laboratory is responsible for maintaining a current awareness file ofOSHA regulations regarding the safe handling of the chemicals specified inthis method. A reference file of Material Safety Data Sheets (MSDS) should bemade available to all personnel involved in the chemical analysis. Thepreparation of a formal safety plan is also advisable.5.3The following chemicals have the potential to be highly toxic or hazardous,consult MSDS.5.3.1Mercury (Sections 7.2 and 7.3)5.3.2Sulfuric acid (Sections 7.2, 7.3, and 7.4)5.3.3Sodium nitroprusside (Section 7.9)EQUIPMENT AND SUPPLIES6.1Balance - Analytical, capable of accurately weighing to the nearest 0.000l g.6.2Glassware - Class A volumetric flasks and pipets as required.6.3Block digestor with tubes.6.4Automated continuous flow analysis equipment designed to deliver and reactsample and reagents in the required order and ratios.6.4.1Sampling device (sampler)351.2-4
7.06.4.2Multichannel pump6.4.3Reaction unit or manifold6.4.4Colorimetric detector6.4.5Data recording deviceREAGENTS AND STANDARDS7.1Reagent water: Ammonia free distilled or deionized water, free of the analyteof interest. ASTM Type II or equivalent.7.2Mercuric sulfate: Dissolve 8 g red mercuric oxide (HgO) (CASRN 21908-53-2)in 50 mL of 1:4 sulfuric acid (10 mL conc. H2SO4: [CASRN 7664-93-9] 40 mLreagent water) and dilute to 100 mL with reagent water.7.3Digestion solution: (Sulfuric acid-mercuric sulfate-potassium sulfate solution):Dissolve 133 g of K2SO4 (CASRN 7778-80-5) in 700 mL of reagent water and200 mL of conc. H2SO4. Add 25 mL of mercuric sulfate solution (Section 7.1)and dilute to 1 L.Note 1: An alternate mercury-free digestion solution can be prepared bydissolving 134 g K2SO4 and 7.3 g CuSO4 in 800 mL reagent water and thenadding 134 mL conc. H2SO4 and diluting to 1 L. Use 10 mL solution per 25mL of sample.7.4Sulfuric Acid solution (4%): Add 40 mL of conc. sulfuric acid to 800 mL ofreagent water, cool and dilute to 1 L.Note 2: If alternate mercury-free digestion solution is used, adjust the abovesolution to equal the acid concentration of the digested sample (Section 11.6).7.5Stock Sodium Hydroxide (20%): Dissolve 200 g of sodium hydroxide (CASRN1310-73-2) in 900 mL of reagent water and dilute to 1 L.7.6Stock Sodium Potassium Tartrate solution (20%): Dissolve 200 g sodiumpotassium tartrate (CASRN 6381-59-5) in about 800 mL of reagent water anddilute to 1 L.7.7Stock Buffer solution: Dissolve 134.0 g of sodium phosphate, dibasic(Na2HPO4) (CASRN 7558-79-4) in about 800 mL of reagent water. Add 20 g ofsodium hydroxide and dilute to 1 L.7.8Working Buffer solution: Combine the reagents in the stated order, add 250mL of stock sodium potassium tartrate solution (Section 7.6) to 200 mL of stockbuffer solution (Section 7.7) and mix. Add xx mL sodium hydroxide solution351.2-5
(Section 7.5) and dilute to 1 L. See concentration ranges, Table 2, forcomposition of working buffer.8.09.07.9Sodium Salicylate/Sodium Nitroprusside solution: Dissolve 150 g of sodiumsalicylate (CASRN 54-21-7) and 0.3 g of sodium nitroprusside (CASRN13755-38-9 or 14402-89-2) in about 600 mL of reagent water and dilute to 1 L.7.10Sodium Hypochlorite solution: Dilute 6.0 mL sodium hypochlorite solution(CASRN 7681-52-9) (Clorox) to 100 mL with reagent water.7.11Ammonium chloride, stock solution: Dissolve 3.819 g NH4Cl (CASRN 1212502-9) in reagent water and bring to volume in a 1 L volumetric flask. 1 mL 1.0 mg NH3-N.7.12Teflon boiling chips.SAMPLE COLLECTION, PRESERVATION AND STORAGE8.1Samples should be collected in plastic or glass bottles. All bottles must bethoroughly cleaned and rinsed with reagent water. Volume collected shouldbe sufficient to insure a representative sample, allow for replicate analysis (ifrequired), and minimize waste disposal.8.2Samples must be preserved with H2SO4 to a pH 2 and cooled to 4 C at thetime of collection.8.3Samples should be analyzed as soon as possible after collection. If storage isrequired, preserved samples are maintained at 4 C and may be held for up to28 days.QUALITY CONTROL9.1Each laboratory using this method is required to operate a formal qualitycontrol (QC) program. The minimum requirements of this program consist ofan initial demonstration of laboratory capability, and the periodic analysis oflaboratory reagent blanks, fortified blanks and other laboratory solutions as acontinuing check on performance. The laboratory is required to maintainperformance records that define the quality of the data that are generated.9.2INITIAL DEMONSTRATION OF PERFORMANCE9.2.1The initial demonstration of performance is used to characterizeinstrument performance (determination of linear calibration ranges andanalysis of QCS) and laboratory performance (determination of MDLs)prior to performing analyses by this method.9.2.2Linear Calibration Range (LCR) -- The LCR must be determinedinitially and verified every 6 months or whenever a significant change351.2-6
in instrument response is observed or expected. The initialdemonstration of linearity must use sufficient standards to insure thatthe resulting curve is linear. The verification of linearity must use aminimum of a blank and three standards. If any verification dataexceeds the initial values by 10%, linearity must be reestablished. Ifany portion of the range is shown to be nonlinear, sufficient standardsmust be used to clearly define the nonlinear portion.9.2.3Quality Control Sample (QCS) -- When beginning the use of thismethod, on a quarterly basis, or as required to meet data-quality needs,verify the calibration standards and acceptable instrument performancewith the preparation and analyses of a QCS. If the determinedconcentrations are not within 10% of the stated values, performance ofthe determinative step of the method is unacceptable. The source ofthe problem must be identified and corrected before either proceedingwith the initial determination of MDLs or continuing with on-goinganalyses.9.2.4Method Detection Limit (MDL) -- MDLs must be established for allanalytes, using reagent water (blank) fortified at a concentration of twoto three times the estimated instrument detection limit.(6) To determineMDL values, take seven replicate aliquots of the fortified reagent waterand process through the entire analytical method. Perform allcalculations defined in the method and report the concentration valuesin the appropriate units. Calculate the MDL as follows:where,t S Student's t value for a 99% confidence level and astandard deviation estimate with n-1 degrees offreedom [t 3.14 for seven replicates]standard deviation of the replicate analysesMDLs should be determined every six months, when a new operatorbegins work, or whenever there is a significant change in thebackground or instrument response.9.3ASSESSING LABORATORY PERFORMANCE9.3.1Laboratory Reagent Blank (LRB) -- The laboratory must analyze at leastone LRB with each batch of samples. Data produced are used to assesscontamination from the laboratory environment. Values that exceed theMDL indicate laboratory or reagent contamination should be suspectedand corrective actions must be taken before continuing the analysis.351.2-7
9.3.2Laboratory Fortified Blank (LFB) -- The laboratory must analyze at leastone LFB with each batch of samples. Calculate accuracy as percentrecovery (Section 9.4.2). If the recovery of any analyte falls outside therequired control limits of 90-110%, that analyte is judged out of control,and the source of the problem should be identified and resolved beforecontinuing analyses.9.3.3The laboratory must use LFB analyses data to assess laboratoryperformance against the required control limits of 90-110%. Whensufficient internal performance data become available (usually aminimum of 20-30 analyses), optional control limits can be developedfrom the percent mean recovery (x) and the standard deviation (S) ofthe mean recovery. These data can be used to establish the upper andlower control limits as follows:UPPER CONTROL LIMIT x 3SLOWER CONTROL LIMIT x - 3SThe optional control limits must be equal to or better than the requiredcontrol limits of 90-110%. After each five to ten new recoverymeasurements, new control limits can be calculated using only the mostrecent 20-30 data points. Also, the standard deviation (S) data shouldbe used to establish an on-going precision statement for the level ofconcentrations included in the LFB. These data must be kept on fileand be available for review.9.3.49.4Instrument Performance Check Solution (IPC) -- For all determinationsthe laboratory must analyze the IPC (a mid-range check standard) anda calibration blank immediately following daily calibration, after every10th sample (or more frequently, if required), and at the end of thesample run. Analysis of the IPC solution and calibration blankimmediately following calibration must verify that the instrument iswithin 10% of calibration. Subsequent analyses of the IPC solutionmust verify the calibration is still within 10%. If the calibration cannotbe verified within the specified limits, reanalyze the IPC solution. If thesecond analysis of the IPC solution confirms calibration to be outsidethe limits, sample analysis must be discontinued, the cause determinedand/or in the case of drift the instrument recalibrated. All samplesfollowing the last acceptable IPC solution must be reanalyzed. Theanalysis data of the calibration blank and IPC solution must be kept onfile with the sample analyses data.ASSESSING ANALYTE RECOVERY AND DATA QUALITY9.4.1Laboratory Fortified Sample Matrix (LFM) -- The laboratory must add aknown amount of analyte to a minimum of 10% of the routine samples.In each case the LFM aliquot must be a duplicate of the aliquot usedfor sample analysis. The analyte concentration must be high enough to351.2-8
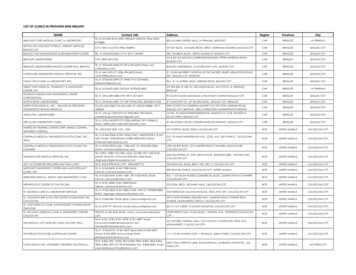
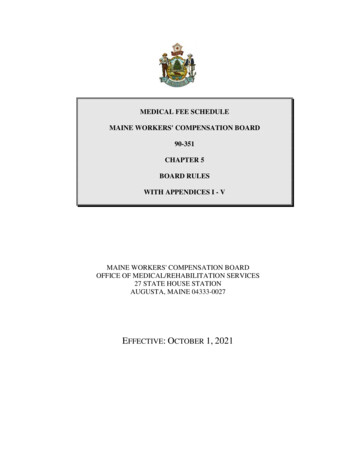
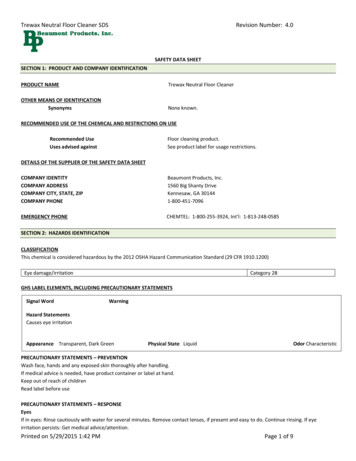
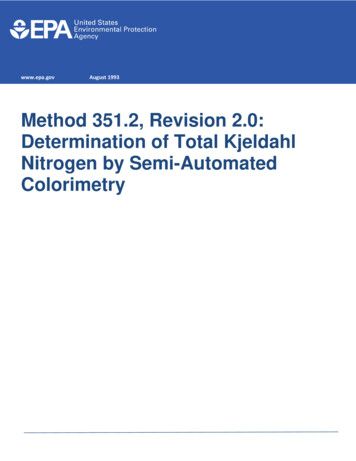
be detected above the original sample and should not be less than fourtimes the MDL. The added analyte concentration should be the sameas that used in the laboratory fortified blank.9.4.2Calculate the percent recovery for each analyte, corrected forconcentrations measured in the unfortified sample, and compare thesevalues to the designated LFM recovery range 90-110%. Percentrecovery may be calculated using the following equation:where, RCsCs10.0 percent recoveryfortified sample concentrationsample background concentrationconcentration equivalent of analyte added to sample9.4.3If the recovery of any analyte falls outside the designated LFM recoveryrange and the laboratory performance for that analyte is shown to be incontrol (Section 9.3), the recovery problem encountered with the LFM isjudged to be either matrix or solution related, not system related.9.4.4Where reference materials are available, they should be analyzed toprovide additional performance data. The analysis of reference samplesis a valuable tool for demonstrating the ability to perform the methodacceptably.CALIBRATION AND STANDARDIZATION10.1Prepare a series of at least three standards, covering the desired range, and ablank by diluting suitable volumes of standard solution (Section 7.11) withreagent water.10.2Process standards and blanks as described in Section 11.0, Procedure.10.3Set up manifold as shown in Figure 1 and Table 2.10.4Prepare flow system as described in Section 11.0, Procedure.10.5Place appropriate standards in the sampler in order of decreasingconcentration and perform analysis.10.6Prepare standard curve by plotting instrument response against concentrationvalues. A calibration curve may be fitted to the calibration solutionsconcentration/response data using computer or calculator based regressioncurve fitting techniques. Acceptance or control limits should be established351.2-9
using the difference between the measured value of the calibration solutionand the "true value" concentration.10.711.0After the calibration has been established, it must be verified by the analysis ofa suitable quality control sample (QCS). If measurements exceed 10% of theestablished QCS value, the analysis should be terminated and the instrumentrecalibrated. The new calibration must be verified before continuing analysis.Periodic reanalysis of the QCS is recommended as a continuing calibrationcheck.PROCEDURE11.1Pipet 25.0 mL of sample, standard or blank in the digestor tube.11.2Add 5 mL of digestion solution (Section 7.3) and mix with a vortex mixer (SeeNote 1).11.3Add four to eight Teflon boiling chips (Section 7.12). CAUTION: An excessof Teflon chips may cause the sample to boil over.11.4Place tubes in block digestor preheated to 160 C and maintain temperature forone hour.11.5Reset temperature to 380 C and continue to heat for one and one half hour.(380 C MUST BE MAINTAINED FOR 30 MINUTES)11.6Remove digestion tubes, cool and dilute to 25 mL with reagent water.11.7Excluding the salicylate line, place all reagent lines in their respectivecontainers, connect the sample probe to the sampler and start the pump.11.8Flush the sampler wash receptacle with about 25 mL of 4% sulfuric acid(Section 7.4) (See Note 2).11.9When reagents have been pumping for at least five minutes, place thesalicylate line in its respective container and allow the system to equilibrate. Ifa precipitate forms after the addition of salicylate, the pH is too low.Immediately stop the proportioning pump and flush the coils with water usinga syringe. Before restarting the system, check the concentration of the sulfuricacid solutions and/or the working buffer solution.11.10To prevent precipitation of sodium salicylate in the waste tray, which can clogthe tray outlet, keep the nitrogen flowcell pump tube and the nitrogenColorimeter "To Waste" tube separate from all other lines or keep tap waterflowing in the waste tray.351.2-10
11.1112.013.0l4.0After a stable baseline has been obtained, start the sampler and performanalysis.DATA ANALYSIS AND CALCULATIONS12.1Prepare a calibration curve by plotting instrument response against standardconcentration. Compute sample concentration by comparing sample responsewith the standard curve. Multiply answer by appropriate dilution factor.12.2Report only those values that fall between the lowest and the highestcalibration standards. Samples exceeding the highest standard should bediluted and reanalyzed.l2.3Report results in mg N/L.METHOD PERFORMANCE13.1In a single laboratory (EMSL-Cincinnati) using sewage samples atconcentrations of 1.2, 2.6, and 1.7 mg N/L, the precision was 0.07, 0.03, and 0.15, respectively.13.2In a single laboratory (EMSL-Cincinnati) using sewage samples atconcentrations 4.7 and 8.74 mg N/L, the recoveries were 99% and 99%,respectively.13.3The interlaboratory precision and accuracy data in Table 1 were developedusing a reagent water matrix. Values are in mg N/L.POLLUTION PREVENTION14.1Pollution prevention encompasses any technique that reduces or eliminates thequantity or toxicity of waste at the point of generation. Numerousopportunities for pollution prevention exist in laboratory operation. The EPAhas established a preferred hierarchy of environmental management techniquesthat places pollution prevention as the management option of first choice.Whenever feasible, laboratory personnel should use pollution preventiontechniques to address their waste generation. When wastes cannot be feasiblyreduced at the source, the Agency recommends recycling as the next bestoption.14.2The quantity of chemicals purchased should be based on expected usageduring its shelf life and disposal cost of unused material. Actual reagentpreparation volumes should reflect anticipated usage and reagent stability.14.3For information about pollution prevention that may be applicable tolaboratories and research institutions, consult "Less is Better: LaboratoryChemical Management for Waste Reduction", available from the American351.2-11
Chemical Society's Department of Government Regulations and Science Policy,1155 16th Street N.W., Washington, D.C. 20036, (202) 872-4477.15.0 WASTE MANAGEMENT15.116.0The Environmental Protection Agency requires that laboratory wastemanagement practices be conducted consistent with all applicable rules andregulations. Excess Reagents and samples and method process wastes shouldbe characterized and disposed of in an acceptable manner. The Agency urgeslaboratories to protect the air, water, and land by minimizing and controllingall releases from hoods and bench operations, complying with the letter andspirit of any waste discharge permit and regulations, and by complying withall solid and hazardous waste regulations, particularly the hazardous wasteidentification rules and land disposal restrictions. For further information onwaste management consult "The Waste Management Manual for LaboratoryPersonnel", available from the American Chemical Society at the address listedin Section 14.3.REFERENCES1.McDaniel, W.H., Hemphill, R.N. and Donaldson, W.T., "AutomaticDetermination of total Kjeldahl Nitrogen in Estuarine Water", TechniconSymposia, pp. 362-367, Vol. 1, 1967.2.Gales, M.E. and Booth, R.L., "Evaluation of Organic Nitrogen Methods", EPAOffice of Research and Monitoring, June, 1972.3.Gales, M.E. and Booth, R.L., "Simultaneous and Automated Determination ofTotal Phosphorus and Total Kjeldahl Nitrogen", Methods Development andQuality Assurance Research Laboratory, May 1974.4.Technicon "Total Kjeldahl Nitrogen and Total Phosphorus BD-40 DigestionProcedure for Water", August 1974.5.Gales, M.E., and Booth, R.L., "Evaluation of the Technicon Block DigestorSystem for the Measurement of Total Kjeldahl Nitrogen and TotalPhosphorus", EPA-600/4-78-015, Environmental Monitoring and SupportLaboratory, Cincinnati, Ohio, 1978.6.Code of Federal Regulations 40, Ch. 1, Pt. 136, Appendix B.351.2-12
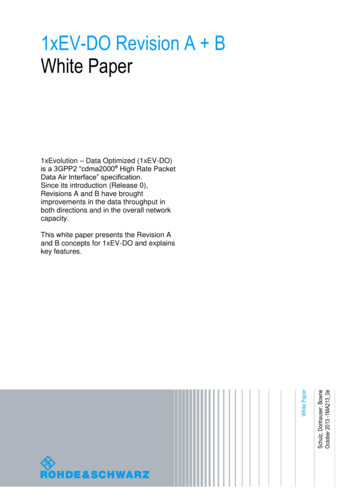
17.0TABLES, DIAGRAMS, FLOWCHARTS, AND VALIDATION DATATABLE 1. INTERLABORATORY PRECISION AND ACCURACY DATANumber ofValuesReportedTrueValue(T)Mean(X)Residualfor XStandardDeviation(S)Residualfor IONS: X 0.986T 0.024, S 0.083T 0.057TABLE 2. CONCENTRATION RANGESPump mL/min.Rangemg/LNmL NaOHBuffer 60.321200-10.00.160.1680351.2-13
351.2-14
351.2-15
this method. A reference file of Material Safety Data Sheets (MSDS) should be made available to all personnel involved in the chemical analysis. The preparation of a formal safety plan is also advisable. 5.3 The following chemicals have the potential to be highly toxic or hazardous, consult MSDS. 5.3.1 Mercury (Sections 7.2 and 7.3)