Transcription
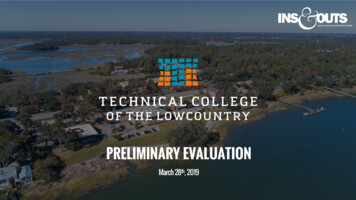
PRELIMINARY EVALUATIONMarch 28th, 2019
PREPARED & PRESENTED BY:Jon Christiansen, PhDJohn-David McKee
Meet the TeamJohn-David McKeeJon Christiansen, PhD
Table of Contents①②③④⑤⑥⑦⑧
Project Overview1
Project Summary
State of the Union –Community Colleges2
Important Distinction #1 - Technical College of theLowcountry is considered a Town: Distant via IPEDS
Important Distinction #2 - The Designated ComparisonGroup in IPEDS is Associate's Colleges: MixedTransfer/Career & Technical-High Traditional, public/3of 3
There are 7,500 colleges in the US.Only 1,200 are community colleges.
The median change in enrollmentfrom 2011 to 2015 was -13%
934 schools have declined in enrollment from 2011 to2015 at an average clip of -19%
242 schools have grown enrollmentfrom 2011 to 2015 at an average clip of 29%.Scrubbing out six outliers,the average growth is 19%.
Among the 242 schools with growth, 46 are in CA, 18 inFL, 16 in NY, 14 in PA, and 11 in TX.The surprise is the growth in TN with 22 schools, morethan half of the schools in the system.
Among the 242 schools with growth,42%are in cities, and 18%are in large suburbs.This is close to on par with thenational distribution of CCs.
Locale Criteria – Percentage of Colleges & Enrollment
Locale Criteria – Percentage of Enrollment (CCs)
Locale Criteria – Percentage of Enrollment (All Colleges)
Top Community Colleges by Enrollment
SO WHAT ABOUT SOUTH CAROLINA?
The median change nationallyfrom 2011 to 2015 is -13%.South Carolina is at for the same period -9%,butdown to -17% from 2011 to 2017
South Carolina Technical College Enrollment Performance2017 Enroll17 vs 1616 vs 1515 vs 1414 vs 1313 vs 1212 vs 11‘11 to ‘15‘11 to ‘17
Who Do We Look Like?3
A LOOK AT ALGORITHMIC PEERS
Algorithmically Derived Peer Institutions
Algorithmically Derived Peer Institutions
Tuition as a % of Revenue
Tuition as a % of Expenses
Instructional Expenses per FTE
Academic Support per FTE
Student Services per FTE
Dollars per FTE Plots
The Market4
Included in this section
Home Ownership Non-TCL SCTCL FootprintBeaufortAllendaleColletonHamptonJasper
Household Composition Non-TCL SCTCL FootprintBeaufortAllendaleColletonHamptonJasper
Dwelling Type Non-TCL SCTCL FootprintBeaufortAllendaleColletonHamptonJasper
Time in Dwelling Non-TCL SCTCL FootprintBeaufortAllendaleColletonHamptonJasper
Household Composition Non-TCL SCTCL FootprintBeaufortAllendaleColletonHamptonJasper
Educational Background Non-TCL SCTCL FootprintBeaufortAllendaleColletonHamptonJasper
Ethnicity Distribution Non-TCL SCTCL FootprintBeaufortAllendaleColletonHamptonJasper
Income Distribution Non-TCL SCTCL FootprintBeaufortAllendaleColletonHamptonJasper
Net Worth Distribution Non-TCL SCTCL FootprintBeaufortAllendaleColletonHamptonJasper
Short Term Debt Distribution Non-TCL SCTCL FootprintBeaufortAllendaleColletonHamptonJasper
Let’s see the Market Personas
Starting HumbleSingle, No Kids, Low Income, Early Stage
Getting ByMarried w Kids, Lower Income, Established/Later
Single Middle ClassSingle, No Kids, Middle Class, Established
Married with Kids, Upper Middle, Later Stage
Single or Married, No Kids, Lower Class, Retired
Single or Married w No Kids, Middle, Retirement
The Frantic Jones Family
The Vanderbilts/SINKs and DINKs
Low Probability High Probability
What do we know about geographic reach?
Closest Campus Reach
The closest campus is within
Population Reach by Mile Reach - Cumulative
Distribution of Minimum Within MainHamptonNew RiverInterpretation: "If closest campus minimum is within 5 minutes,this is the percentage of closest campus"
Distance from Closest Matching Campus MainHamptonNew RiverInterpretation: If X Campus is closest, this is the distance coverage for that campus
Here are the CampusesWords
Here are those that live outside of 20 miles
Here are those that live outside of 25 miles
Program5
In this section
The Program Trend ModelGrowing or sustainingEverythingGrowthSustainSolid GrowthPrograms to WatchGrowth to Steady StateSteady and Consistent“Out of Left Field”Erratic or DecliningU-ShapedErraticWildly Erratic“Meh”Inverted-UDecline, but likely SSDeclineSlow FallHard FallExtinct
EverythingGROWTH PROGRAM PERSONA #1700000650000 600000550000500000450000400000Note the steadyincrease inoverall trend3500003000002012Example Programs:20132014201520162017
Solid GrowthGROWTH PROGRAM PERSONA #2480004600044000 4200040000I love the smellof growth in themorning38000360003400032000300002012Example Programs:20132014201520162017
Growth to Steady StateGROWTH & SUSTAIN PROGRAM PERSONA #13700036000 350003400033000Growth until ‘15when productionconverges tosteady state3200031000300002012Example Programs:20132014201520162017
Steady and ConsistentSUSTAIN PROGRAM PERSONA #14400042000 400003800036000What you see iswhat you get3400032000300002012Example Programs:20132014201520162017
U-ShapedERRATIC PROGRAM PERSONA #140003500 30002500Inflection point at‘14 and regressingtoward origin at ‘122000150010002012Example Programs:20132014201520162017
Wildly ErraticERRATIC PROGRAM PERSONA #23500033000 3100029000Two or moreinflection pointsevident27000250002012Example Programs:20132014201520162017
Inverted-UERRATIC PROGRAM PERSONA #32500020000 1500010000Note theinflection pointsin ‘14-’15500002012Example Programs:20132014201520162017
Declining, but likely hit Steady StateDECLINE PROGRAM PERSONA #140000Leveling offstarting to showin ‘15 and ‘1635000 3000025000200002012Example Programs:20132014201520162017
Slow FallDECLINE PROGRAM PERSONA #1120000115000Fairly steadyuntil ‘15 wherethe fall starts110000 10500010000095000900002012Example Programs:20132014201520162017
Hard FallDECLINE PROGRAM PERSONA #2260000240000No sugarcoatingwhat is going onhere 220000200000 1800001600001400001200001000002012Example Programs:20132014201520162017
Programs Worth WatchingON-THE-FENCE PROGRAM PERSONA #125002000 15001000Growth present,but the jury isout on whether itis sustainable50002012Example Programs:20132014201520162017
Out of Left FieldON-THE-FENCE PROGRAM PERSONA #23000Barely inexistence untilrecently2500 20001500100050002012Example Programs:20132014201520162017
“Meh”NO-GO PROGRAM PERSONA #11000800 600400200Meh02012Example Programs:20132014201520162017
ExtinctNO-GO PROGRAM PERSONA #2 This is pointingto an arbitrarypoint because itwouldn’t makesense to reportthisExample Programs:
Erratic or DecliningGrowing or sustainingSC Technical College Program Counts
Erratic or DecliningGrowing or sustainingSC Technical College Percent Distribution
Program Performance DarGreenville stern 0.3 Tech-1.0Central CarolinaAiken TechOrangeburgTech i-CountyTech 0.423
Trends in Program Personas4100380260140020-10 c180Watch8Steady200Growth9SteadyAll SC Technical Colleges(Non-TCL)Technical College of the Lowcountry
Trends in Program Personas
Where SC Schools should Sustain
Where SC Schools are at Risk
What about peer institutions?
Program Performance – Peer Comparison-1.4Peers,FinancialTCL3-3-2 0.8 0.2-1 1.2SameGroupCode0SameLocale1Peers,No Financial 0.5All Two-Year 1.023
Erratic or DecliningGrowing or sustainingProgram Performance Distribution
Trends in Program Personas
TCL vs. All Two-Year SchoolsDeclineErraticWatchSteadyGrowthAll Two-Year SchoolsDeclineErraticWatchSteadyGrowthTechnical College of the Lowcountry
TCL vs. Best Match PeersDeclineErraticWatchSteadyGrowthAll Two-Year SchoolsDeclineErraticWatchSteadyGrowthTechnical College of the Lowcountry
What programs do peers have that are winning?
Winning Programs –- Group 1
Winning Programs –- Group 2
Winning Programs –- Group 3
Winning Programs –- Group 4
So we have seen trend. Let’s add demand into the equation.
How are our programs sitting at the aggregate level?Are we in a prime position in terms of portfolio?
Aggregate Demand vs. Aggregate Program Growth Trends of TCL ProgramsAggregate (US) TrendAggregate (US) DemandGrowthPinnacle(90th to 100th percentile demand)High(75th to 89th percentile demand)Medium(50th to 74th percentile demand)Low(26th to 49th percentile demand)Scarce(0 to 25th percentile demand)SteadyErratic3 Programs1 ProgramDecline6 Programs1 Program2 Programs
Aggregate Demand vs. Aggregate Program Growth Trends of TCL ProgramsAggregate (US) TrendGrowthSteadyErraticDeclineAggregate (US) Demand Pinnacle(90th to 100th percentile demand)High(75th to 89th percentile demand)Medium(50th to 74th percentile demand)Low(26th to 49th percentile demand)Scarce(0 to 25th percentile demand) Liberal Arts and Sciences/LiberalStudies.Physical Therapy Technician/Assistant.Business/Commerce, General.Industrial ElectronicsTechnology/Technician. Data Processing and Data Processing Technology/Technician.Child Care and Support ServicesManagement.Legal Assistant/Paralegal.Criminal Justice/Safety Studies.Medical RadiologicTechnology/Science - RadiationTherapist.Registered Nursing/Registered Nurse.Administrative Assistant andSecretarial Science, General.Civil EngineeringTechnology/Technician.Construction EngineeringTechnology/Technician.
How does this matrix fare in South Carolina?
South Carolina Demand vs. South Carolina Program Growth Trends of TCL ProgramsSouth Carolina DemandSouth Carolina TrendPinnacle(90th to 100th percentile demand)High(75th to 89th percentile demand)Medium(50th to 74th percentile demand)Low(26th to 49th percentile demand)Scarce(0 to 25th percentile demand)GrowthSteadyErratic1 Program5 Programs2 Programs1 Program1 Program1 ProgramDecline1 Program1 Program
South Carolina Demand vs. South Carolina Program Growth Trends of TCL ProgramsSouth Carolina TrendGrowthSteady Data Processing and Data ProcessingTechnology/Technician.Child Care and Support Services Management. Medical RadiologicTechnology/Science - RadiationTherapist.Registered Nursing/Registered Nurse.Business/Commerce, General. Physical Therapy Technician/Assistant. Construction EngineeringTechnology/Technician.Aggregate Demand Pinnacle(90th to 100th percentile demand)High(75th to 89th percentile demand)Medium(50th to 74th percentile demand)Low(26th to 49th percentile demand)Scarce(0 to 25th percentile demand) Liberal Arts and Sciences/LiberalStudies.Erratic DeclineCriminal Justice/Safety Studies.Administrative Assistant andSecretarial Science, General.Industrial ElectronicsTechnology/Technician. Legal Assistant/Paralegal. Civil EngineeringTechnology/Technician.
Jobs6
What we will explore
Beaufort HHI MSA – Workforce DemographicsMSA vs. South Carolina215,302Population Size 1.8%May 2016 - May 2017
Beaufort HHI MSA – Workforce DemographicsMSA vs. South CarolinaUnemploymentBeaufort/HHI MSA2.9%Statewide3.1%Aging WorkersBeaufort/HHI MSA23.7%Working Age PopulationStatewide20.9%Beaufort/HHI MSA100%Statewide84.3%Automation RiskBeaufort/HHI MSA60.5%Statewide57.9%
Beaufort HHI MSA – Job Counts by YearAssociates Degree/Less than Bachelors Inferred
Beaufort HHI MSA – Job Counts by YearAll Degrees Open
Where are the jobs in South Carolina?Less than a Bachelor’s Degree
Beaufort HHI MSA – Education x Experience
Beaufort HHI MSA – Skill Clusters in Demand
Beaufort HHI MSA – Top Job Skills in DemandAll DegreesBelow Bachelors
All DegreesBeaufort HHI MSA – Top EmployersBelow 36246243366365338
All DegreesBeaufort HHI MSA – Top IndustriesBelow Bachelors1,8241,8211,419Health Care and Social AssistanceAccommodation and Food ServicesRetail TradeTransportation and WarehousingPublic AdministrationAdministrative and Support and WasteManagement and Remediation ServicesFinance and InsuranceManufacturingProfessional, Scientific, and Technical ServicesReal Estate and Rental and LeasingInformationConstructionOther Services (except Public Administration)Wholesale TradeArts, Entertainment, and RecreationEducational ServicesUtilitiesMining, Quarrying, and Oil and Gas ExtractionAgriculture, Forestry, Fishing and HuntingManagement of Companies and 943
All DegreesBeaufort HHI MSA – Top OccupationsBelow Bachelors
Beaufort HHI MSA – Top Job LocationsAll DegreesBelow Bachelors
Supply Demand Comparison – Beaufort/HHI MSANumber of starter jobsConferrals (2017)Projected Change inEmployment(2016 - 2026)# of Hard to Fill Jobs
What are the “Hard to Fill” jobs?
Hard to Fill Jobs – - Beaufort/HHI MSAVERY HIGH DEMAND -- Below Bachelors Degree
Hard to Fill Jobs – - Beaufort/HHI MSAHEALTH CARE -- Below Bachelors Degree
Hard to Fill Jobs – - Beaufort/HHI MSAHEALTH CARE -- Below Bachelors Degree (continued)
Hard to Fill Jobs – - Beaufort/HHI MSAENGINEERING & IT -- Below Bachelors Degree
Hard to Fill Jobs – - Beaufort/HHI MSAMAINTAINENCE, REPAIR, INSTALL -- Below Bachelors Degree
Hard to Fill Jobs – - Beaufort/HHI MSAMANUFACTURING -- Below Bachelors Degree
Hard to Fill Jobs – - Beaufort/HHI MSABUSINESS MGMT & OPERATIONS HR -- Below Bachelors Degree
So far we have already discussed:PROGRAM TREND PERFORMANCE PROGRAM DEMAND PROGRAMS WINNING AT PEER INSTITUTIONS.Now let’s add some criteria.And some facts to go along with it.
Programs JobsTCL’s 16 programs link to 37 unique jobs 2.3X jobs per program.Jobs ProgramsOn the flipside, those 37 unique jobs link to 98 degreeprograms 2.64 degree codes per jobs.
Associate’s as Entry19 of the 37 unique jobs have a 25%or greater employment with anAssociate’s degree; of the remaining, 11 are unknown degree level, andthe remaining six are bachelor’s or higher, however, four arepostsecondary teachers (the other two are Chief Executives andManagement Analysts).
Associate’s as Entry/Associate’s in MarketplaceAmong those 37 jobs, 8 have an Associate’s degree as thetypical point of entry. Three have postings of 25%or greaterdesiring an Associate’s. 19 have 25%or more Associate’sdegrees serving those jobs; only four are at 50%or greater.
Associate’s in MarketplaceThere are 840 unique jobs; 284 of those unique jobs have a 25%orgreater Associate’s degree; 44 have 50%or greater.
Market QuotientWe developed a Labor Area Quotient, which is a calculation of ajob’s unique share of total employment in the market relative tothe share nationally.There are 60 unique jobs with Quotients greater than two (90 at1.5X or better); four require Associate’s degrees, and TCL has twoprograms to fit those four.
Market QuotientThere are six jobs with Quotients greater than 2 and 50%or more haveAssociate’s; however, there are 144 unique jobs with Associates at 25%and above with Quotients greater than 2.
MSA Postings Trend ( 50 over twelve months)There are 45 jobs with more than 50 unique job postings in the last 12months in the MSA.Nine of these jobs have at least of quarter of postings desiring anAssociate’s degree. Three of these jobs have a 50%or more Associate’sdegrees in the labor market (Surgical Tech, Licensed Practical andVocational Nurses, Medical Assistants), with 38 jobs having 25%or morewith Associate’s degrees.
MSA Postings Trend ( 100 over twelve months)There are 22 unique jobs with 100 or more postings in the last 12 months, withseven having that same quarter or more postings with an Associates as the typicaleducation for entry. 19 of those 22 have Associate’s degrees among 25%of thelabor force, but none with 50%or greater.
Projected Job Growth (Bright Outlook)Among the 584 jobs with a state-level projection to 2026, 49 arepredicted to grow 15%or more over that period. Two of 49 requireAssociate’s degrees (PT Assistant; HR Assistant).Another five have 25%or more job postings desiring an Associate’sdegree. 36 jobs have 25%or greater Associate’s degrees serving thosejobs; three with 50%or greater.
Projected Job Growth (Bright Outlook)Nationally, 94 are predicted to grow 15%or more over that period.Eight of 94 require Associate’s degrees. 35 jobs have 25%or greater Associate’sdegrees serving those jobs; 14 with 50%or greater. And they aren’t all the same atthe state level.
Projected Job Growth (Bright Outlook)Only ten jobs are expected to grow 15%or more statewide with 50 or morejob postings in the last 12 months. None require an Associate’s degree.Two jobs have 25%or greater postings desire an Associate’s degree (CSRs,Stock Clerks). Seven jobs have 25%or greater Associate’s degrees fillingthose jobs. None at 50%or greater. So, no one has been neglectful.
Risk of Automation408 jobs are graded on the risk of automation.202 are low risk; 102 are medium risk; 103 are high risk.Of the high risk, 22 are tied to CIP family 52, while only 10 are tied to 51, 12 tied toCIP 19, 5 tied to CIP 15, and one tied to 19.
Risk of AutomationAmong high risk automation jobs, 85 have 25%or more employment withAssociates degrees, while 115 are low risk.Among the 41 jobs where 50%or more have Associates degrees, only threeare high risk for automation, 11 at medium risk, the remaining 26 are lowrisk.
Jobs to Programs341 programs have at least 1:1 jobs to programs matching.Among the 33 coded to Associates as typical education needed for entry, only 9 fitthe bill.
Jobs to ProgramsAmong those 341 programs with at least 1:1, 109 (of 177 known) have a labor marketwith 25%or greater Associates degrees;23 with 50%or greater Associates (of the 44 Total!)
Jobs to Programs11 of 15 TCL programs have at least 1:1 jobs per program.
What is the occupational outlookfor our current programs?
Occupational Outlook:COMPUTER TECHNOLOGYProgram Match Data Processing and Data Processing Technology/Technician# of Job Overlaps in12-month job%Where Associates# of Overlaps in AllBeaufort HHI MSA# Employed –Lowcountrypostings – BeaufortRisk of automationDegree is MostProgramsQuotientBeaufort HHI MSAProgramsHHI MSALikely EntrantTypical EntrantDegree%in Jobs withProjected Ten Year Projected Ten YearAssociates DegreeChange - SCChange - US
Occupational Outlook:CIVIL ENGINEERING TECHNOLOGYProgram Match Civil Engineering Technology/Technician# of Job Overlaps in12-month job# of Overlaps in AllBeaufort HHI MSALowcountrypostings – BeaufortProgramsQuotientProgramsHHI MSARisk of automation# Employed –Beaufort HHI MSA%Where AssociatesDegree is MostLikely EntrantTypical EntrantDegree%in Jobs withAssociates DegreeProjected Ten Year Projected Ten YearChange - SCChange - US
Occupational Outlook:BUILDING CONSTRUCTION TECHNOLOGYProgram Match Construction Engineering Technology/Technician# of Job Overlaps in12-month job# of Overlaps in AllBeaufort HHI MSALowcountrypostings – BeaufortProgramsQuotientProgramsHHI MSARisk of automation# Employed –Beaufort HHI MSA%Where AssociatesDegree is MostLikely EntrantTypical EntrantDegree%in Jobs withAssociates DegreeProjected Ten Year Projected Ten YearChange - SCChange - US
Occupational Outlook:EARLY CARE & EDUCATIONProgram Match Child Care and Support Services Management & Child Care Provider/Assistant# of Job Overlaps in12-month job# of Overlaps in AllBeaufort HHI MSALowcountrypostings – BeaufortProgramsQuotientProgramsHHI MSARisk of automation# Employed –Beaufort HHI MSA%Where AssociatesDegree is MostLikely EntrantTypical EntrantDegree%in Jobs withAssociates DegreeProjected Ten Year Projected Ten YearChange - SCChange - US
Occupational Outlook:LEGAL ASSISTANT/PARALEGALProgram Match Legal Assistant/Paralegal# of Job Overlaps in12-month job# of Overlaps in AllBeaufort HHI MSALowcountrypostings – BeaufortProgramsQuotientProgramsHHI MSARisk of automation# Employed –Beaufort HHI MSA%Where AssociatesDegree is MostLikely EntrantTypical EntrantDegree%in Jobs withAssociates DegreeProjected Ten Year Projected Ten YearChange - SCChange - US
Occupational Outlook:ASSOCIATE OF ARTS & ASSOCIATE OF SCIENCEProgram Match Liberal Arts and Sciences/Liberal Studies# of Job Overlaps in12-month job# of Overlaps in AllBeaufort HHI MSALowcountrypostings – BeaufortProgramsQuotientProgramsHHI MSARisk of automation# Employed –Beaufort HHI MSA%Where AssociatesDegree is MostLikely EntrantTypical EntrantDegree%in Jobs withAssociates DegreeProjected Ten Year Projected Ten YearChange - SCChange - US
Occupational Outlook:CRIMINAL JUSTICE & CRIMINAL JUSTICE TECHNOLOGYProgram Match Criminal Justice/Safety Studies# of Job Overlaps in12-month job# of Overlaps in AllBeaufort HHI MSALowcountrypostings – BeaufortProgramsQuotientProgramsHHI MSARisk of automation# Employed –Beaufort HHI MSA%Where AssociatesDegree is MostLikely EntrantTypical EntrantDegree%in Jobs withAssociates DegreeProjected Ten Year Projected Ten YearChange - SCChange - US
Occupational Outlook:INDUSTRIAL ELECTRONICS ENGINEERINGProgram Match Industrial Electronics Technology/Technician# of Job Overlaps in12-month job# of Overlaps in AllBeaufort HHI MSALowcountrypostings – BeaufortProgramsQuotientProgramsHHI MSARisk of automation# Employed –Beaufort HHI MSA%Where AssociatesDegree is MostLikely EntrantTypical EntrantDegree%in Jobs withAssociates DegreeProjected Ten Year Projected Ten YearChange - SCChange - US
Occupational Outlook:PHYSICAL THERAPY ASSISTANTProgram Match Physical Therapy Technician/Assistant# of Job Overlaps in12-month job# of Overlaps in AllBeaufort HHI MSALowcountrypostings – BeaufortProgramsQuotientProgramsHHI MSARisk of automation# Employed –Beaufort HHI MSA%Where AssociatesDegree is MostLikely EntrantTypical EntrantDegree%in Jobs withAssociates DegreeProjected Ten Year Projected Ten YearChange - SCChange - US
Occupational Outlook:EMTProgram Match Emergency Medical Technology/Technician (EMT Paramedic)# of Job Overlaps in12-month job# of Overlaps in AllBeaufort HHI MSALowcountrypostings – BeaufortProgramsQuotientProgramsHHI MSARisk of automation# Employed –Beaufort HHI MSA%Where AssociatesDegree is MostLikely EntrantTypical EntrantDegree%in Jobs withAssociates DegreeProjected Ten Year Projected Ten YearChange - SCChange - US
Occupational Outlook:RADIOLOGIC TECHNOLOGYProgram Match Medical Radiologic Technology/Science - Radiation Therapist# of Job Overlaps in12-month job# of Overlaps in AllBeaufort HHI MSALowcountrypostings – BeaufortProgramsQuotientProgramsHHI MSARisk of automation# Employed –Beaufort HHI MSA%Where AssociatesDegree is MostLikely EntrantTypical EntrantDegree%in Jobs withAssociates DegreeProjected Ten Year Projected Ten YearChange - SCChange - USHealth Specialties Teachers,Postsecondary2602N/AN/AN/AN/ADoctoral orprofessionaldegree5%28%26%Radiation Therapists111**Low RiskN/AN/AAssociate'sdegree45%15%13%Radiologic Technologists13222.14Low Risk220N/AAssociate'sdegree64%17%12%
Occupational Outlook:NURSINGProgram Match Registered Nursing/Registered Nurse# of Job Overlaps in12-month job# of Overlaps in AllBeaufort HHI MSALowcountrypostings – BeaufortProgramsQuotientProgramsHHI MSARisk of automation# Employed –Beaufort HHI MSA%Where AssociatesDegree is MostLikely EntrantTypical EntrantDegree%in Jobs withAssociates DegreeProjected Ten Year Projected Ten YearChange - SCChange - US
Occupational Outlook:BUSINESS ADMINISTRATIONProgram Match Business/Commerce, General# of Job Overlaps in12-month job# of Overlaps in AllBeaufort HHI MSALowcountrypostings – BeaufortProgramsQuotientProgramsHHI MSARisk of automation# Employed –Beaufort HHI MSA%Where AssociatesDegree is MostLikely EntrantTypical EntrantDegree%in Jobs withAssociates DegreeProjected Ten Year Projected Ten YearChange - SCChange - US
Occupational Outlook:ADMINISTRATIVE OFFICE TECHNOLOGY & OFFICE SYSTEMS TECHNOLOGYProgram Match Administrative Assistant and Secretarial Science, General# of Job Overlaps in12-month job# of Overlaps in AllBeaufort HHI MSALowcountrypostings – BeaufortProgramsQuotientProgramsHHI MSARisk of automation# Employed –Beaufort HHI MSA%Where AssociatesDegree is MostLikely EntrantTypical EntrantDegree%in Jobs withAssociates DegreeProjected Ten Year Projected Ten YearChange - SCChange - US
Let’s put it all together –Programs Jobs
Program Evaluation Criteria: PROGRAM FACTOR DEFINITIONS
Program Evaluation Criteria: JOB OUTLOOK DEFINITIONS
Rundown of Total Performance – Tier 1 & 2 Programs
Let’s see the Tier One & Tier Two Programs.
TIER ONE PROGRAMS –- Group 1Sorted High to Low on Performance
TIER ONE PROGRAMS –- Group 2Sorted High to Low on Performance
TIER ONE PROGRAMS –- Group 3Sorted High to Low on Performance
TIER TWO PROGRAMS –- Group 1Sorted High to Low on Performance
TIER TWO PROGRAMS –- Group 2Sorted High to Low on Performance
TIER TWO PROGRAMS –- Group 3Sorted High to Low on Performance
So how did TCL do?
Technical College of the Lowcountry –- Overall Program Evaluation
Technical College of the Lowcountry –- Program Rollout: CULINARY12121212
Technical College of the Lowcountry –- Program Rollout: FIRE SCIENCE
Applicant7
Include in this section
Total Applicant Trend
# of Associates Applicants x Programs Applied into
Applicant Trend
Fall 2018 Applicant Pool
Fall 2013 Applicant Pool
Fall 2008 Applicant Pool
Fall 2003 Applicant Pool
Student Type by Year
Ethnicity Apps by Year
Gender Apps by Year
Spread of Fall Applications Fall 2018Fall 2013Fall 2008
Where We Go From Here8
Where We Go From Here
THANKS!
Orangeburg Tech-1.9-2.0 Central Carolina Aiken Tech Midlands Tech-1.6 Program Performance Continuum-3-3 -2 -1 0 1 2 3-1.4 TCL HGTC Trident Tech-1.3-1.0 FloDar Greenville Tech . Registered Nursing/Registered Nurse. Administrative Assistant and Secretarial Science, General.