Transcription
EXPERIENCE IN ELECTRICITY MARKETRESTRUCTURING: THE BAD, THE UGLYAND THE NOT SO BADTaff Tschamlertaff.tschamler@kema.com25th Annual North American Conference of the USAEE/IAEESeptember 20, 2005
In a nutshell Expectations generally not met California crisis and Enron scandal halted and, in somecases, reversed reforms; effects persist Highly regulated, “protectionist” approach to retailelectricity pricing, compared to other retail industries Numerous challenges to implementing rational, “endstate” market design Despite structural impediments and ’01 crisis, substantialgrowth in customer participation and new entry hasoccurred2
Evolving Retail Market ModelsDefault service is the single most important driver ofcustomer participation and supplier competition.Wholesale, vertical auctions and RFPs have become thefavored model as initial transition periods expiredModels of Default ServiceNegotiatedRatesFormula orHub BasedMARIPAOHILPassThroughNYNJDQEAuctionsand RFPsNJMDDCMA3TexasPTBTXMarket(no default service)TXUK
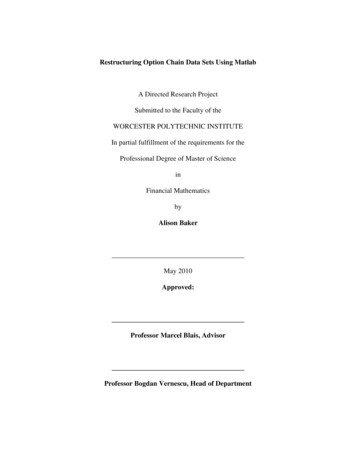
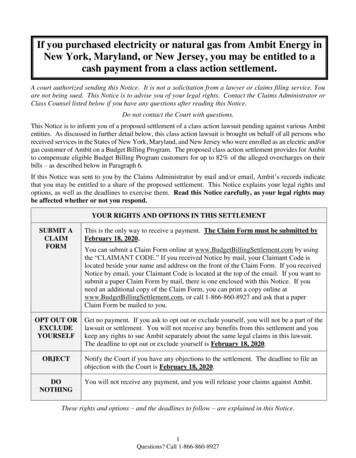
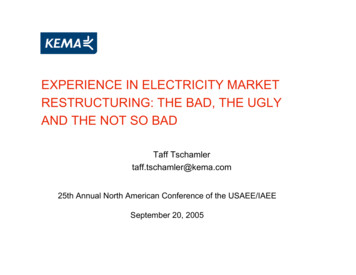
Customer ParticipationU.S. markets on the whole have experienced substantialincreases in customer participation. However, growth inparticipation is concentrated in a few states.Estimated Peak Load Served By Alternative Suppliers, August 200580,000 As of August 2005, 365– 1,400 TWh eligible– 3,700 TWh total As of August 2005, 3.7million accounts switched 15% of total switchedload and 80% ofswitched accounts areresidential6.3GW60,000Peak Load (MW)TWh annualized (or 69GW of peak load) isserved competitively70,0006.2 GW11.9 GW50,00022.3 GW40,00030,00020,00022.2 GW10,00002001 & prior 2002Source: KEMA, State government agencies4200320042005 YTD
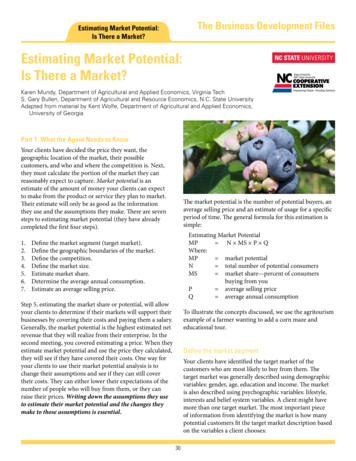
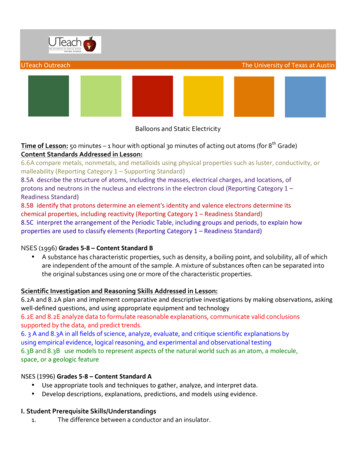
Customer Participation by StateAnnual energy sales served by alternative suppliers and by incumbent utilitiesTX ERCOTOHPA200120022003200420052005 DefaultNYILMIVANJMDMAOther050100150TWh5200250
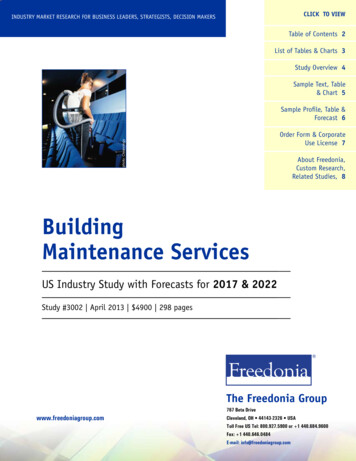
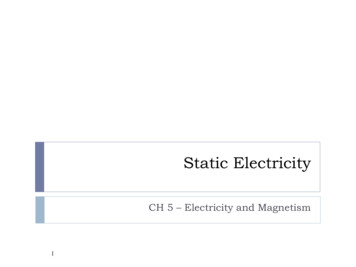
Price ImpactsTo assess price impacts we must answer: What would priceshave been under a regulated market compared to prices in acompetitive market?Fundamental problem: all markets, except Texas 1 MW, are still subject to price controls.deregulation would be flawedSource: Department of Energy, Energy Information Administration6Jan-04analysis of U.S. retailJan-02exists – any cost-benefitJan-00unregulated price impacts)Jan-98 No empirical evidence ofJan-96– “Closed” states : 1.0 %No ChoiceChoiceLi(N Ch iJan-94– “Open” states: 1.3 %10.09.59.08.58.07.57.06.56.05.55.0Jan-92increases from 1990 to 2005Monthly Historical Prices, Weighted Average Revenueper kWh for “Open” and “Closed” States, Jan. 1990 to May 2005Jan-90 Average annual price
Innovation Impacts Diverse range of products, pricing, promotions & perks.Choices rooted in: PriceRisk management and price certaintySimplicity and convenienceDemand managementRewards programsSupplier brands, perceived stability, channels, etc. Substantial cost cutting and widespread efficiencyimprovement programs among incumbents"We've learned more about our customers in the last year than in thelast 100 years. Prior to deregulation, there was no incentive.“Brian Tulloh, Vice President of Strategy for TXU Energy(Source: Star-Telegram, January 21, 2005)7
Who are the players?Large number of diverse enterprises comprise the field ofcompetitors. High concentration of customers and salesamong regulated utility affiliates/incumbentsBusiness MarketsTop 5 SuppliersConstellation NewEnergyReliant EnergyTXU EnergyStrategic EnergySuez Energy ResourcesResidential MarketsPeak MWServed15,6008,6005,7003,5003,200Top 5 SuppliersTXU EnergyReliant Energy RetailCentrica North AmericaGreen Mountain EnergyEnergy Savings Income 00 13 companies serve over 100k power customers 45 firms serve residential markets nationwide 200 licensed to serve nationwide 45% of accounts served competitively in Texas Centrica serves 5.1 M accounts (power, gas,services) Top 5 comprise 55% of total market Top 20 comprise 85% of total market Concentration increasing slightly 13 companies serve over 1,000 MW 75 firms serve business markets 250 licensed to serve 35 out of Top 50 operate in Texas8
Rewards programs . Reliant Energy 8,600 TXU Energy 5,700 Strategic Energy 3,500 Suez Energy Resources 3,200 Top 5 comprise 55% of total market Top 20 comprise 85% of total market Concentration increasing slightly 13 companies serve over 1,000 MW 75 firms serve business markets 250 licensed to serve 35 out of Top 50 operate in Texas 13 companies serve over 100k power