Transcription
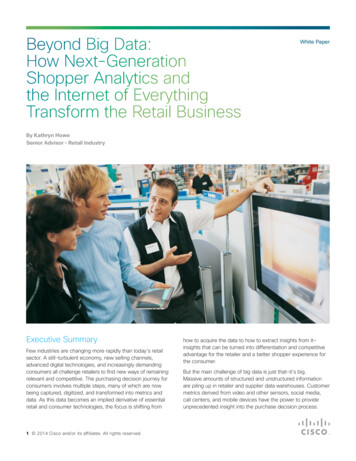
Beyond Big Data:How Next-GenerationShopper Analytics andthe Internet of EverythingTransform the Retail BusinessWhite PaperBy Kathryn HoweSenior Advisor – Retail IndustryExecutive SummaryFew industries are changing more rapidly than today’s retailsector. A still-turbulent economy, new selling channels,advanced digital technologies, and increasingly demandingconsumers all challenge retailers to find new ways of remainingrelevant and competitive. The purchasing decision journey forconsumers involves multiple steps, many of which are nowbeing captured, digitized, and transformed into metrics anddata. As this data becomes an implied derivative of essentialretail and consumer technologies, the focus is shifting from1 2014 Cisco and/or its affiliates. All rights reserved.how to acquire the data to how to extract insights from it—insights that can be turned into differentiation and competitiveadvantage for the retailer and a better shopper experience forthe consumer.But the main challenge of big data is just that—it’s big.Massive amounts of structured and unstructured informationare piling up in retailer and supplier data warehouses. Customermetrics derived from video and other sensors, social media,call centers, and mobile devices have the power to provideunprecedented insight into the purchase decision process.
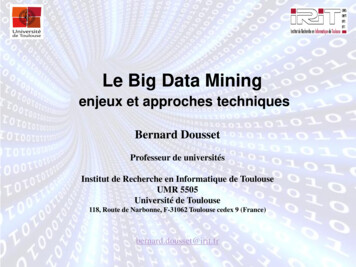
Beyond Big DataWhite PaperYet the rate of data flowing into the enterprise and the vastarray of sources available can paralyze retailers as they tryto decipher which data types to use, in which combinations,for which insights and decisions. Selecting the metrics tooperationalize into dashboards and KPIs versus those whichshould be tapped only occasionally for directional insight isan ongoing exercise in data value assessment.Still more data can be derived as businesses and consumersmove into the realm of pervasive connectivity that definesthe Internet of Everything (IoE) world. IoE combines people,processes, data, and things to enable the transfer of informationand create new potential for business innovation. Sensors anddevices offer up data from previously unconnected processesand their components, expanding the role of data in decisionmaking across the entire retail enterprise.This paper introduces some general concepts of shopperbehavior analytics and explores why getting started usinganalytics is an imperative for today’s retail operators. We willalso outline a number of use cases where inserting the rightdata and analysis can deliver value to the decisions retailersare making today. This helps them to optimize every partof the customer decision journey to improve conversion,margins, and brand experience.increasingly shorter product cycles and more on the enduringdifferentiators of relationship and customer experience createdthrough strategic use of data and analytics.Companies increasingly understand that their ability to competeis tied to their ability to create and harness value from data, andare seeking new ways to look at big data and beyond. Nearlyhalf of retailers worldwide have big data initiatives, and acrossall industries companies will spend an average of 8 million onbig data initiatives in 2014 alone.1Yet so far, while retailers regularly utilize web analytics for sitemaintenance, management, and marketing, relatively few utilizeadvanced analytics in the physical store. Shopper insights inthe physical store have historically been gained through highlymanual processes lacking objectivity and scale. According toTony Costa in the Harvard Business Review,6 “most companiesare flying blind when it comes to understanding their customersin the analog world.”The Role of Analytics in the Retail SectorIn fact, Cisco research shows that retail has a significantlyhigh potential value to be gained by using IoE to gather storemetrics—up to 11 percent, or up to 1.584 trillion in additionalnet profits.7 This value is driven by specific use cases: Forexample, it might encompass guiding and influencing thecustomer journey, improving workforce productivity, creatingconnected inventory views, or reinventing investment modelsfor marketing, promotion management, and advertising.Analytics are driving the move from merchant-driven businessmodels—where the product is the differentiator—to digitalmodels, where every decision is informed by data. Brandengagements are becoming more closely aligned withindividual shopper preferences, creating a brand relationshipthat is shifting from a “nice to have,” time-sensitive offer-basedrelationship to a “must have” digital companionship based ondeep insights and understanding of the consumer. To achievethis critical differentiation, retailers are depending less onRetailers need good data; but more importantly, they needthe right data to gain the insights that can transform theirbusinesses. Value comes from analyzing new data types inthe context of specific business knowledge, such as transactionlog (T-log) and loyalty information, campaign results, and pricingactions. Every shopper engagement, inventory movement, andpromotion leaves a data trail providing opportunities for newcapabilities, both from historical data and real-time information,to support decisions across the business.Big Data ExplosionManages an averageof 164TB data2Will manage 290TB inthe next 12-18 months(76% growth)3The amount of manageddata will grow 800%over the next five years42 2014 Cisco Systems, Inc. All rights reserved. This document is Cisco Public Information.Nearly 1/3 of the largestenterprises will manage1PB datasets by 20155
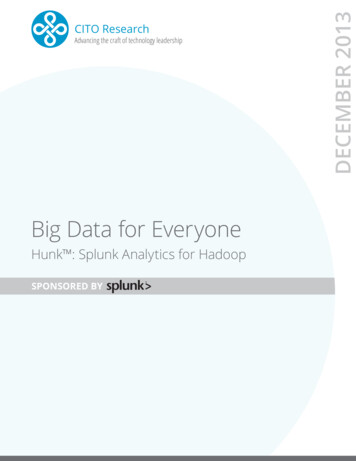
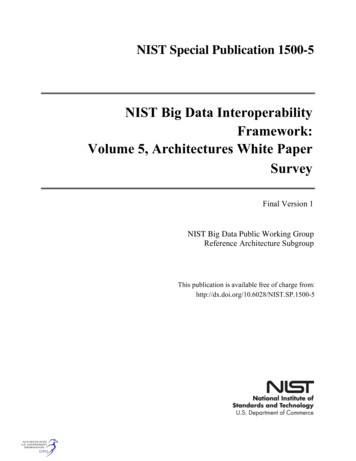
Beyond Big DataWhite PaperOperationalizing New MetricsAccurateAutomating the creation and collection of shopper behavior data in a natural retailenvironment produces more consistent, quantified, and acurate data, reducingvariation and errors from manual observation and point-of-veiw reporting.AffordableData automatically generated from existing technology platforms measuring everyshopper, every day provides an affordable way to acquire large amounts of data ina non-invasive manner.ScalableActionablePlatforms such as mobile, video, web, and social can be implemented and dataeasily accessed, allowing the scale necessary for retailers to reach and measureevery shopper in every store.Capabilities for alerting, setting thresholds and performance markers, along withcollaboration tools for instant sharing and engagement, make the data actionablein real time.Figure 1Data science and analysis allows retailers to collect and fuse datafrom multiple customer touch points such as web, store, socialmedia, and call centers. IoE technologies combine these withmetrics from previously analog components such as carts, doors,machines, and merchandise. Operationalizing the use of thisdata across business processes now becomes a more practicalproposition, with reliable, automated methods of producing andcollecting data across large populations of people and devices.Trusting the DataThe use of data to inform decision-making is of course not anew concept. What is new is that through IoE technologies,retail data can finally be extracted in ways that make itreliable for use in managing large-scale retail businesses.For such data to be useful it must meet four key criteria:It must be accurate, affordable, and scalable (all affordedby the evolution of key technologies), and finally it must beactionable (Figure 1). Retailers in turn must commit to usingthe data to make business decisions—a pivotal cultural changethat sounds easier than it sometimes is to accomplish!As an example, a retailer has a seasoned and accomplishedshoe designer who insists that a new five-color palette of neonsfor teen athletic shoes is spot-on for back to school. At the sametime, social media data is showing positive sentiment aroundthree core colors, and minimal or negative interest around theretailer’s campaign focused on neons. As well, last year’s T-logdata shows a trending up for black and white in the last twoweeks of the back-to-school program.Convincing this seasoned designer to create or assort aproduct based on data evidence for shopper preference canbe challenging and even risky. Inserting insights into the creativeprocess at the right time can give it direction and inspiration.Inserting the facts at the wrong time can stifle the process andput product innovation at risk. Based on trustworthy analytics,the retailer can preserve the value of the “art” and still balanceit with real data-driven decision making using a combination ofsocial sentiment, T-log data, and their own brand value position.This is how true business value can be derived; from mappingthe right data to the right process at the right time.Defining the MetricsUnderstandably, retailers are so far focusing on metrics thatreflect and impact the customer journey. Such analytics areessential for creating differentiation, as they provide insights intohow and why shoppers make the decisions they make alongtheir path to purchase. Metrics generated from mobile, video,web, and social media help to improve shopper marketingas well as operations (Table 1 shown on page 4). Many ofthese metrics and insights are used by retailers across theirentire store population to measure a key performance element3 2014 Cisco Systems, Inc. All rights reserved. This document is Cisco Public Information.
Beyond Big DataWhite PaperShopper Behavior Metrics / InsightsOperational Metrics / Insights Traffic (entrance, aisle, endcaps, departments) Point-of-sale analysis and transaction attributes Unique visits, repeat visits Staff productivity metrics Associated/unassociated devices Engagement rates Path metrics On-shelf availability – out of stocks/replenishment Photo pins/repin activity metrics Shelf activity/item movement Dwell times and events Sweeps and risk management Queue metrics (number in queue, wait times,abandonment, behaviors in queue) Asset tracking (carts, fixtures) Gender metrics Space analysis metrics (hot spots/cold spots) Kinetic heat maps Wi-Fi service utilization/ interference Behavioral data visualization Repair, replacement warnings Facial detection/recognition Queue metrics Basket metrics (IPT, ATV) Conversion analysis for operational variables Energy use analytics (lighting, HVAC) Conversion analysis for promotions/tactics Social sentiment/influence Conversion (store, aisle, category, SKU) Check-in/opt-in ratesTable 1: Examples of Metricsthat, either on its own or in combination with other metrics,quantifiably improves their ability to manage the business.For example, measuring traffic into each store providesinteresting information on store activity trends, peak periods,and some top-level impact assessment of variables such asweather, holidays, and promotional events. The real value,however, is in combining operational data such as workforcemanagement information with these insights in order to lowerthe cost of labor or improve return on labor investments. Doingthis in every store, every day can contribute to significantbottom line savings and top line revenue growth. Ultimately,these insights help leaders make large-scale decisions acrossthe company that can add up to millions of dollars.Other metrics can be used for informing specific decisionsthat may impact all store locations, but don’t necessarily needto be measured all the time. One example of this would beusing traffic and dwell time metrics to measure the ability ofa digital sign to engage shoppers. A retailer may wish to testwhich message content on which screen size stops moreshoppers before making a major investment. This data can beextremely valuable as part of an IT investment decision process,but it doesn’t need to be collected in every store, every day.Data-Gathering Sensors and ToolsMetrics can be gathered using a wide variety of sensors anddevices, including smartphones, Bluetooth beacons, weightand motion sensors, counting systems, active RFID tags,and even ambient condition sensors for moisture, weather,and temperature. The most advanced analytics systems canintegrate data streams from these types of sources with businessinformation systems, merging workforce information, POStransactions, loyalty, and subscription data. Ultimately, seamlesssharing and access to all these different types of informationis the key to creating adoption and delivering business value.Strategies that consider real-time collaboration tools as part ofthe data value equation, deliver complete systems to their users;facilitating the insights-to-action value proposition.4 2014 Cisco Systems, Inc. All rights reserved. This document is Cisco Public Information.
Beyond Big DataBecause consumer preferences are often expressed throughtheir movements and activities around the store, retailers areincreasingly using video as a sensing device. Today’s HDcameras provide highly sophisticated analytics capabilities thatconvert movement into data right at the camera. With analyticsat the device, or “edge,” of the network, stores can respond tocustomer needs and inventory demands in real time, making theoperation more flexible and efficient. Since achieving scale andaccuracy are two of the pillars that lead to improved operationaluse of data, note that video-generated data achieves this byconverting the process of gathering manual observations into aset of automated metrics. Video footage does not necessarilyneed to be stored once the metrics have been generated.This results both in reduced storage costs and more accuratemetrics, scaling to apply to every shopper in the camera viewwhile providing privacy and data anonymity. (However, whencameras are also used for loss prevention or physical security,video may be retained according to normal retailer governancesaround privacy.) While many retailers are concerned aboutcrossing the privacy line with such programs, Cisco’s mostrecent shopper preference research in fact indicates thatespecially younger customers are willing to give up a certainamount of privacy if they can get something in return for it.8Information gathered from in-store and online activity can alsobe augmented by opt-in social media monitoring and locationaware mobile analytics. Participating customers using mobilenetworks and social media from the store, or showrooming, atthe same time identify their influencers, relevant demographics,likes, dislikes, and preferences, allowing stores to capitalize onthis often-dreaded practice. Based on the fusion of this data,a map can be automatically created to help location-awaresystems deliver contextual content. Such messages maypromote products, offer timely price matches, or drive relatedproduct awareness to encourage upsell as the customer movesthroughout the store.White PaperBy combining these data streams and many others, retailers cannow have visibility into all customer/brand touchpoints, creatinga truly better omnichannel experience from leveraging a morecomplete picture of the shopping journey.The Power of Understanding ConversionIn specialty retail, it is generally accepted that conversion isthe standard for comparative performance measurement.Conversion is a foundational metric—the first of the predictiveanalytics building blocks and a requirement for creatinghigh-performance retailing in the IoE era. It normalizes salesperformance against the variable opportunity associated witheach store, aisle, and category.There are different definitions of conversion, but the truebasic calculation is quite simple: Conversion is the measureof transactions generated by a population of shoppers. Forexample, if 1,000 shoppers generate 800 transactions, theresult is an 80% conversion rate.Key Metric for Creating Actionable InsightsNumber of TransactionsConversion RateNumber of ShoppersSome retailers, particularly in fast-moving consumer productssegments, use the number of transactions as a proxy forconversion, assuming that all shoppers generate at least onetransaction. This is fundamentally incorrect and can causebusinesses to overlook key problem areas. Of course, in groceryand other areas where conversion is usually very high, some ofthe most valuable conversion comparisons actually come fromaisle-, category- and display-level analysis. Here the samecalculation applies, only the traffic count, or opportunity, is thenumber of shoppers reaching the aisle, category, or display.In the past, T-log data has been used to measure storeperformance, with comparisons being made between stores,prior years, and seasons based on sales revenues. The issueis that store managers and financial officers often assesssuch numbers and then offer anecdotal insights to caveatthe numbers, such as “Traffic was down that week,” or “Theweather was especially bad this week and fewer people wereshopping.” These insights can in fact contribute to performancevariations. But because they are collected subjectively and not5 2014 Cisco Systems, Inc. All rights reserved. This document is Cisco Public Information.
Beyond Big DataWhite Paperconsistently reported, their important contributions to learningsare often discounted or even disqualified from the analysis.Let’s examine a typical store-to-store comparison using salesrevenue and transaction count. If Store A reports POS revenueof 10,000 and 60 transactions, and Store B reports 20,000and 100 transactions, the conclusion might be that Store B isthe better performer. However, once shopper traffic is takeninto consideration, we may find that Store A had 100 shoppersthat week and Store B had 200. We now must consider theperformance results in the context of one very importantvariable: opportunity. What opportunity did each store havethat week to generate sales? Let’s look at the population ofshoppers. Using this definition of the opportunity variable, wesee that Store A actually converted 60% of its opportunity,while Store B only converted 50%. The sales numbers andATV are of course better in Store B, but over time they cancreate a false sense that the business is healthy, when in factmore shoppers may be leaving without purchasing. If Store Bcould actually convert at the rate of Store A (60%) and keepits average transaction value ( 200/transaction) the same, itwould contribute 4,000 more each week, even without anyimprovement in traffic. That would be an additional 208,000per year from a single store!Such an example illustrates how lack of visibility into storemetrics can unintentionally place the business at risk. Insuch a case, retailers who don’t measure traffic to get a trueconversion calculation may find themselves confronting the“silent killer”: symptomless factors that are silently erodingtheir business and causing shoppers not to purchase.The good news is that today’s automated analytics providepowerful ways to detect, track, and measure these criticalfactors and bring symptoms to the surface early, before theydo too much damage. With these capabilities, not only canretailers accurately measure store-level traffic, scaling up tothe largest of retail enterprises, but they can also measuretraffic at more granular levels down to departments, aisles,fixtures, and individual products.How Can Retailers Get Startedwith Analytics?Defining a far-reaching analytics strategy starts with the basics:having a good vision of the endgame. Each retailer needs toanswer the question, “What does it take to win?” in the context oftheir specific company, market, promotion, category, department,or process. It sounds easy, but it often is not: Part of designinga data strategy is defining the decisions that need to be madeand mapping the right data to inform them. Once the datarequirements are defined, the analytics sources can be selected.Let’s look at some simple examples to highlight the process.Imagine that what it takes to win for a mall retail store is thebasic need to get the shopper to enter the store. Perhaps theconversion rate is actually quite high once they enter, with anaverage ticket that is up year over year, but the greatest hindranceto “winning” is the low volume of traffic entering the store.The focus for this retailer is to acquire and analyze data on trafficpassing by versus actual shoppers entering their store. ManagersToday’s automated analytics offer powerful ways to detect, track, and measure, providing retailers with enhanced visibility into the shopping journey.6 2014 Cisco Systems, Inc. All rights reserved. This document is Cisco Public Information.
Beyond Big Datawould want to examine their “mall traffic conversion” (the percentof shoppers passing by who also enter the store) over time asthey change window displays, execute incentives, and leveragepromotions to shoppers who are nearby, on mobile, usingsocial media, or visiting the store website. They should also beinterested in mobile metrics such as unique and repeat visits andassociated and unassociated devices, as the store will benefitfrom monitoring Twitter and photo postings to ensure the rightproducts are being featured. Knowing what works best forgetting shoppers to enter the store, measuring it, and achievingit allows this retailer to use the right data to win in their business.In another example, suppose that what it may take to winfor a multi-department retailer with a new back-to-schoolproduct line is raising customer awareness with a seasonaldisplay featured at the front of the store. If getting shoppersto stop and notice this display increases the probability theywill continue to the aisle and be exposed to the entire backto-school product line, then the effectiveness of this displaybecomes critical to achieving the endgame.For this program, the retailer is best served by measuring thepercentage of store traffic reaching the fixture, those stoppingthere, and those who reach the full (seasonal) aisle location.The metrics needed here are dwell times and traffic counts,White Paperwith analysis that correlates them. These can be derivedfrom a combination of mobile- and video-based analytics.Measuring conversion in the aisle and at the fixture helps tofurther pinpoint where shoppers are most likely to purchase,which products, and from which location. Dwell metrics helpto understand whether shoppers need to actually spend timeat the fixture to convert or just enough to become aware andcontinue to the home aisle location.If dwell times are shorter (indicating less engagement) butassociated with higher conversion, then the assortment on thefixture may not need to be so broad, leaving room to providevisibility to additional or related products in this high-prioritylocation. However, if dwell times are high (showing interestand engagement) but conversion is low, the display may notbe aligned with the needs of the shopper and the assortmentmay need to be reconfigured to be more effective at drivingshoppers to the aisle. For this operator, optimizing the frontend fixture to stop more shoppers and engage them longer iswhat they need to win.The same consistent, data-driven approach can be used tohelp perform A:B market tests of products across multiple sites.Through video and mobile analytics, pilots can be run moreaccurately and with better scalability than ever before, oftenrequiring fewer stores and less investment to attain large samplesizes than through traditional methods. Through analysis, retailerscompare and evaluate the effectiveness of variables such asdisplay features, location, assortments, and adjacencies.An interesting aspect of this approach is that the resulting datais generally far more accurate than information obtained fromshopper interviews. In the study of physics, the presence ofthe observer can change the nature of the observed—and thisis just as true for consumers, although for different reasons!Even when asked, shoppers frequently do not provide the samedata they send out over social media or share with their friends.Aggregating social media information with in-store observationsbuilds a connection to what customers truly think and feel,providing a strong differentiator for competitive advantage.With this valuable data in hand, aimed at the right decisions,retailers can know sooner, act faster, and decide smarter aboutthe data they need. This leads to better decisions that can savethe retailer up to millions of dollars in costs while driving salesacross the enterprise. The key is knowing what it takes to win andlining up the decisions, data, and analytics to support and executefor success. This process can be facilitated with experienced retailanalytics experts who can help with defining data requirements forprojects and mapping data sources to the project.7 2014 Cisco Systems, Inc. All rights reserved. This document is Cisco Public Information.
Beyond Big DataWhite PaperUse Cases: Retail Analytics in theReal WorldThe applied uses of analytics to real-world decision making arenumerous, and many retail industry leaders are achieving valuewith innovative new approaches. A few recent examples include: Specialty retailers using video analytics to study customerpaths and behavior, helping them to design more effectivestore layouts Big Box retailers investing in Wi-Fi networking and newmobile way-finding apps to help customers navigate throughlarge stores or malls, getting them to desired products faster Resorts and hotels investing in mobile analytics to gathershopper information from their retail spaces Mall operators using the network to track social mediaand shopping patterns, and delivering this value-addinformation to tenants Grocery and fast-moving goods retailers utilizing videoanalytics for traffic and conversion analysis, and then usingthe same information to integrate workforce managementand re-align staffing based on traffic trends Specialty retailers using social sentiment analytics to improve“voice of the customer” feedback to assess overall brandstatus and the launch of new products, services, or offersShopper Marketing Use CasesUse Case #1: Predicting resource requirementsRetailers can use analytics tools to measure traffic, wait times,and queue lengths, proactively anticipating resource demandsacross the store. For example, front-end staffing demand ingrocery can be anticipated using a combination of real-timetraffic counting, trip time data, and data on staff on hand.Resources are thus dynamically allocated based on real-timeinformation, improving productivity of labor hours and improvingcustomer satisfaction.Use Case #2: Drive traffic to the storeThrough presence and location-based mobility analytics,retailers pinpoint the location of opt-in shoppers when theyare close to a store location. With personalized reminders ordiscount offers sent directly to their smartphones, consumersare more motivated to visit the store if they are nearby.Use Case #3: Personalized digital engagementCombining social and mobile analytics with loyalty information,retailers can create personalized, more relevant engagementswith shoppers. For example, say that a customer enters theshoe department. Their store history shows that 60% of pastpurchases included a coupon. The retailer can improve thechance of another sale by sending, in real time, a special offeror communicating through Twitter about a current promotion.Such communications change the customer/store relationshipfrom transaction-based to more value-based, creating moresustainable brand loyalty.Use Case #4: Counteract showroomingRetailers can leverage customer showrooming activitiesby providing real-time discounts and price matching on theshopper’s mobile device based on their location in the store.For example, analytics from mobile or video may detect highwait times in a department or category. In response, thestore can alert staff to offer immediate assistance, or senda personalized offer to the shopper’s mobile device. Thiscapability turns showrooming from a threat into a promotionalopportunity, improves the shopper’s opinion of the store(which they are also more likely to share online), and buildsa strong long-term relationship.Use Case #5: Improving return on marketing campaignsBased on gathered path-to-purchase (P2P) data, Marketingcan use analytics capabilities to assess campaign effectivenessand make dynamic adjustments to optimize results. The dataanswers questions such as: Did the campaign drive traffic tothe store? Did consumers get to the store but not to the aisleor category promoted? Did they visit the aisle but not stop atthe promoted display area? Did they stop but not purchase?Was the item being promoted in stock? Did the shopper stillnot buy? Was there an issue with the price, the assortment,or other factors? Each answer drives a different action forimproving the campaign.8 2014 Cisco Systems, Inc. All rights reserved. This document is Cisco Public Information.
Beyond Big DataUse Case #6: Remote management of merchandisingcompliance in-storeUse of video and analytics (mobile or video) can helpensure consistent deployment of shopper marketing tactics.For example, if a campaign calls for a set of SKUs to beprominently displayed at the front of the store, video candetect variances in a designated planogram as well as offerremote observation of the displays across many stores.Analytics such as dwell times are used to detect variationsthat flag stores that are out of compliance. This reduces oreliminates the cost and time normally required for store visitsand phone calls confirming set-ups.Use Case #7: Optimize use of “expert” resourcesPresence-based analytics can be used to detect when ashopper is in a particular department and may be in need ofassistance. For example, grocery store staff is alerted to acustomer who has been in the premium red wines section foran above-average amount of time. In response, a wine specialistwho has been busy in other sections is immediately deployed tooffer help. This optimizes an expert sales resource at the righttime, while also providing better service across the entire store.Re
reflect and impact the customer journey. Such analytics are essential for creating differentiation, as they provide insights into how and why shoppers make the decisions they make along their path to purchase. Metrics generated from mobile, video, web, and social media help to improve shopper marketing as well as operations (Table 1 shown on .