Transcription
Mathematics: applications andinterpretationHigher level and Standard levelSpecimen papers 1, 2 and 3First examinations in 2021
CONTENTSMathematics: applications and interpretation higher levelpaper 1 specimen paperMathematics: applications and interpretation higher levelpaper 1 markschemeMathematics: applications and interpretation higher levelpaper 2 specimen paperMathematics: applications and interpretation higher levelpaper 2 markschemeMathematics: applications and interpretation higher levelpaper 3 specimen paperMathematics: applications and interpretation higher levelpaper 3 markschemeMathematics: applications and interpretation standard levelpaper 1 specimen paperMathematics: applications and interpretation standard levelpaper 1 markschemeMathematics: applications and interpretation standard levelpaper 2 specimen paperMathematics: applications and interpretation standard levelpaper 2 markscheme
SPEC/5/MATAI/HP1/ENG/TZ0/XXMathematics: applications and interpretationHigher levelPaper 1Specimen paperCandidate session number2 hoursInstructions to candidatesyyyyyyyyyyyyWrite your session number in the boxes above.Do not open this examination paper until instructed to do so.A graphic display calculator is required for this paper.Answer all questions.Answers must be written within the answer boxes provided.Unless otherwise stated in the question, all numerical answers should be given exactly orcorrect to three significant figures.yy A clean copy of the mathematics: applications and interpretation formula booklet isrequired for this paper.yy The maximum mark for this examination paper is [110 marks].24 pages International Baccalaureate Organization 201824EP01
–2–Please do not write on this page.Answers written on this pagewill not be marked.24EP02SPEC/5/MATAI/HP1/ENG/TZ0/XX
–3–SPEC/5/MATAI/HP1/ENG/TZ0/XXAnswers must be written within the answer boxes provided. Full marks are not necessarily awardedfor a correct answer with no working. Answers must be supported by working and/or explanations.Solutions found from a graphic display calculator should be supported by suitable working. For example,if graphs are used to find a solution, you should sketch these as part of your answer. Where an answeris incorrect, some marks may be given for a correct method, provided this is shown by written working.You are therefore advised to show all working.1.[Maximum mark: 6]At the end of a school day, the Headmaster conducted a survey asking students in how manyclasses they had used the internet.The data is shown in the following table.Number of classes in whichthe students used the internetNumber of students(a)0123456202430k1031State whether the data is discrete or continuous. [1]The mean number of classes in which a student used the internet is 2.(b)Find the value of k . [4]It was not possible to ask every person in the school, so the Headmaster arranged thestudent names in alphabetical order and then asked every 10th person on the list.(c)Identify the sampling technique used in the survey. [1] Turn over24EP03
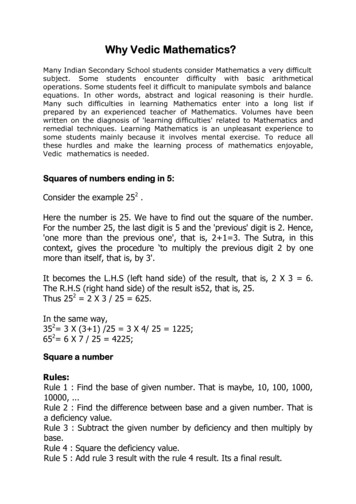
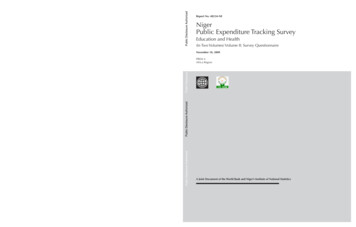
–4–[Maximum mark: 5]The perimeter of a given square P can be represented by the function P ( A) 4 A , A 0 ,where A is the area of the square. The graph of the function P is shown for 0 A 25 .20Perimeter (P)2.SPEC/5/MATAI/HP1/ENG/TZ0/XX1010Area (A)20(a)Write down the value of P (25) . [1](b)On the axes above, draw the graph of the inverse function, P -1 . [3](c)In the context of the question, explain the meaning of P -1 (8) 4 . [1] 24EP04
–5–3.SPEC/5/MATAI/HP1/ENG/TZ0/XX[Maximum mark: 6]Professor Vinculum investigated the migration season of the Bulbul bird from their naturalwetlands to a warmer climate.He found that during the migration season their population, P could be modelled by P 1350 400(1.25) - t , t 0 , where t is the number of days since the start of themigration season.(a)Find the population of the Bulbul birds,(i)at the start of the migration season.(ii)in the wetlands after 5 days. [3](b)Calculate the time taken for the population to decrease below 1400. [2](c)According to this model, find the smallest possible population of Bulbul birds during themigration season. [1] Turn over24EP05
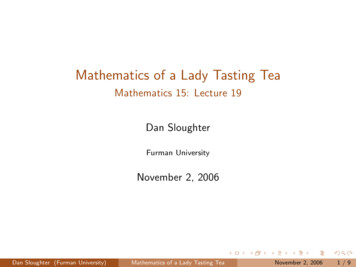
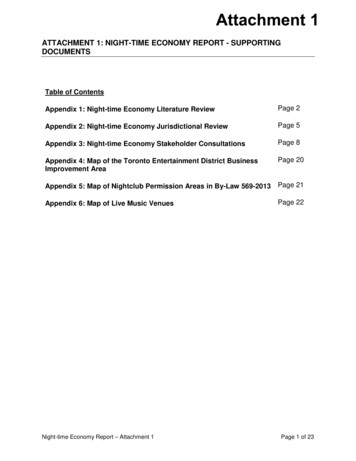
–6–4.SPEC/5/MATAI/HP1/ENG/TZ0/XX[Maximum mark: 6]Points A (3 , 1) , B (3 , 5) , C (11 , 7) , D (9 , 1) and E (7 , 3) represent snow shelters in theBlackburn National Forest. These snow shelters are illustrated in the following coordinate axes.Horizontal scale: 1 unit represents 1 km.Vertical scale: 1 unit represents 1 km.y12108C6B4E20 2A24D6810121416x 4(a)Calculate the gradient of the line segment AE. [2](This question continues on the following page)24EP06
–7–SPEC/5/MATAI/HP1/ENG/TZ0/XX(Question 4 continued)The Park Ranger draws three straight lines to form an incomplete Voronoi diagram.y12108C6B4E20 2A24D6810121416x 4(b)Find the equation of the line which would complete the Voronoi cell containing site E.Give your answer in the form ax by d 0 where a , b , d . (c)In the context of the question, explain the significance of the Voronoi cell containing site E. [1][3] Turn over24EP07
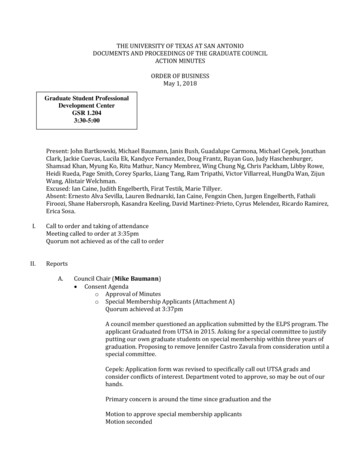
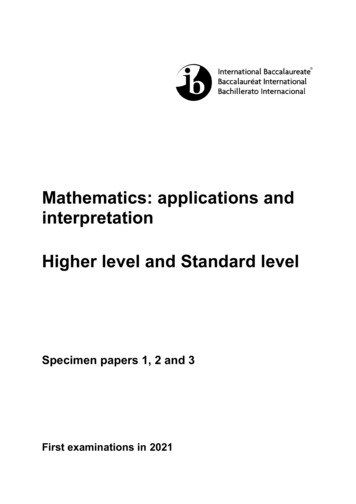
–8–5.SPEC/5/MATAI/HP1/ENG/TZ0/XX[Maximum mark: 5]Helen is building a cabin using cylindrical logs of length 2.4 m and radius 8.4 cm. A wedge iscut from one log and the cross-section of this log is illustrated in the following diagram.diagram not to scaleBA 8.4 cm 50O2.4 m(a)Find 50 in radians. [1](b)Find the volume of this log. [4]
3. [Maximum mark: 6] Professor Vinculum investigated the migration season of the Bulbul bird from their natural wetlands to a warmer climate. He found that during the migration season their population, P could be modelled by P 1350 400(1.25)-t, t 0 , where t is the number of days since the start of the migration season.