Transcription
MD-16-SHA/MSU/4-3Larry Hogan, GovernorBoyd K. Rutherford, Lt. GovernorPete K. Rahn, SecretaryGregory C. Johnson, P.E., AdministratorSTATE HIGHWAY ADMINISTRATIONRESEARCH REPORTHIGHWAY RUNOFF STORMWATER MANAGEMENTPOTENTIAL (HRSMP) SITE CHARACTERIZATION USINGNASA PUBLIC DOMAIN IMAGERYFREDERICK K. WILSON, PHD (PI)OLUDARE OWOLABI, DSC, P.E (CO-PI)ARTHUR WILLOUGHBYJAMES WHITNEY II, PHDMORGAN STATE UNIVERSITYFINAL REPORTApril 2016
DISCLAIMERThe contents of this report reflect the views of the author who is responsible for the facts and theaccuracy of the data presented herein. The contents do not necessarily reflect the official views orpolicies of the Maryland State Highway Administration. This document is disseminated under thesponsorship of the U.S. Department of Transportation, University Transportation Centers program,in the interest of information exchange. The U.S. government assumes no liability for the contentsand use thereof. This report does not constitute a standard, specification, or regulation.ii
Technical Report Documentation Page1.Report No.2. Government Accession No.3. Recipient's Catalog No.MD-16-SHA/MSU/4-34. Title and Subtitle5. Report DateHighway Runoff Stormwater Management Potential (HRSMP) SiteCharacterization Using NASA Public Domain Imagery6. Performing Organization Code7. Author/s8. Performing Organization Report No.April 2016Frederick K. Wilson, Oludare Owolabi, Arthur Willoughby, and JamesWhitney II9. Performing Organization Name and Address10. Work Unit No. (TRAIS)Morgan State University1700 E. Cold Spring Ln.Baltimore, MD 2125111. Contract or Grant No.12. Sponsoring Organization Name and Address13. Type of Report and Period CoveredMD-16-SHA/MSU/4-3Maryland State Highway AdministrationOffice of Policy & Research707 North Calvert StreetBaltimoreMD21202Final Report14. Sponsoring Agency Code(7120) STMD - MDOT/SHA15. Supplementary NotesProject performed in cooperation with the Maryland State Highway Administration.The focus of this research project was the development of geospatial technology (GST) methodology tocharacterize and evaluate highway runoff stormwater management potential (HRSMP) sites in order toreduce their impact on properties, save lives and cut operational costs. Reduction of Total Maximum DailyLoad (TMDL), an important initiative of the SHA, could undoubtedly be achieved through thedevelopment and use of GST (remote sensing, geographic information system (GIS), and differentialglobal positioning system (DGPS)). Field activities and groundtruthing were conducted at selected BMPsites to better understand their conditions and the land use/land cover (LULC) types currently present atthese sites. Landsat images were assessed for quality-related issues including cloud cover and downloadedfrom USGS. Based on the outcome of the image assessment, 5 Landsat TM and 1 Landsat OLI TIRSimages which span from 1990 to 2015 were processed and analyzed using the Environment for VisualizingImages (ENVI) software. LULC and the normalized difference vegetation index (NDVI) images werecreated. Both LULC and NDVI values for the selected BMP sites, which were ranked by the SHA from I(Good) to IV (Failed), were extracted and analyzed to determine their relationship with the performances.The results from the LULC analyses suggested that vegetation was a major factor affecting theperformance of the BMP facilities; poor and failed sites showed the excessive overgrowth of vegetation.Analysis of NDVI did not show definitive results, which might have been due to the relatively low spatialresolution of the TM images. Use of higher spatial resolution such as IKONOS multispectral images in thefuture could help resolve these inconsistencies.17. Key Words18. Distribution Statement: No restrictionsBMP, Geospatial technology, Remotesensing, GroundtruthingThis document is available from the Research Division uponrequest.19. Security Classification (of this report)20. Security Classification (of this page)NoneNoneForm DOT F 1700.7 (8-72) Reproduction of form and completed page is authorized.iii21. No. Of Pages 22. Price52
TABLE OF CONTENTSPAGE #Report Cover . iDisclaimer Notice . iiTechnical Report Documentation Page . iiiTABLE OF CONTENTS . ivList of Figures . viList of Tables . viiList of Acronyms . viiiACKNOWLEDGEMENTS .xEXECUTIVE SUMMARY . xiCHAPTERS1.0. INTRODUCTION .12.0. LITERATURE REVIEW .22.1. Utilization of GST in Stormwater Management .32.2. Determination of Geospatial Features Deemed Important in WWM .52.3. Stormwater Best Management Practices (BMPs) .63.0. METHODOLOGY .73.1. Baltimore County Stormwater Management (BMP) Rated Sites .83.2. Field Activities of BMP Sites .103.3. An Overview of Landsat .123.4. Landsat Data Acquisition.124.0. ANALYSIS OF DATA AND PROCEDURES .174.1. ENVI Standard Data Files .174.2. Sub-setting the Images .174.3. Land Use/Land Cover (LULC) Analyses .194.4. Image Classification.204.5. Groundtruthing.224.6. Normalized Difference Vegetation Index .234.7. Analyses of NDVI and LULC Values .26iv
5.0. RESEARCH FINDINGS/DISCUSSION .286.0. CONCLUSIONS AND RECOMMENDATIONS FOR IMPLEMENTATION.33References .34APPENDICES .38APPENDIX A .39APPENDIX B .41v
LIST OF FIGURESFigure:Page1.Baltimore County Stormwater Management Ratings .92.Baltimore County Stormwater BMPs SHA Rated III/Poor .103.BMP Site # 030189 (US 1), SHA Rated IV/Failed .114.BMP Site # 030104 (York Rd), SHA Rated I/Good.125.USGS EE Tool for Downloading Landsat Imagery .136.Landsat Image Footprint Superimposed on the State of Maryland .147.Vector-Image Overlay (US County Map and Landsat 8 Image) .168.ENVI’s Subset by Image Window .189.Landsat TM Scene and the Study Area.1910.Spectral Profile of Landsat TM of Geospatial Features in Study Area .2011.Landsat 8 Classified Image of Study Area .2112.Landsat TM (2000) Unsupervised Classification of Study Area .2213.NDVI Landsat TM Image of Study Area .2414.Pixel Locator Window and Cursor Location/Value Window .2515.Extracting NDVI and LULC Values of Selected BMP Sites .2516.NDVI Values for BMP Rated I & IV in 2010 .2817.NDVI Values for 3 BMP Rated I.2918.Temporal Distribution of NDVI for BMP Rated I.3019.Temporal Distribution of NDVI for BMP Rated II .3020.Temporal Distribution of NDVI for BMP Rated III .3121.Temporal Distribution of NDVI for BMP Rated IV .3122.Spatial Distribution of NDVI for BMP Rated I, II, III, and IV .32vi
LIST OF TABLESTables:Page1.Comparison of the Spectral Resolution of Landsat 7 and Landsat 8 .42.Landsat Data Utilized in this Study. .153.Error Metrics Computation for Classified Images .234.NDVI Values for Selected BMP Sites .265.LULC Weighted Values for Selected BMP Sites .27vii
LIST OF ACRONYMSBMPBest Management PracticeDCRVirginia Department of Conservation and RecreationDEMDigital elevation modelDEQDepartment of Environmental QualityDGPSDifferential Global Positioning SystemDOTUS Department of TransportationENVIEnvironment for Visualizing ImagesEPAUS Environmental Protection AgencyESFENVI Standard FileETM Landsat Enhanced Thematic Mapper PlusGISGeographic Information SystemGSTGeospatial ry Center for Research in Earth Science TechnologyISAImpervious Surface AreaLDCMLandsat Data Continuity MissionLULCLand-user/land-coverMDEMaryland Department of the EnvironmentMS4sMunicipal Separate Storm Sewer SystemMSSMultispectral ScannerMSUMorgan State UniversityNASANational Aeronautics and Space AdministrationNDVINormalized Difference Vegetative IndexNIRNear InfraredNPDESNational Pollutant Discharge Elimination SystemNRCSNational Resource Conservation ServicesQAQuality AssuranceRSRemote SensingSHAMaryland State Highway AdministrationSWMStormwater Managementviii
TMLandsat Thematic MapperUAVUnmanned Aerial VehicleUSGSUnited States Geological SurveyWWMWastewater Managementix
ACKNOWLEDGMENTSThe authors wish to express their deepest appreciation and gratitude to the Maryland StateHighway Administration (SHA) for their support throughout this project and for making itpossible for Morgan State University (MSU) students to participate in a real-world transportationresearch; special thanks to Dr. Andrew Farkas and Ms. Anita Jones of MSU’s NationalTransportation Center (NTC) for supporting the students. The authors would also like to thankall the members of the technical team and staff, including Mr. Rodney Wynn, Mr. Mark Wolcott,Mr. Cornelius Barmer, Ms. Kiona Leah, Mr. Michael Weber, Ms. Allison Hardt, Ms. SharonHawkins, and Ms. Jacquae Rubin for their assistance, advisement, and expertise throughout theduration of this project.x
EXECUTIVE SUMMARYGeospatial technologies (GSTs), especially remote sensing (RS), have been widely accepted asan effective tool, available to engineers and resource managers to accomplish not just tasks butalso comply with stringent rules and regulations of the United States Environmental ProtectionAgency (EPA)/Department of Environmental Quality (DEQ), in a timely manner. GSTmethodologies, because of their extraordinary capabilities including versatility, speed, andaccuracy can provide a cost-effective alternative and enhance operations. Images from theNASA Public Domain databases, which are now available at no cost, were acquired through theUnited State Geological Survey (USGS), processed and analyzed using ENVI. The imageanalyses were done on HP workstations, and Trimble’s Handheld Differential Global PositioningSystem (DGPS) were used for field verification activities (groundtruthing) and other related insitu activities. After careful assessment and evaluation of the available image dataset, it wasdecided to use Landsat Thematic Mapper (TM), and Landsat 8 (OLI IRS)in this research.Landsat TM has a special resolution of 30 meters and spectral resolution of 7 bands. AlthoughLandsat 8 has a spectral resolution of 11 bands and one panchromatic band with a 15-meterspatial resolution, its special resolution is still 30 meters.Four Maryland State Highway Administration (SHA) ranked Stormwater Management(SWM)Best Management Practices (BMPs) were investigated in this research. SWM ranked I meantthey were performing as planned (Good); those ranked II were performing fairly (Fair); thoseranked III were satisfactory in their performance; and those ranked IV were not performing asplanned (Failed). Field activities were conducted at several of these SWM facility sites in orderto get a better understanding of the environment, examine the facilities, and acquire field dataincluding elevation, land-use/land-cover (LULC), and photographs.Based on image availability and quality (cloud cover and stripping), 6 Landsat images wereselected and analyzed for this research. Included in the analyses were LULC classification andnormalized difference vegetation index (NDVI). As was evident during the field activities, themajor geospatial feature that appeared to have changed substantially was vegetation; given thefact that the BMPs initially performed as intended minimized the need for soil and elevationanalyses. Therefore, it was decided to focus on LULC and NDVI since they could help indetermining the performance of these BMPs.The results obtained from the LULC analyses suggested that vegetation was a major factoraffecting the performance of the BMP facilities. Most of the poor and failed sites showedexcessive overgrowth of vegetation such as high brush and trees, ultimately making theminaccessible. Some that performed as originally intended had less vegetation cover (mostly lowcut grass) and were located in close proximity to streams. Analysis of the NDVI, however, didnot show definitive trend as it relates to both temporal and spatial patterns. For example, someBMPs that were ranked Failed showed increase in NDVI values, while others that performedwell (Good) also showed increase in NDVI values. The ambiguity in getting definitive resultsfrom the NDVI values must have been due to the relatively low spatial resolution of theTMimages (30 m by 30 m). Using higher spatial resolution such as IKONOS multispectralimages with a 4-meter spatial resolution could resolve these inconsistencies, an objective thatmay be included in future SWM research.xi
1.0. INTRODUCTIONThe Project focused on carrying out comprehensive reviews of literature dealing withconventional stormwater management (SWM) and geospatial SWM technology methodologies.An important outcome of this effort was to develop a comprehensive understanding ofstormwater best management practices (BMPs) that will help in site characterization usinggeospatial technology (GST) methodologies. Several BMP manuals were acquired and reviewed,including some from surrounding states, such as Pennsylvania and Virginia. The review revealedthree major focus areas: 1) research utilizing geospatial technologies including geographicinformation system (GIS) and to some extent remote sensing; 2) research into the determinationof geospatial features deemed important in wastewater management; 3) the development ofstormwater best management practices (BMPs) to effect desired goals such as improving thewater quality of our nation’s water bodies, reducing flooding, and enforcing regulations. Withregard to No. 2, for example, the majority of the materials reviewed agreed that impervioussurface area affects stormwater management. However, there are different approaches as to thetools being used to achieve accurate impervious surface area.From the time rain water hits the ground to when it enters receiving water bodies, it collectsvarious pollutants from different contaminant sources. The impact of urban runoff pollutants onthe water quality of a receiving water body may vary significantly depending upon its existingwater quality and the rates at which these pollutants are introduced into the system. Pollutantssuch as suspended solids, heavy metals, and hydrocarbons are commonly found in stormwaterrunoff. The suspended solid concentration includes contributions from street dust and erodedsediment. These solids could then deposit at the bottom of a stream, disturbing aquatic habitat.Heavy metals are found in the environment from motor vehicles, industrial land uses, andcommercial land uses. Oils, grease, and other hydrocarbons are also frequently found in highwayrunoff. (Tsihrintzis, 1997) Older basins can be redesigned and retrofitted to reduce orstop the pollutants that are entering receiving waters. However, an important consideration inretrofitting a detention basin is to ensure that the original flood control function is stillmaintained. Under space and budget restrictions, a trade-off between flood control and waterquality improvement may be necessary. (Guo, 2005)Although there are many studies on conventional stormwater management (SWM), very fewexist on the use of GST methodologies, with remote sensing (RS) for SWM. Though someliterature on GST methodologies did talk about geographic information system (GIS)applications on SWM, utilizing remotely sensed data including Landsat Thematic Mapper (TM)appears to be at the embryonic stages. This research, in contrast, used National Aeronautics andSpace Administration (NASA) Public Domain imagery such as Landsat 7 and Landsat 8.Because of its relatively coarse spatial resolution (pixel size of 30 meters by 30 meters), ancillarymultispectral images including IKONOS have been used to enhance and sharpen the selectedLandsat bands in order to use them at local scale. The Environment for Visualizing Images(ENVI) formed the main remote sensing software for this project. ENVI is able to processmultispectral images, and can also process hyperspectral and other active remotely senseddatasets including Light Detection and Ranging/LIDAR (EXELES, 2014).1
2.0. LITERATURE REVIEWA comprehensive review of the different types of methodologies utilized in stormwatermanagement was conducted. Special attention was placed on GST methodologies since thisproject used these technologies to characterize SWM sites in selected areas of Maryland (Drury,1990; Banks/USDOT, 2006). Relevant geospatial features and attributes affecting SWM wereidentified based on important information from Best Management Practices (BMPs) materialsfrom several states including Maryland. Evaluation of these materials helped avoid unnecessarymistakes and made use of the lessons learned to develop optimum SWM site characterizations(Sigh, 2000 and Dematte, 2004).A comprehensive search on literature dealing with GST and NASA Public Domain Imagery forSWM revealed limited information on the subject. Most materials were dealing with GISapplications of selected sections of the environment, stormwater, nonpoint-source pollution, orwatershed studies. This research study came up several times during the search, and appeared tobe the only one of its kind, in which NASA public domain imagery was utilized in SWM.However, it is very important to get insight into the available GIS and remote sensing applicationresources used in managing stormwater. For example, Sample et al (Sample, 2001) demonstratedthe use of GIS in stormwater modeling at a neighborhood scale. Virginia Tech’s Center forGeospatial Information Technology (CGIT) assisted Blacksburg, Va., in utilizing basic GISmethodologies to control pollutants entering its municipal stormwater sewer system; thisnationwide initiative is now known as the National Pollution Discharge Elimination System(NPDES) (Constantinescu, 2006).One of the major reasons for implementing SWM practices is to control and minimize flooding,especially from runoffs in urbanized areas (Golrang, 2013 and Meierdiercks, 2010). Unlike onsite design and implementation of SWM facilities, this project seeks to provide the SHA withadequate, effective, and timely knowledge and information on the best site locations for theconstruction of SWM infrastructures during the planning phase of projects. This will thereforeenable SHA to meet its obligations in a more cost-effective manner within a shorter period oftime.SWM has initially focused on controlling floods, especially flash floods resulting from intenseprecipitation, such as heavy rain, snow/ice/sleet melt. Runoff, the substantial portion of liquidprecipitation which did not seep into the ground or infiltrates, flows downhill into surface waterbodies such as streams, rivers, and lakes and could change the landscape through erosion. Inurbanized areas, runoff can be problematic, since it carries contamination and pollution includingoil, sediments, debris, nutrients from fertilizers, bacteria from animal and human waste,pesticides from lawn and garden chemicals, heavy metals from rooftops and roads, andpetroleum by-products from vehicles (USGS, 2015). By regulating the amount of stormwaterentering and leaving SWM, flood water quantity and pollution from stormwater water qualitycan be controlled efficiently (Davis, 2009). However, in order to get the most effectiveperformance from these SWM facilities, it is very important to know ahead of time where thebest site locations are for installing SWM infrastructures including flood control detention basins(Emerson, 2008). Some studies have addressed the use of different construction materials, likepervious concrete in SWM infiltration basins, to determine their effectiveness (Kwiatkowski,2007 and Allen, 2009). This study, however, makes use of stormwater BMPs from Maryland,and from surrounding states such as Delaware, Pennsylvania, Virginia, and the District of2
Columbia (DC). Research projects that have looked into the efficacy of SWM infrastructuredesigns and construction materials include Liu (Liu, 2008).2.1. Utilization of GST in Stormwater ManagementThe use of GIS, coupled with other geospatial methods, has been enumerated by several studiesover the past several decades including Aslan et al, 2014 and Jennings, 2012. For example,Edward Barnes and Kevin White examined the use of remote sensing to map out soil propertiesand various geospatial features (Barnes, 2003 and White, 1998). Other researchers, such asMatthew Becker (Becker, 2005) reported on remote sensing applications that were used inpredicting hydrologic behavior. Xiaohui Zhang researched the impact of remote sensingresolution on hydrologic parameterization, and impervious areas were extracted from Landsatand SPOT – a French remote sensing satellite system (Zhang, 2000). Rogers’ research focusedon using satellite technology to calculate impervious surface area in watershed scale. Thebenefits of remote sensing were described and examples of the extensive applications given,including direct water quality assessment, evapotranspiration research, urban growth and sprawlstudies, and land-use-change analysis. The advantages of IKONOS satellite imagery overLandsat is its high spatial resolution. However, its high cost presents a challenge to mostresource management dealing with accurate impervious area extraction research. Nevertheless,as the price of commercial satellite imagery such as IKONOS decreases, and image processingcosts fall, the possibility of using satellite remote sensing by smaller communities andmunicipalities will become a reality (Rogers, 2004).Matt Deane examined the applications of both GIS and remote sensing in SWM (Deane, 2012).Deane described the roles of municipalities and state government as it relates to SWM throughthe imposition of the US Environmental Protection Agency (EPA) NPDES Phase I and IIregulations. The cause-consequence relationships of geospatial features such as impervioussurface due to increased urbanization and pollutants, and other impairments to the quality ofnatural water bodies and the natural system, were reviewed. Deane also touched on the use ofBMPs to combat deleterious effects of stormwater. For example, whether the BMP happens to bestructural or not, the goals remain the same, to reduce peak flow through infiltration, retention, ordetention of the runoff, decrease the amount of nutrient entering the natural water bodies, reducesoil erosion, and minimize the amount of sedimentation.According to Deane, some of the uses of GIS and remote sensing in stormwater management hadto do with the planning and implementation of BMP. Digital elevation model (DEM), landcover/land-use (LCLU), and impervious surface area (ISA) were very high on his list as veryimportant geospatial datasets for addressing SWM. He provided some sources where thesedataset can be obtained, including the soils from the National Resource Conservation Services(NRCS) and DEM from the US Geological Survey (USGS). Trauth discusses the role of remotesensing in assisting with site specific, watershed-based planning and ongoing management. Theresearch was conducted under the auspices of the Interdisciplinary Center for Research in EarthScience Technology (ICREST). Effort was made to develop tools, methodologies, andinformation by different technical disciplines that meet customer requirements. (Trauth, 2004)3
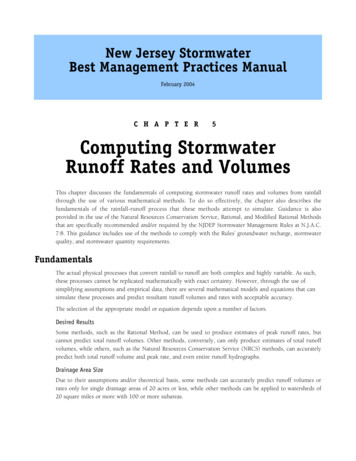
It should be noted, however, that very few studies have reported on the use of NASA PublicDomain Imagery for SWM practices. Because of the high quality standard required by the SHA,this research focused on using imageries from the Landsat Data Continuity Mission (LDCM),including Landsat Thematic Mapper (TM), Landsat Enhanced Thematic Mapper Plus (ETM ),and Landsat 8 (Irons, 2012). An important condition of the Landsat Data Continuity Mission(LDCM) regarding the properties of deployed sensors is not just their spatial resolution but theirspectral resolution as well (see Table 1).Table 1. Comparison of the Spectral Resolution of Landsat 7 and Landsat 8 (credit: LandsatScience, http://landsat.gsfc.nasa.gov/?page id 7195).Table 1 makes it easier to choose the right bands for the task, regardless of the sensor. Apartfrom the Band number, each band also has its wavelength range, and its spatial resolution. Band8, which has a spatial resolution of 15 meter by 15 meter (a panchromatic band), can be used forsharpening the other bands.Khan and Singh (Khan, 2000) used the IRS-LISS-II to characterize and map soils in an aridsection of Western Rajasthan. IRS-LISS-II is the Indian Remote Sensing Satellite sensor, whichhas a spatial resolution of 36 meters, and a spectral resolution of 4 Bands (1/Blue, 0.45-0.52micron; 2/Green, 0.52-0.59 micron; 3/Red, 0.62-0.68 micron; and 4/near Infra Red, 0.77-0.86micron). Visual analysis and interpretation were used to process the remotely sensed images(Bands 2, 3, and 4), which were then enhanced with groundtruth and soils data to generatephysiographic and soil maps of the area. It should be said here that the results might have beenimproved if digital processing of the images had been employed. Nonetheless, Khan and Singhwere able to use remote sensing to map a relatively large area quickly, which is one of thebenefits of GST. Spatial resolution has been identified by many studies to be a major factor in4
determining the classification accuracy of remote sensing imagery (Narayanan, 2010). Thespatial resolution of IRS-LISS-II sensor is 36 meters, which happens to be relatively high,though not as high as Landsat TM, which is 30 meters and is being used in this project.On the potential use of remote sensing for groundwater studies, some studies suggests combiningremote sensing data with ancillary data like numerical modeling, geographic GIS, and groundbased information. For example, since remote sensing has been proven to be very useful insurface hydrology studies, then the possibilities exist for using it to monitor expressions ofgroundwater (Becker, 2005).Some research has reported on the use of hyperspectral remote sensing for characterizing soilfeatures (Damatte, 2006), while others have reported on the shortcomings of the LandsatThematic Mapper (TM), which although being a multispectral sensor, lacks the spatialresolution needed for the acquisition of the necessary details for urban land-use/land-coverplanning (Thomas, 2003). It must be noted, that in order to address this challenge posed byLandsat TM, this research used Band Sharpening Procedures (specialized remote sensingtechnique) provided by the Environment for Visualizing Images (ENVI) to enhance the LandsatTM bands (NASA, 2015
Project performed in cooperation with the Maryland State Highway Administration. The focus of this research project was the development of geospatial technology (GST) methodology to characterize and evaluate highway runoff stormwater management potential (HRSMP) sites in order to