Transcription
New Jersey StormwaterBest Management Practices ManualFebruary 2004C H A P T E R5Computing StormwaterRunoff Rates and VolumesThis chapter discusses the fundamentals of computing stormwater runoff rates and volumes from rainfallthrough the use of various mathematical methods. To do so effectively, the chapter also describes thefundamentals of the rainfall-runoff process that these methods attempt to simulate. Guidance is alsoprovided in the use of the Natural Resources Conservation Service, Rational, and Modified Rational Methodsthat are specifically recommended and/or required by the NJDEP Stormwater Management Rules at N.J.A.C.7:8. This guidance includes use of the methods to comply with the Rules’ groundwater recharge, stormwaterquality, and stormwater quantity requirements.FundamentalsThe actual physical processes that convert rainfall to runoff are both complex and highly variable. As such,these processes cannot be replicated mathematically with exact certainty. However, through the use ofsimplifying assumptions and empirical data, there are several mathematical models and equations that cansimulate these processes and predict resultant runoff volumes and rates with acceptable accuracy.The selection of the appropriate model or equation depends upon a number of factors.Desired ResultsSome methods, such as the Rational Method, can be used to produce estimates of peak runoff rates, butcannot predict total runoff volumes. Other methods, conversely, can only produce estimates of total runoffvolumes, while others, such as the Natural Resources Conservation Service (NRCS) methods, can accuratelypredict both total runoff volume and peak rate, and even entire runoff hydrographs.Drainage Area SizeDue to their assumptions and/or theoretical basis, some methods can accurately predict runoff volumes orrates only for single drainage areas of 20 acres or less, while other methods can be applied to watersheds of20 square miles or more with 100 or more subareas.
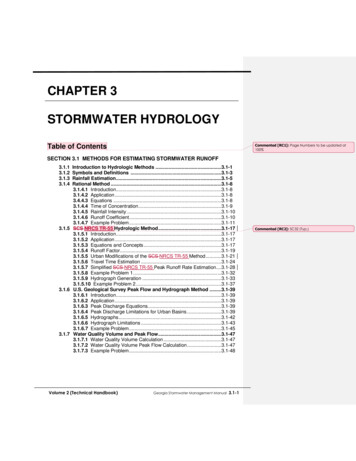
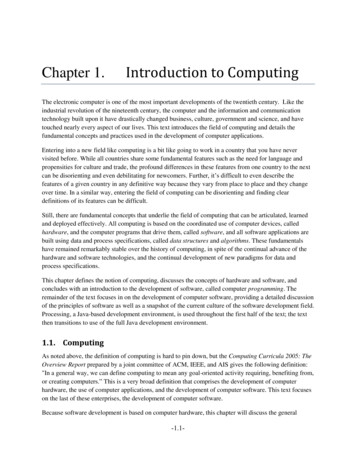
Data AvailabilitySimple methods, such as the Rational or Modified Rational Methods, require limited rainfall and drainagearea data, while other, more sophisticated methods have extensive data needs, including long-term rainfalland temperature data as well as drainage area soils, subsoil, and ground cover information. In general, themore data-intensive models can produce more comprehensive runoff predictions.In general, stormwater runoff can be described as a by-product of rainfall’s interaction with the land. Thisinteraction is one of several processes that the earth’s water may go through as it continually cycles betweenthe land and the atmosphere. In addition, stormwater runoff is only one of many forms water may takeduring one of these cycles, known scientifically as the hydrologic cycle. Shown in Figure 5-1 below, thehydrologic cycle depicts both the primary forms that water can take and the cyclical processes that producethem. In addition to runoff, these processes include precipitation, evaporation from surfaces or theatmosphere, evapotranspiration by plants, and infiltration into the soil or groundwater. As such, water thatprecipitates as rainfall can wind up or at least spend time on ground or plant surfaces, in the atmosphere,within the various soil layers, or in waterways and water bodies.Figure 5-1: The Hydrologic CycleSource: Fundamentals of Urban Runoff Management.In general, all runoff computation methods are, to some degree, mathematical expressions of thehydrologic cycle. However, most transform its cyclical character to a linear one, treating rainfall as an inputand producing runoff as an output. During this transformation, each method uses mathematicalapproximations of the real rainfall-runoff processes to produce its estimates of runoff volume and/or rate. Asdescribed above, each method has its own complexity, data needs, accuracy, and range of results.As the key input, rainfall is generally characterized by its size, intensity, and the frequency of itsoccurrence. The size of a rain storm is the total precipitation that occurs over a particular duration. HowNew Jersey Stormwater Best Management Practices Manual Chapter 5: Computing Stormwater Runoff Rates and Volumes February 2004 Page 5-2
often this size of storm is likely to reoccur is called its recurrence interval. For instance, a rainfall of certainduration that occurs, on average, once every 25 years would have an average recurrence interval of 25 yearsor be called a 25-year storm.Since storms have been shown to be mathematically random events, their recurrence can also bespecified as an annual probability. The equation for converting between recurrence interval and annualprobability is:Annual probability (in percent) 100/recurrence interval (in years)For example, the 25-year storm noted above could also be described as having a probability of 4 percent( 100/25) or a 4 percent chance of being equaled or exceeded in any given year. Similarly, a 2-year stormhas a 50 percent chance ( 100/2), a 10-year storm has a 10 percent chance ( 100/10), and a 100-yearstorm has a 1 percent chance ( 100/100) of being equaled or exceeded in a given year. Resultant runoffpeak rates and volumes events can also be described in such terms.Runoff volumes are influenced primarily by the total amount of rainfall. However, runoff rates resultingfrom a given rainfall, including the peak rate or discharge, are influenced primarily by the rainfall’sdistribution, which is how the rainfall rate or intensity varies over a period of time. Studies of rainfallrecords show that actual storm distributions and durations can vary considerably from event to event. Arainfall may be evenly distributed over a time period or can vary widely within that same period. Itsduration can also be long or very short. These different types of rain events can produce extremely differentrunoff volumes and peak discharges.Runoff computation methods deal with this rainfall variability in one of two general ways. Manymethods, including the Rational and NRCS methods, rely on a hypothetical rain event known as a designstorm for their rainfall input. This single, hypothetical storm event is based on a compilation of local orregional rainfall data recorded over an extended time period. To use a design storm, the user must makesome assumptions about the antecedent ground and waterway conditions that exist at its start. Most runoffcomputations are based on average antecedent conditions, although wetter or drier conditions can also beused depending upon the user’s interests and concerns.Instead of compiling long-term rainfall data into a single design storm, other runoff computationmethods address the variability of real rain events by analyzing a long series of them, computing runoff rateand volume estimates for each. While such methods need only the exact antecedent conditions that existedprior to the first storm, they must mathematically account for changes in ground and waterway conditionsduring intervening dry periods. Therefore, such methods are generally more complex than design stormmethods and, obviously, require extensive rainfall data for the drainage area or watershed under analysis.Their results, however, are based on the actual long-term rainfall history of the watershed instead of asingle, hypothetical design storm.In addition to rainfall and antecedent conditions, other factors that can significantly affect both runoffvolume and peak discharge are the hydrologic characteristics of the soils in the watershed and the type ofsurface that covers those soils. This cover may vary from pervious surfaces such as woods and grass toimpervious surfaces such as roofs, roadways, and parking lots. Another factor that can greatly influence thepeak runoff rate or discharge is the time of concentration (Tc). This is a measure of how quickly or slowly awatershed will respond to rainfall input and is usually measured as the time required for runoff to travelfrom the hydraulically most distant point in the watershed to the point of analysis at the watershed’s lowerend. Factors such as surface roughness, irregularity, length, and slope generally affect a watershed’s Tc.In summary, runoff computation methods attempt to mathematically reproduce or simulate thehydrologic cycle. They treat rainfall as an input, converting it into estimates of resultant runoff volumeand/or rate. There are certain characteristics of both the rainfall event and the area upon which it falls thatcan influence the resulting runoff. These include:New Jersey Stormwater Best Management Practices Manual Chapter 5: Computing Stormwater Runoff Rates and Volumes February 2004 Page 5-3
1. High intensity rainfall will generally produce a greater peak discharge than a rainfall that occursover a longer time period.2. Highly porous or permeable soils that can rapidly infiltrate rainfall generally produce less runoffvolume than soils with more restrictive infiltration.3. Dense vegetation such as woodland intercepts and help infiltrates rainfall, thereby reducing runoffvolumes and rates.4. Conversely, impervious areas such as roadways and rooftops prevent infiltration and increaserunoff volumes and rates.5. Drainage areas with shorter times of concentration will have higher peak runoff rates than thosewith a longer Tc.Runoff Computation MethodsAs described in the Stormwater Management Rules, the NJDEP has specified that one of two general runoffcomputation methods be used to compute runoff rates and volumes. These are the NRCS methodology,which consists of several components, and the Rational Method (and the associated Modified RationalMethod), which are generally limited to drainage areas less than 20 acres. A general description of eachmethod is provided below.NRCS MethodologyThe USDA Natural Resources Conservation Service (NRCS) methodology is perhaps the most widely usedmethod for computing stormwater runoff rates, volumes, and hydrographs. It uses a hypothetical designstorm and an empirical nonlinear runoff equation to compute runoff volumes and a dimensionless unithydrograph to convert the volumes into runoff hydrographs. The methodology is particularly useful forcomparing pre- and post-development peak rates, volumes, and hydrographs. The key component of theNRCS runoff equation is the NRCS Curve Number (CN), which is based on soil permeability, surface cover,hydrologic condition, and antecedent moisture. Watershed or drainage area time of concentration is the keycomponent of the dimensionless unit hydrograph.Several runoff computation methods use the overall NRCS methodology. The most commonly used arethe June 1986 Technical Release 55 – Urban Hydrology for Small Watersheds (TR-55), the April 2002 WinTR55 – Small Watershed Hydrology computer program, and Technical Release 20 – Computer Program for ProjectFormulation: Hydrology (TR-20) published by the NRCS. The computer programs HEC-1 Flood HydrographPackage and HEC-HMS Hydrologic Modeling System published by the U.S. Army Corps of Engineers’Hydrologic Engineering Center also contain components of the NRCS methodology. A complete descriptionof the NRCS methodology can be found in the NRCS National Engineering Handbook Section 4 – Hydrology(NEH-4).Rational MethodThe Rational Method uses an empirical linear equation to compute the peak runoff rate from a selectedperiod of uniform rainfall intensity. Originally developed more than 100 years ago, it continues to be usefulin estimating runoff from simple, relatively small drainage areas such as parking lots. Use of the RationalMethod should be limited to drainage areas less than 20 acres with generally uniform surface cover andtopography. It is important to note that the Rational Method can be used only to compute peak runoff rates.Since it is not based on a total storm duration, but rather a period of rain that produces the peak runoff rate,the method cannot compute runoff volumes unless the user assumes a total storm duration. Completedescriptions of the Rational Method can be found in many hydrology and drainage textbooks.New Jersey Stormwater Best Management Practices Manual Chapter 5: Computing Stormwater Runoff Rates and Volumes February 2004 Page 5-4
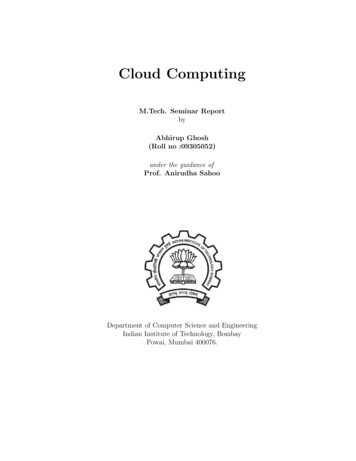
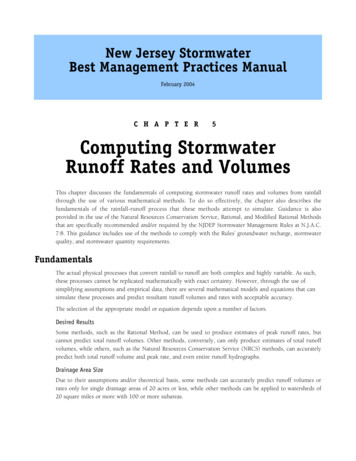
Modified Rational MethodThe Modified Rational Method is a somewhat recent adaptation of the Rational Method that can be used tonot only compute peak runoff rates, but also to estimate runoff volumes and hydrographs. This method usesthe same input data and coefficients as the Rational Method along with the further assumption that, for theselected storm frequency, the duration of peak-producing rainfall is also the entire storm duration. Since,theoretically, there are an infinite number of rainfall intensities and associated durations with the samefrequency or probability, the Modified Rational Method requires that several of these events be analyzed inthe method to determine the most severe. Similar to the Rational Method, there are several urban hydrologyand drainage publications that contain descriptions of the Modified Rational Method, including AppendixA-9 of the Standards for Soil Erosion and Sediment Control in New Jersey published by the New Jersey State SoilConservation Committee. Use of the Modified Rational Method should also be limited to drainage areas lessthan 20 acres with generally uniform surface cover and topography.Design StormsTo fully comply with the NJDEP Stormwater Management Rules, stormwater runoff must be computed forthree types of rainfall or storm events. These storms are associated with the groundwater recharge,stormwater quality, and stormwater quantity requirements in the Rules. A description of each storm and thetechniques used to model it in the NRCS, Rational and Modified Rational methods are presented below.Groundwater Recharge Design StormAs described in detail in Chapter 6: Groundwater Recharge, the NJDEP’s groundwater recharge requirementsare actually met through the analysis of a series of rainfall events derived from long-term New Jersey data.However, these events can also be expressed by an equivalent groundwater recharge design storm thatrepresents the largest rainfall that must be controlled by a groundwater recharge facility. Due to therelatively small size of both the statistical rainfall series and the equivalent Design Storm, the NJDEP hasdeveloped specialized equations to compute the resultant runoff volume from each. The basis and use ofthese equations are described in detail in Chapter 6: Groundwater Recharge.Stormwater Quality Design StormThis is the rainfall event used to analyze and design structural and nonstructural stormwater qualitymeasures (known as Best Management Practices or BMPs). As described in the Stormwater ManagementRules, the NJDEP stormwater quality design storm has a total rainfall depth of 1.25 inches and a totalduration of two hours. During its duration, the rain falls in a nonlinear pattern as depicted in Figure 5-2below. This rainfall pattern or distribution is based on Trenton, New Jersey rainfall data collected between1913 and 1975 and contains intermediate rainfall intensities that have the same probability or recurrenceinterval as the storm’s total rainfall and duration. As such, for times of concentration up to two hours, thestormwater quality design storm can be used to compute runoff volumes, peak rates, and hydrographs ofequal probability. This ensures that all stormwater quality BMPs, whether they are based on total runoffvolume or peak runoff rate, will provide the same level of stormwater pollution control.New Jersey Stormwater Best Management Practices Manual Chapter 5: Computing Stormwater Runoff Rates and Volumes February 2004 Page 5-5
Figure 5-2: NJDEP 1.25-Inch/2-Hour Stormwater Quality Design StormThe NJDEP stormwater quality design storm can be used to analyze and design stormwater quality BMPsbased on the Rational, Modified Rational, or NRCS methods. Selection of the appropriate method willdepend on the type of BMP selected and its required design data. BMPs that essentially store, treat, andslowly release the stormwater quality design storm runoff (such as extended detention basins, wet ponds,constructed stormwater wetlands, and sand filters) generally require a runoff volume at the very least and,ideally, an entire runoff hydrograph. This mandates the use of either the NRCS methodology or ModifiedRational Method. However, BMPs that treat the stormwater quality design storm runoff as it is conveyedthrough them (such a filter strip, buffer or manufactured treatment device) generally require only a peakrunoff rate. This can be computed using either the NRCS or Rational Methods. Further information on theuse of these methods is presented below. When using either the Rational or Modified Rational Methods, it isimportant to remember their 20-acre drainage area limitations.Table 5-1 was prepared for those using the NRCS methodology to compute stormwater quality designstorm runoff peaks or hydrographs. It contains cumulative and incremental rainfall values for thestormwater quality design storm in five minute increments. These values can be used in computer programssuch as TR-20, HEC-1, HEC-HMS, and other programs that both contain the NRCS methodology and allowuser-specified rainfalls.New Jersey Stormwater Best Management Practices Manual Chapter 5: Computing Stormwater Runoff Rates and Volumes February 2004 Page 5-6
Table 5-1: NJDEP 1.25-Inch/2-Hour Stormwater Quality Design StormCumulative and Incremental Rainfall te: See Figure 5-1 for plot of cumulative rainfall distribution.New Jersey Stormwater Best Management Practices Manual Chapter 5: Computing Stormwater Runoff Rates and Volumes February 2004 Page 5-7
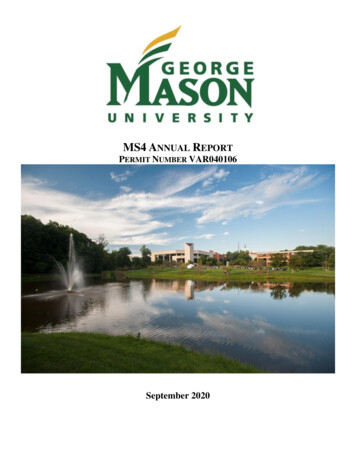
Figure 5-3 was prepared for those using the Rational Method to compute stormwater quality design stormrunoff peaks. It presents the stormwater quality design storm as a rainfall intensity-duration curve thatallows the user to determine the appropriate rainfall intensity for the selected time of concentration.Figure 5-3: NJDEP 1.25-Inch/2-Hour Stormwater Quality Design StormRainfall Intensity-Duration CurveFinally, when using the Modified Rational Method to compute a stormwater quality design stormhydrograph, the entire 2-hour storm duration at an average intensity of 0.625-inches/hour can be used.Example 5-1 below demonstrates this procedure.Important Note: While the stormwater quality design storm actually falls in a variable pattern, use of the 2hour average rate described above and demonstrated in Example 5-1 is consistent with the assumptions ofthe Modified Rational Method. In addition, analysis and experience has shown that the structural BMPs thatstore and slowly release the stormwater quality design storm hydrograph (such as extended detentionbasins, wet ponds, bioretention facilities, constructed wetlands, and sand filters) are not particularlysensitive to rainfall pattern. If such sensitivity does exist for a particular BMP, the designer should use theNRCS methodology, which allows for consideration of the stormwater quality design storm’s variablerainfall pattern.New Jersey Stormwater Best Management Practices Manual Chapter 5: Computing Stormwater Runoff Rates and Volumes February 2004 Page 5-8
Example 5-1: NJDEP 1.25-Inch/2-Hour Stormwater Quality Design StormHydrograph Computation with Modified Rational MethodDescription: A 10-acre development site has a Rational C value of 0.78 and a time of concentration of 15 minutes.Construct a runoff hydrograph from the site for the 1.25-inch/2-hour stormwater quality design storm using the ModifiedRational Method.C 0.78Average I 1.25-inches/2-hours 0.625 inches per hourArea 10 acresTc 15 minutesStorm duration 2 hoursQ runoff rate (cubic feet per second) CIAC Rational Method runoff coefficientI rainfall intensity (inches per hour)A drainage area (acres)D storm duration (hours)Q (0.78) (0.625 inches per hour)(10 acres) 4.9 CFSIn the Modified Rational Method, the runoff hydrograph is then constructed as shown here:Finally, the total runoff volume is equal to the area under the hydrograph, which is equal to the peak runoff rate times theduration of the storm.V peak runoff rate x storm duration Q x DV 4.9 cubic feet/second x 2 hours x 3600 seconds/hourV 35280 cubic feet 0.81 acre-feetNew Jersey Stormwater Best Management Practices Manual Chapter 5: Computing Stormwater Runoff Rates and Volumes February 2004 Page 5-9
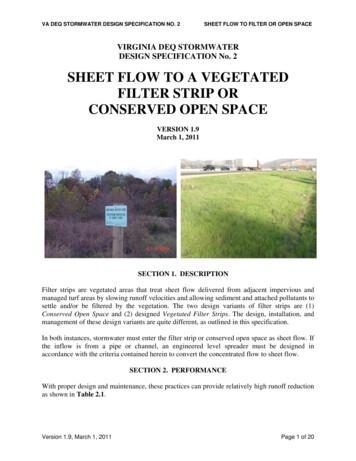
Stormwater Quantity StormsAs described in the Stormwater Management Rules, the three storm frequencies of primary concern forstormwater quantity control are the 2, 10, and 100-year events. These storms are of such concern due totheir potential to cause or aggravate downstream erosion and/or flooding. In certain instances, however,additional storm frequencies may need to be analyzed to ensure that downstream peak runoff rates and/orvelocities are not increased by a land development or redevelopment project.Selection of the appropriate stormwater quantity storm data will depend on the runoff estimation methodbeing used. When using the NRCS methodology, the NRCS Type III Storm distribution should be selected.Details and data regarding this distribution can be found in the NRCS Technical Release 55 – UrbanHydrology for Small Watersheds. When using the Rational Method, the rainfall intensity-duration-frequency(IDF) curves shown in Figure 5-4 may be used. These curves were developed from Trenton area rainfalldata between 1913 and 1975 and were adapted from Figure 2.1-2 in the Technical Manual for StreamEncroachment Permits prepared by the NJDEP Land Use Regulation Program. IDF curves based on rainfalldata collected closer to an actual land development or redevelopment site may also be used if such datacovers a sufficiently long time period and is analyzed by appropriate statistical methods.Use of Long Term or Single Event Rainfall DataAs discussed in the Fundamentals section above, long term rainfall data for a watershed or development sitemay be used in certain runoff computations methods. Long term data can be used as input to the rainfallrunoff computations in place of a hypothetical, statistically-based design storm and, in certain instances,may be a more accurate or representative form of this input. In other instances, rainfall records from asignificant historic storm in the watershed may also be used to test or verify a runoff computation or BMPdesign initially based on a hypothetical design storm. While the use of long term or single event rainfall datais not specifically required in the NJDEP Stormwater Management Rules, it is also not prohibited, since suchuses may improve the effectiveness and/or reliability of a runoff computation or BMP design. Analysts anddesigners wishing to use such data should confer with the relevant review agencies prior to such use toensure the suitability and acceptability of both the data and the computation method.New Jersey Stormwater Best Management Practices Manual Chapter 5: Computing Stormwater Runoff Rates and Volumes February 2004 Page 5-10
Figure 5-4: Rainfall Intensity-Duration-Frequency CurvesNote: Adapted from Figure 2.1-2 in the NJDEP Technical Manual for Stream Encroachment Permits.New Jersey Stormwater Best Management Practices Manual Chapter 5: Computing Stormwater Runoff Rates and Volumes February 2004 Page 5-11
Modeling Various Site ConditionsThis section provides guidance for modeling various site conditions within a drainage area or watershed thatmay be encountered in the analysis and/or design of structural and nonstructural BMPs. This guidance isprovided, where applicable, for the NRCS, Rational, and Modified Rational Methods and is intended tofacilitate computation of required runoff volumes, peak rates, and hydrographs. A summary of the guidancefor each computation method is presented at this end of this section in Table 5-2.Pre-Developed Site Land Cover and Hydrologic ConditionAs specified in the NJDEP Stormwater Management Rules, the predeveloped land cover at a developmentsite must be assumed to be woods unless it can be verified that a different land cover has existed for at leastfive years prior to the analysis. Similarly, the predeveloped land cover must be assumed to be in goodhydrologic condition for all land covers.Sites With Pervious and Directly Connected Impervious CoverIt is virtually inevitable that a land development or redevelopment site will have a mixture of pervious anddirectly connected impervious surfaces, particularly under post-development conditions. As defined by theNRCS and others, impervious surfaces are directly connected when runoff from them can flow as shallowconcentrated, channel, or pipe flow directly to the downstream drainage system. While such conditionspose no significant modeling problems for simple, linear methods such as the Rational and ModifiedRational Methods, inaccuracies may occur for small rainfall depths when using more detailed, nonlinearmethods such as the NRCS methodology. Analysis of such conditions using each method is presented here. Rational and Modified Rational Methods: Due to the linear character of the basic RationalEquation, a representative Rational Runoff Coefficient (C) can be computed for the entire site bystandard area weighting techniques. NRCS Methodology: Due to the nonlinear character of the NRCS runoff equation and, primarily,the presence of the initial abstraction term Ia, inaccurate runoff estimates can result when themixture of pervious and directly connected impervious surfaces within a drainage area orwatershed are modeled with a weighted average NRCS Curve Number (CN). As discussed in theNRCS’ TR-55, “the combination of impervious areas with pervious areas can imply a significantinitial loss that may not take place.” This problem will be particularly acute for small rainfalls lessthan an inch or two where the large (but incorrect) initial loss can be 50 percent or more of thetotal rainfall.To avoid these errors, it is recommended that runoff volumes be computed separately from the perviousand directly connected impervious portions of the drainage area and then combined into a weighted averagerunoff volume. This volume averaging technique produces more accurate estimates of total runoff volumethan the standard average Curve Number approach. At a minimum, it should generally be used for allrainfalls less than approximately 4 inches in depth. This would include the 1.25-inch/2-hour stormwaterquality design storm and the 1-year and 2-year 24-hour storms. The technique can also be used for largerrainfall depths at the designer’s discretion.Example 5-2 below further illustrates this problem and the recommended volume averaging solution forthe stormwater quality design storm.New Jersey Stormwater Best Management Practices Manual Chapter 5: Computing Stormwater Runoff Rates and Volumes February 2004 Page 5-12
Example 5-2: Site With Pervious and Directly Connected Impervious CoverRunoff Volume Computation Using NRCS MethodologyDescription: A 3-acre development site is comprised of 1 acre of impervious surface and 2 acres of lawn and woods withan NRCS Curve Number (CN) of 65. The entire impervious surface is directly connected to the site’s drainage system.Compute the site’s total runoff volume for the 1.25-inch stormwater quality design storm using the Weighted Average CNtechnique. Compare the results with the Weighted Average Volume technique.Stormwater Quality Design Storm P 1.25 inchesTotal drainage area 3 acresImpervious area 1 acre (1/3 of total area)Pervious area 2 acres (2/3 of total area)Pervious cover mixture of lawn and woodsImpervious cover asphaltPervious CN 65Impervious CN 98Note: All impervious cover is connected to the drainage systemTotal drainage area 3 acres1 acre directly connectedimpervious coverCN 982 acres pervious coverCN 65Runoff Direction1. Using Weighted Average Curve Number TechniqueWeighted CN (65)(2/3) (98)(1/3) 76Average S 1000 - 10 1000 – 10 3.16 inchesCN76Average initial abstraction Ia 0.2S (0.2)(3.16) 0.63 inches0.8S (0.8)(3.16) 2.53 inchesRunoff volume Q (P - 0.2 S)2 (1.25 - 0.63)2 0.10 inchesP 0.8 S1.25 2.53Runoff volume (0.10 inches/12 inches per foot)(3 acres)(43,560 sf per acre)Total site runoff volume 1089 cubic feetNew Jersey Stormwater Best Management Practices Manual Chapter 5: Computing Stormwater Runoff Rates and Volumes February 2004 Page 5-13
2. Using Weighted Average Volume TechniqueImpervious AreaImpervious area S 1000 - 10 1000 – 10 0.20 inchesCN98Impervious area initial abstraction 0.2S (0.2)(0.20) 0.04 inches0.8S (0.8)(0.20) 0.16 inchesImpervious area runoff volume Q (P - 0.2 S)2 (1.25 - 0.04)2 1.04 inchesP 0.8 S1.25 0.16Runoff volume (1.04 inches/12 inches per foot)(1 acre)(43,560 sf per acre)Impervious area runoff volume 3775 cubic feetPervious AreaPervious area S 1000 - 10 1000 – 10 5.38 inchesCN65Pervious area initial abstraction 0.2S (0.2)(5.38) 1.08 inches0.8S (0.8)(5.38) 4.30 inchesPervious area runoff volume Q (P - 0.2 S)2 (1.25 – 1.08)2 0.005 inchesP 0.8 S1.25 4.30Runoff volume (0.005 inches/12 inches per foot)(2 acres)(43,560 sf per acre)Pervious area runoff volume 36 cubic feetTotal site runoff volume 3775 36 3811 cubic feet(
Method), which are generally limited to drainage areas less than 20 acres. A general description of each method is provided below. NRCS Methodology The USDA Natural Resources Conservation Service (NRCS) methodology is perhaps the most widely used method for computing stormwater runoff rates, volumes, and hydrographs. It uses a hypothetical design