Transcription
Pathways to SuccessTenth Year ReportPaul R. Fowler, Ph.D.Director of Developmental ebruary 16, 20151
Pathways to Success Tenth Year ReportExecutive SummaryThe 2013 – 2014 academic year marked the tenth year of the Pathways to Success Program at LSUEunice. This report presents much of the statistical information gathered to date as well as details ofmany different aspects of the program. Much of the data gathered follows the National Center forDevelopmental Education’s (NCDE) criteria for program evaluation (see Table 1).1. In all, 3,616 students have been admitted to the program. Black (non-Hispanic) accounted for 54% ofthe students with 70% being female (see Table 2). The average age was 28 and an average of 54%to 60% attended full-time (see Table 3 and Table 4).2. Approximately 93.5% of the students complete the semester (see Table 5 and Table 6).3. The percentage of students with a grade of C or better was analyzed in several ways:a. For fall, the percentage of students successfully completing all of their courses is up from34% in fall 2004 to 49% in fall 2013. The percentage of students receiving a D, F, or W in atleast one course is down from 53% in fall 2004 to 12% in fall 2013. The percentage ofstudents receiving failing grades in every course increased from 14% to 20% (see Table 12).Similar results are noted for spring (see Table 13).b. For fall 2003, 55% of the students were in good standing compared to 80% in fall 2013.Students placed on probation went from 39% to 8% over the same time period. The medianGPA also increased from 1.429 to 2.333 (see Table 14). Table 15 details the data for spring.4. Goal One: Developmental Education Course Completion: All program objectives were analyzed bydirect (student learning outcomes) and indirect means (success rates). Success using NCDEstandards increased from the following from AY 2003-2004 to AY 2013-2014 (see Table 16):a. Objective 1-1: ENGL 0001 from 65% to 90%; national average 73%; met.b. Objective 1-2: MATH 0001 from 54% to 74%; national average 68%; met.c. Objective 1-3: MATH 0002 from 49% to 67%; national average 68%; not met.d. Objective 1-4: UNIV 1005 from 22% to 89%; national average 76%; met.e. Objective 1-5: UNIV 0008 from 67% to 85%; national average 76%; met.f. Raw success rates for each course are presented in Table 17.g. Differences in percentages between Table 16 and Table 17 indicate a large percentage ofstudents withdraw or failed due to the attendance policy.5. Goal Two: Developmental Education to General Education Course Success (NCDE) (see Table 19).a. Objective 2-1: ENGL 0001 to ENGL 1001 88%, n 2,279, national average 64%; met.b. Objective 2-2: MATH 0002 to general education mathematics 78%, n 840; nationalaverage 58%; met.c. Objective 2-3: UNIV 0008 to social science 70%; n 976, national average 69%. Thisobjective 71%; n 1,205; if UNIV 0008 test out students are included (see Table 22). Met.d. Far more students complete the writing component than reading or mathematics.6. Goal Three: Program Completion and Persistencea. Objective 3-1: Completion rate 31%, national average 30%-40% (see Table 23), met.b. Objective 3-2: Fall to spring retention 80%, ten year average 75%, met.c. Objective 3-3: Fall to fall retention 50%, ten year average 42%, met.7. Graduation rate 5%, n 162 (see Table 26), average to graduation 3.92 years (see Table 27),with a mean GPA 2.80. Most awarded degree was general studies, then Nursing (see Table 28).8. Student satisfaction (either agree or strongly agree) with statements 81%, n 447 (see Table 29).9. Most students (49%) withdraw from individual courses for academic reasons (see Table 31).10. First semester students with children or who are working can be more successful if they are not fulltime. GPA’s of first semester students increased 15% in one year when students were encouraged toschedule their classes around their personal life (see Table 32).11. 5% to 6% of the Pathways students are Pell Runners and enroll to collect a check (see Figure 1 toFigure 3).Data indicates that the Pathways to Success program does assist students in the completion of theirdevelopmental education coursework. Budget reductions are hampering efforts to assist more students;however, program staff will continue to do the best they can with the resources available.2
Pathways to Success Tenth Year ReportIntroductionAccording to ACT (2012), 83% of the 2012 students ACT-tested in Louisiana requiredsome form of developmental education coursework as they entered college. The samereport notes that 29% of the Louisiana students are seriously deficient meaning thatstudents need developmental coursework in every subject. The only option for most of thesestudents is to enroll in a community college or technical school given that Louisiana’s four-yearinstitutions of higher education are “no longer” permitted to offer developmental educationcourses.1 As a result, Louisiana State University Eunice (LSU Eunice) serves the needs ofdevelopmental students in the Acadiana Region. The Pathways to Success Program fills a vitalfunction for the students at LSU Eunice needing developmental education coursework in allsubject areas. This report summarizes the results achieved by LSU Eunice’s Pathways toSuccess Program over the past ten years.The Pathways to Success program received the John Champaign Memorial Award forOutstanding Developmental Education Program honored by the National Association ofDevelopmental Education in March 2010. The program was also named an OutstandingInstitutional Advising Program by the National Academic Advising Association in 2008 – one ofthree in the nation. In addition, Dr. Hunter Boylan, the Director of the National Center ofDevelopmental Education, named Pathways as one of the best developmental educationprograms in the state of Louisiana in spring 2006. The program director was named as theoutstanding developmental education administrator in the State of Louisiana in 2009 and theprogram was named an exemplary advising program for underprepared students in 2007.Pathways to Success was named an OutstandingInstitutional Advising Program in 2008.Pathways to Success was honored with the JohnChampaign Memorial Award for OutstandingDevelopmental Education in 2010.LSU Eunice’s Pathways to SuccessIn fall 2004, LSU Eunice decided to face the developmental education issue and itschallenges head on. Specifically, Pathways to Success was implemented targeting enteringstudents who have no ACT scores and those who have an ACT composite of 15 or below.Students with an ACT composite of 15 or below usually require developmental coursework inThe words “no longer” are in quotes because the four-year institutions are permitted to offer co-requisitedevelopmental courses where the developmental and general education courses are offered at the sametime.13
every subject.2 Unique to LSU Eunice, the program addresses whole student development byaddressing the academic factors (coursework and tutoring), nonacademic factors (socializationand transition to higher education), and personal factors (life’s issues in general) related tostudent success.3 Several different theoretical constructs including, but not limited to using clearstudent guidelines,4 first year experience and mandatory orientation,5 intrusive academicadvising,6 structured and rigorous developmental education coursework,7 all play a part inaddressing the trio of student success factors.At LSU Eunice, placement in the program has been mandatory for ten years. All studentsenrolled in the Pathways to Success program attend an orientation introducing them to theprogram and LSU Eunice in general. At orientation, students sign a contract acknowledging therole of institutional policy and their own responsibilities for success.8 Students are also expectedto attend 90% of their classes or risk being failed due to absences. Very simply, LSU Euniceofficials believe that developmental education students need to attend class if they are to learnthe course material and successfully complete the course.In addition, students must also see their academic advisor at least three times during thesemester.9 The advising visits in the university studies courses play an integral role inaddressing the nonacademic and personal factors related to success. The first universitystudies course introduces students to the university, time management, critical thinking, goalsetting, and appropriate socialization skills necessary to be successful in a college setting. Italso uses various psychometric tests that help the students identify learning styles,temperament, and appropriate choice of major. Academic advising may become “intrusive” forsome students as the director and advisors often “get out of their offices” during the earlywarning period and engage students by visiting them in class, calling them at home, callingthem on their cell phones, or visiting them in the college’s residence hall. During this time,students are identified by faculty for not doing homework, not showing up for class, not showingup for class on time, answering cell phones in class, or causing any kind of disruption.Lastly, students must attend tutoring in math and English if their grade falls below 70% on amajor assessment. Tutoring services are offered as institutional funds permit and students havetheir option of seeking tutoring face to face with a faculty member using a “drop in” method thatrequires no appointment or seeking help from the student success center on campus that2LSU Eunice has developmental English composition and developmental mathematics. The institutiondoes not have a developmental science course. The State of Louisiana has no college level standards forreading. LSU Eunice does, however, have a college reading course. ACT guidelines for reading arefollowed for Pathways students.3 For a complete discussion of the academic and nonacademic factors see: Lotkowski, Robbins, andNoeth (2004). For a complete discussion of cognitive (academic) factors, affective (noncognitive) factors,and personal factors and how each relates to developmental education see Boylan (2009) or Fowler andBoylan (2010).4 (Fowler, 2007; Miller & Murray; 2005; Stewart, Brewer, & Brown-Wright, 2007; Tinto, 2004)5 (Escobedo, 2007; Fowler & Dronet, 2007; Grubb, 2013; Kuh, 2007; Lotkowski, Robbins, & Noeth, 2004;Varney, 2007)6 (Earl, 1988; Ender & Wilkie, 2000; Escobedo, 2007; Fowler & Dronet, 2007; Glennen & Baxley, 1985;Kuh, 2007; Rutschow & Schneider, 2011; Vander Schee, 2007)7 (Boylan, 2002; McCabe, 2000)8 See pdf for the contract.9 See pdf for a complete list of academic advisingefforts.4
requires appointments and uses more of a supplemental instructional approach. Students in theprogram may also seek help through electronic tutoring; however, most students use the face toface method due to limited experience with technology.Unique to LSU Eunice, the Pathways to Success programaddresses whole student development by addressing theacademic factors, nonacademic factors, and personalfactors related to student success.Mission and GoalsApproved by the Developmental Studies Advisory Committee in spring 2011, the missionof the Pathways to Success program is:Using the best practices in the field as defined by the National Center for DevelopmentalEducation (NCDE), the Pathways to Success program exists to provide a holistic approach todevelopmental education so that LSU Eunice may better assist underprepared students in theachievement of their educational and personal goals.Goals one and two are:In working to maintain an effective developmental education program, Pathways to Success willprovide students the necessary support for the successful completion of:1. their developmental education coursework. (linked to institutional goals 4, 5, 7, 8);2. their first general education course in English, mathematics, and social science. (linked toinstitutional goals 3, 5, 7, 8).Goal three is:In an effort to further examine program effectiveness, Pathways to Success program staff willexamine the program completion and retention data (linked to institutional goals 3, 5, 7, 8).Program assessment in terms of methodology and benchmarks is guided by the NCDE (Boylanand Bonham, 2011; Gerlaugh, Thompson, Boylan, & Davis, 2007), the Lumina Foundation(Bailey, Jeong, & Cho, 2008), and literature in the field of developmental education (Attewell,Lavin, & Levey, 2006). Table 1 details each of the specific metrics based on information fromthe NCDE. Those identified with an “X” reflect data collected on a routine basis.The Pathways to Success program exists to provide aholistic approach to developmental education.5
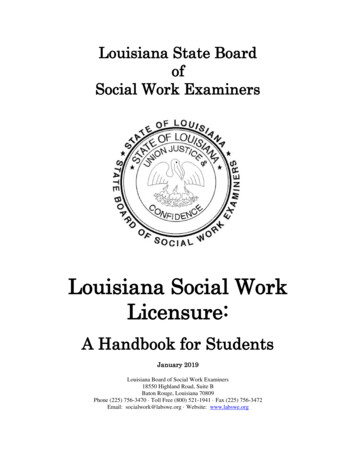
Table 1NCDE Criteria for Program Evaluation.10ReferenceTable 5Table 6Table 7Table 8Table 9Table 5Table 6Table 12 Table 17Table 24Table 18Table 19Table 20Table 21Table 25Table 27ReferenceTable 29QuantitativeCriteriaMonitoredHow many students participated in the program/courses?XHow many hours of tutoring were offered?XHow many sections of developmental courses were offered?XWhat % of the students who entered the course stayed for the entire term?XWhat % of those who stayed the entire term earned a C or better?XWhat were the g-scores for those taking the course or receiving tutoring?How many of those who participated in the course/program remained for onesemester?What % of those who passed the lowest level developmental course took andpassed the next level developmental course?XXWhat % of those who passed the highest level developmental course tookand passed the next level curriculum course in that subject?What % of those who took one or more developmental courses were retainedfrom fall to fall?What % of those who took one or more developmental courses graduatedwithin 2, 3, 4, 5, and 6 years?QualitativeCriteriaTo what extent are student users satisfied with the program?What are faculty/staff perceptions of the program?What are faculty/staff perceptions of the program's students?What is the impact of program on the campus as a whole?XXXMonitoredXXXXNational Center for Developmental Education Criteria forProgram Evaluation is used to assess the Pathways toSuccess Program.It is important to note that the benchmarks established through the NCDE reflect alldevelopmental students, not just those that need developmental education courses in allsubjects (Gerlaugh et al., 2007). The director and the advisory committee feel that thebenchmarks should be adopted for three reasons. First, the NCDE and the Lumina foundationprovide some of the most systematic and reliable data on developmental students across thecountry. Second, any other benchmark is arbitrary and difficult to defend. As a result, anSee NCDE’s website at iles/evaluation.pdf for theprogram evaluation.106
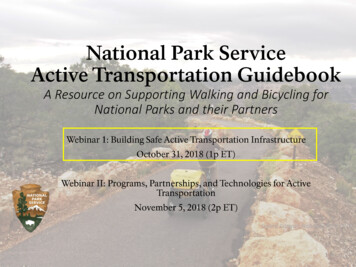
objective or outcome may use the word “approximate” instead of the word “will” meet certainbenchmarks. Lastly, it was felt that the benchmarks demand academic excellence from thefaculty, students, and the institution as a whole. In other words, setting high expectations wouldresult in greater student learning.Data CollectionMuch of the raw data is broken out in six data sets (three for fall and three for spring), onefor all campus sites and then one for LSU Eunice and one for LSU Alexandria.11 Thedata set itself is labeled by campus and is collected each semester. In some cases,data for the semester prior to the implementation of Pathways to Success program is alsoincluded. Data related questions may be addressed to the author of this report: Dr. Paul Fowler,Director of Developmental Education at pfowler@lsue.edu.93% to 94% of the students enrolling in the Pathways toSuccess Program stayed for the entire term.Demographic InformationIn all, 3,616 students have entered the Pathways to Success program since itsimplementation in summer 2004.12 Student demographics since 2004 are contained in Table2. The majority (54%) of the students being served are Black (non-Hispanic) with nearlythree-fourths (70%) being female. The average age for all Pathways students is 28 and anaverage of 54% to 60% attended full-time in any given semester over the ten years (see Table 3and Table 4). Table 5 and Table 6 also detail the number of new and continuing students, alongwith those who completed the semester since the program was implemented. Between 93%and 94% of the students stay for the entire term in any given fall or spring (see Table 5 andTable 6).11The complete data set is available ysyeartoyearcomparisons.pdf.12 Statistic provided through spring 2014.7
Table 2Fall 2013 student demographics.EthnicityBlack/African AmericanWhiteHispanic of any RaceTwo or More RacesRace/Ethnicity UnknownAm Indian or AlaskanNot ReportedNonresident AlienAsianHispanicAsian or Pacific IslandForeignHawaiian/Pacific IslandGrand 1010342210107919381468453734302711886223616Table 3Class load for fall semesters.Class LoadPercent part timePercent full time2004 2005 2006 2007 2008 20091486208034664060376339612010 2011 20124654594165352013Median72284061Table 4Class load for spring semesters.Class LoadPercent part timePercent full time2005 2006 2007 2008 2009 2010 2011 2012 2013 465454% of the students enrolling in the Pathways to SuccessProgram were black (Non – Hispanic).The average age was 28 and 54% to 61% attended full-time.8
Table 5Pathways to Success enrollment and semester completion for fall.13Fall Enrollmentnewcontinuing/transfertotalPercent retention from fall (new FF)Resignation InformationCompleted 692%43595%37592%93%Table 6Pathways to Success enrollment and semester completion for spring.Spring 0%5533639172%6029435480%8332538677%Resignation %266%Completed rcent retention from fall (new FF)13Resignation means that the student withdrew from all courses for the semester. For Fall 2013, 264 (65%) of the Pathways students received aPell Grant. In addition, 313 (77%) were first generation college students.9
TutoringPathways students have a mandatory tutoring requirement if they score below a C on amajor assessment in developmental mathematics or English composition. Severaltutoring methods are available including face-to-face with a faculty member in thePathways tutoring lab or face-to-face in the Student Support Services lab with a peer. Studentsmay also use Smarthinking for both subjects and many faculty members recommend the use ofMyMathLab through the text book publisher for the developmental mathematics courses. Infollowing best practices and the NCDE (Boylan, 2002), LSU Eunice recommends that Pathwaysstudents use an appropriate method for them. This is usually the face-to-face method whenpossible as many of them either do not have high speed internet connections at home or are notfamiliar with the computing requirements for online tutoring.An average of 24 hours for tutoring for mathematics and 7.5 hours for English composition perweek per academic year has been offered by the Pathways to Success (see Table 7).Generally, math tutoring is offered from 9 am to 1 pm Monday through Friday while specifichours for tutoring for English (up to five per week) vary each semester. During the AY 20132014, Pathways to Success students generally had a 43% compliance rate with the tutoringrequirement generating an average of 317 tutoring visits every semester. This is down from50% just a few years ago, however, the tutoring requirement in modular mathematics does notexist for the most part since tutoring is built into the course sequencing.14 Very few, if any, if anyPathways students enrolled in the modular mathematics sections require face-to-face tutoring inthe lab.Table 7Tutoring hours for the Pathways to Success tutoring lab per academic sh2510101013555557.5Number of Developmental Sections OfferedThe number of sections offered to Pathways to Success students each fall and spring areshown in Table 8 and Table 9. Generally speaking, there has been a slight decrease inthe number of sections offered for ENGL 0001 and MATH 0002. The decreases in ENGL0001 and MATH 0002 reflect overall enrollment decreases during the past ten years. Theincrease in sections for MATH 0001 reflect an attempt to have smaller class sizes to increasesuccess. The increase in offerings for both UNIV 1005 and UNIV 0008 emphasize the fact thatthe two courses became mandatory in fall 2004 for all students enrolled in the Pathwaysprogram. In an attempt to have students finish the Pathways to Success program sooner,students are given an attempt to test out of UNIV 0008 while they take UNIV 1005 (Grubb,2013).14The modular mathematics program will be discussed in detail later in this paper.10
Table 8Number of fall sections offered to Pathways to Success students.15CourseENGL 0001MATH 0001MATH 0002UNIV 1005UNIV 352221.513135Table 9Number of spring sections offered to Pathways to Success students.CourseENGL 0001MATH 0001MATH 0002UNIV 1005UNIV .5915ENGL 0001 is developmental composition, MATH 0001 is pre-algebra, MATH 0002 is introduction to algebra, UNIV 1005 is orientation touniversity studies, and UNIV 0008 is college reading.11
Developmental Class SizeClass sizes, especially in mathematics, declined when the program was implemented in fall2004 (see Table 10 and Table 11) in order to meet typical NCDE standards which is generallyaccepted to be around 20 students per class (Gerlaugh et al., 2007). However, while sanctionedby the NCDE, the very nature of the calculation is itself, to some degree, misleading since themedian is taken on the fourteenth class day and then again on the last day of classes. Largeclass sections on the 14th day generally lead to additional students withdrawing allowing forsmaller classes on the last day. Of course, this practice does nothing for course success rates.By the second and third year of the program, the director was able to convince administration toadd additional sections resulting in lower class sizes in developmental mathematics.Percentage Earning the Grade of C or BetterThe percentage of students earning a grade of C or better is addressed in Table 12through Table 15. First, Table 12 details the percentage of students earning a grade of Cor better in all courses, success in all but one course, and failing all courses. The datasuggests that increased success has been demonstrated since only 34% percentsuccessfully completed all courses in 2004 while nearly half (49%) successfully completed themin fall 2013 (see Table 12). Spring semester has much the same results increasing from 39%success in spring 2005 to 50% in spring 2014 (see Table 13).Decreases from 53% to 12% for fall and 43% to 30% for spring are also noted in studentsreceiving a D, F, or W in at least one course in spring. The problem area seems to be 20% ofthe students consistently failing their courses every semester. A possible explanation for thiswill be discussed later.Next, Table 14 details the fall academic standing and GPA while Table 15 details the springacademic standing and GPA. For fall, the percentage of students in good standing (a GPA 2.0) increased from 55% to 80% - being consistently above 80% since fall 2010 (see Table 14).In addition, students placed on probation decreased from 39% to 8% and students droppedincreased slightly from 2% to 4%. The median GPA also increased from 1.429 in fall 200316 to2.333 in fall 2013 – a 63% increase in ten years.For spring, the students in good standing increased from 52% to 72% while those on probationdecreased from 40% to 12% (see Table 15). The percentage of students dropped in the springmirrored the fall. Lastly, the median GPA increased from 1.349 in spring 200417 to 2.500 inspring 2014 – a 35% increase in ten years. In both cases, the standard deviations of the gradepoint averages have decreased indicating a narrowing of the data.16Pathways to Success was implemented in fall 2004. Fall 2003 data was taken from records of studentswho would have been placed into the program if it had existed.17 Pathways to Success was implemented in fall 2004. Spring 2004 is the semester prior to the programbeing implemented. The data was taken from records of students who would have been placed into theprogram if it had existed.12
Table 10Median fall developmental class size.CourseENGL 0001MATH 0001MATH 0002UNIV 1005UNIV 9222123192220232118202121181820.52221.52119.5Table 11Median spring developmental class size.CourseENGL 0001MATH 0001MATH 0002UNIV 1005UNIV 6182416201421261615202121181819.521232020.513
Table 12Fall success statistics.Grades:A, B, C, P in every classD, F, NC, or W in at least one classF in every 16%16450%9930%6720%Median38%52%13%Table 13Spring success statisticsGrades:A, B, C, P in every classD, F, NC, or W in at least one classF in every classMedian39%46%17%14
Table 14Fall academic standing and GPA statistics.18Academic 13MedianGood standingPlaced on probationDroppedContinued on probationRemoved from e Point 13Averagesmeanmedianstandard .5001.0132.3122.3330.9462.0782.1210.925Table 15Spring academic standing and GPA statistics.19Academic 14MedianGood standingPlaced on probationDroppedContinued on probationRemoved from %4%2%Grade Point 14Averagesmeanmedianstandard .3880.8662.3442.5000.8842.1482.1810.98118Fall 2003 is the fall semester prior to the program being implemented for comparison. For Fall 2013, the GPA data is slightly skewed to the leftwith skewness -0.464. The data is also slightly leptokurtic with kurtosis 0.059. Both are 0 for normal distributions.19 Spring 2004 is the spring semester prior to the program being implemented for comparison. For Spring 2014, the GPA data is slightly skewed tothe left with skewness -0.467. The data is slightly leptokurtic with kurtosis 0.168. Both are 0 for normal distributions.15
Goal One – Developmental Education Course PerformanceNext, Table 16 details the developmental course success rates using NCDE methodologywhile Table 17 details the raw success rates for the same courses. Using themethodology of Gerlaugh et al. (2007) in Table 16, the percent success is defined bytaking the number of students earning a grade of A, B, or C in the course divided by thoseenrolled on the 14th day minus students who withdrew or were given a failing grade for violatingthe Pathways to Success attendance policy. Students earning a D or F are defined asunsuccessful. The 2003-2004 academic year (AY), the year prior to the program beingimplemented, is also shown for comparison.For each of the five courses taken by Pathways to Success students, success increaseddramatically, especially UNIV 1005, increasing from 22% the year prior to the program beingimplemented to 89% in AY 2013-2014. Also, in every case except one, the recent results meetor exceed the NCDE standards. The exception is MATH 0002 being one point less than theNCDE standard in AY 2013-2014. Both developmental math course results have fluctuated overthe ten years with MATH 0002 never meeting the standard in the ten years the program hasexisted.Pathways student success increased dramatically, especiallyUNIV 1005, increasing from 22% the year prior to the pro
The 2013 - 2014 academic year marked the tenth year of the Pathways to Success Program at LSU Eunice. This report presents much of the statistical information gathered to date as well as details of . Most awarded degree was general studies, then Nursing (see Table 28). 8. Student satisfaction (either agree or strongly agree) with statements .