Transcription
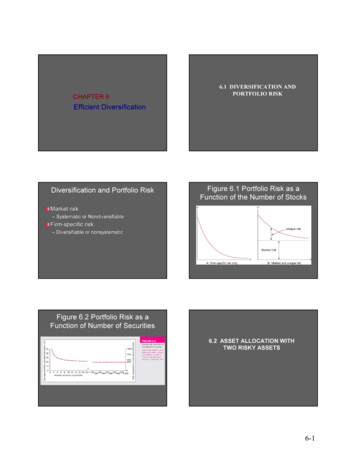
CHAPTER 66.1 DIVERSIFICATION ANDPORTFOLIO RISKEfficient DiversificationDiversification and Portfolio RiskMarket riskFigure 6.1 Portfolio Risk as aFunction of the Number of Stocks– Systematic or NondiversifiableFirmFirm-specific risk– Diversifiable or nonsystematicFigure 6.2 Portfolio Risk as aFunction of Number of Securities6.2 ASSET ALLOCATION WITHTWO RISKY ASSETS6-1
Covariance and CorrelationPortfolio risk depends on the correlationbetween the returns of the assets in theportfolioCovariance and the correlation coefficientprovide a measure of the returns on twoassets to varyTwo Asset PortfolioReturn – Stock and Bondrp w r w rBBSSrP Portfolio ReturnwB Bond WeightrB Bond ReturnwS Stock WeightrS Stock ReturnCovariance and Correlation CoefficientCovariance:Range of values for ρ 1,2Cov(rS , rB ) p(i) rS (i ) rS rB (i ) rB S-1.0 ρ 1.0i 1CorrelationCoefficient:ρ SB If ρ 1.0, the securities would beperfectly positively correlatedCov( rS , rB )σ Sσ BIf ρ - 1.0, the securities would beperfectly negatively correlatedTwo Asset Portfolio St Dev –Stock and Bondσσ2p2pσ w B σ B wS σ S 2 w B wS σ S σ B ρ2222pIn General, For an n-Security Portfolio:2 Portfolio Variance Portfolio Standard DeviationCorrelation Coefficients:Possible ValuesB ,Srp Weighted average of then securitiesσp2 (Consider all pair-wisecovariance measures)6-2
Three Rules of Two-Risky-Asset PortfoliosRate of return on the portfolio:rP wB rB wS rSExpected rate of return on the portfolio:Three Rules of Two-Risky-Asset PortfoliosVariance of the rate of return on the portfolio:σ P2 ( wBσ B )2 ( wSσ S ) 2 2( wBσ B )( wSσ S ) ρ BSE (rP ) wB E (rB ) wS E (rS )Numerical Text Example: Bond and StockReturns (Page 169)ReturnsBond 6% Stock 10%Standard DeviationBond 12% Stock 25%WeightsBond .5Stock .5Correlation Coefficient(Bonds and Stock) 0Figure 6.3 Investment OpportunitySet for Stocks and BondsNumerical Text Example: Bond and StockReturns (Page 169)Return 8%.5(6) .5 (10)Standard Deviation 13.87%[(.5)2 (12)2 (.5)2 (25)2 2 (.5) (.5) (12) (25) (0)] ½[192.25] ½ 13.87Figure 6.4 Investment Opportunity Set forStocks and Bonds with Various Correlations6-3
Extending to Include Riskless Asset6.3 THE OPTIMAL RISKY PORTFOLIOWITH A RISK-FREE ASSETFigure 6.5 Opportunity Set Using Stocksand Bonds and Two Capital Allocation LinesThe optimal combination becomes linearA single combination of risky and risklessassets will dominateDominant CAL with a Risk-FreeInvestment (F)CAL(O) dominates other lines -- it has the bestrisk/return or the largest slopeSlope Dominant CAL with a Risk-FreeInvestment (F)E ( rP ) rfσP E (rA ) rfσAFigure 6.6 Optimal Capital Allocation Linefor Bonds, Stocks and T-BillsE (rA ) rfσARegardless of risk preferences, combinations ofO & F dominate6-4
Figure 6.7 The Complete PortfolioFigure 6.8 The Complete Portfolio –Solution to the Asset Allocation ProblemExtending Concepts to All Securities6.4 EFFICIENT DIVERSIFICATION WITHMANY RISKY ASSETSFigure 6.9 Portfolios Constructed fromThree Stocks A, B and CThe optimal combinations result in lowestlevel of risk for a given returnThe optimal tradetrade-off is described as theefficient frontierThese portfolios are dominantFigure 6.10 The Efficient Frontier of RiskyAssets and Individual Assets6-5
Single Factor Model6.5 A SINGLE-FACTOR ASSET MARKETSpecification of a Single-Index Model ofSecurity ReturnsRi E ( Ri ) βi M eiβi index of a securities’securities’ particular return to thefactorM unanticipated movement commonly related tosecurity returnsEi unexpected event relevant only to thissecurityAssumption: a broad market index like theS&P500 is the common factorFigure 6.11 Scatter Diagram for DellUse the S&P 500 as a market proxyExcess return can now be stated as:Ri α βi RM e– This specifies the both market and firm riskFigure 6.12 Various Scatter DiagramsComponents of RiskMarket or systematic risk: risk related to themacro economic factor or market indexUnsystematic or firm specific risk: risk notrelated to the macro factor or market indexTotal risk Systematic Unsystematic6-6
Measuring Components of Riskσi2 βi2 σm2 σ2(ei)where;σi2 total varianceβi2 σm2 systematic varianceσ2(ei) unsystematic varianceExamining Percentage of VarianceTotal Risk Systematic Risk Unsystematic RiskSystematic Risk/Total Risk ρ2ßi2 σ m2 / σ2 ρ2βi2 σm2 / βi2 σm2 σ2(ei) ρ2Advantages of the Single Index ModelReduces the number of inputs fordiversificationEasier for security analysts to specialize6.6 RISK OF LONG-TERM INVESTMENTSAre Stock Returns Less Risky in the LongRun?Are Stock Returns Less Risky in the LongRun?Consider a 22-year investmentVar (2-year total return) Var (r1 r2 Var (r1 ) Var ( r2 ) 2Cov (r1 , r2 ) σ 2 σ 2 0 2σ 2 and standard deviation of the return is σ 2Variance of the 22-year return is double of that of theoneone-year return and σ is higher by a multiple of thesquare root of 2Generalizing to an investment horizon of nyears and then annualizing:Var(n-year total return) nσ 2Standard deviation (n-year total return) σ nσ (annualized for an n - year investment) 1σσ n nn6-7
The Fly in the ‘Time Diversification’OintmentAnnualized standard deviation is only appropriatefor shortshort-term portfoliosVariance grows linearly with the number of yearsStandard deviation grows in proportion to nThe Fly in the ‘Time Diversification’OintmentTo compare investments in two differenttime periods:– Risk of the total (end of horizon) rate of return– Accounts for magnitudes and probabilities6-8
Figure 6.7 The Complete Portfolio Figure 6.8 The Complete Portfolio - Solution to the Asset Allocation Problem 6.4 EFFICIENT DIVERSIFICATION WITH MANY RISKY ASSETS Extending Concepts to All Securities The optimal combinations result in lowest level of risk for a given return The optimal trade -off is described as the efficient frontier