Transcription
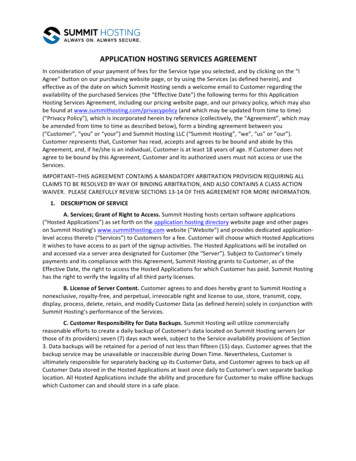
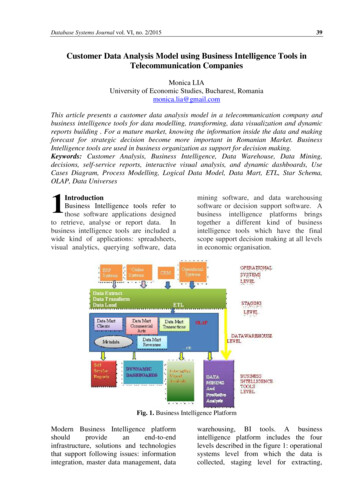
Database Systems Journal vol. VI, no. 2/201539Customer Data Analysis Model using Business Intelligence Tools inTelecommunication CompaniesMonica LIAUniversity of Economic Studies, Bucharest, Romaniamonica.lia@gmail.comThis article presents a customer data analysis model in a telecommunication company andbusiness intelligence tools for data modelling, transforming, data visualization and dynamicreports building . For a mature market, knowing the information inside the data and makingforecast for strategic decision become more important in Romanian Market. BusinessIntelligence tools are used in business organization as support for decision making.Keywords: Customer Analysis, Business Intelligence, Data Warehouse, Data Mining,decisions, self-service reports, interactive visual analysis, and dynamic dashboards, UseCases Diagram, Process Modelling, Logical Data Model, Data Mart, ETL, Star Schema,OLAP, Data Universes1IntroductionBusiness Intelligence tools refer tothose software applications designedto retrieve, analyse or report data. Inbusiness intelligence tools are included awide kind of applications: spreadsheets,visual analytics, querying software, datamining software, and data warehousingsoftware or decision support software. Abusiness intelligence platforms bringstogether a different kind of businessintelligence tools which have the finalscope support decision making at all levelsin economic organisation.Fig. 1. Business Intelligence PlatformModern Business Intelligence platformshouldprovideanend-to-endinfrastructure, solutions and technologiesthat support following issues: informationintegration, master data management, datawarehousing, BI tools. A businessintelligence platform includes the fourlevels described in the figure 1: operationalsystems level from which the data iscollected, staging level for extracting,
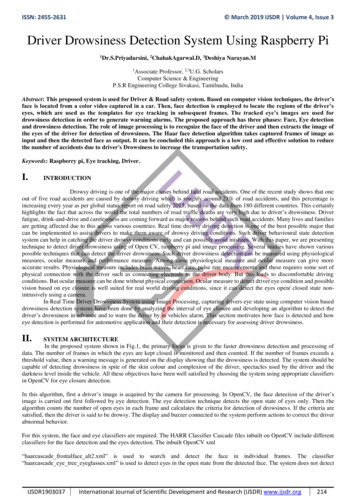
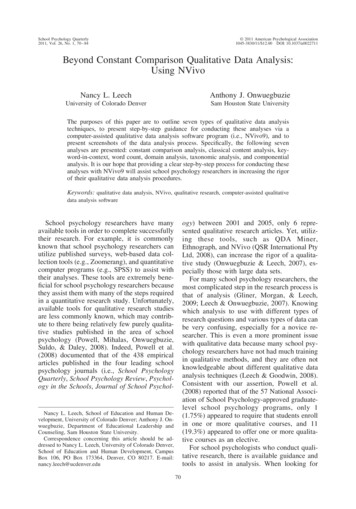
40Customer Data Analysis Model using Business Intelligence Tools in Telecommunication Companiesloading and transformation of data formodelling in data warehouse. The last levelis represented by business intelligencetools used for decision making.Data Mining means predicting the futurebased on analysing information from theown systems.Data Mining is made on large sets of datafrom different data sources and includefour stages Exploration, Model buildingand validation; Deployment, Reportspreparation.Fig. 2. Data Mining Stages. Source http://www.statsoft.com/Data Mining could be made using datafrom staging level or from the datawarehouse directly. Examples for DataMining Business Intelligence tools are SASEnterprise Miner, IBM SPSS, and BusinessAnalytics for Information Builders. DataMining could be made also without thesetools. Looking for what is inside the data is abeautiful and difficult job.Self Service ReportsSelf-service business intelligence meansthat business users can create their ownreports without IT department help.Usually this is possible it after the staginglevel. The data is organized using OLAPtechnology, on Data warehouse level. Forexample the Business Objects universes isa business representation of organization'sdata that helps end users access dataautonomously using common businessterms and it isolates business users fromthe technical details of the databases wheresource data is stored.Fig. 3. Example of Self Service Report. Source http://datawarehouse4u.info/
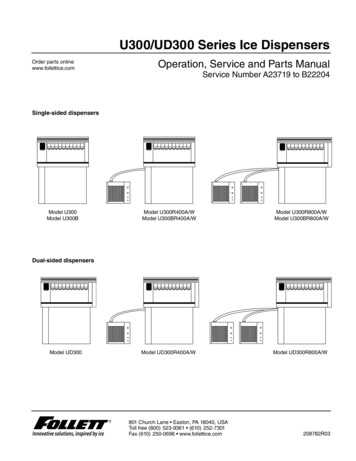
Database Systems Journal vol. VI, no. 2/2015Dynamic DashboardsA way to organize together and managemultiple charts regarding on the samesubject of interests is on dashboards. If theinformation in dashboards is not static andcan be changed based on parameters valuesselections, those dashboards are called41dynamic. In business is very often usedbecause the information came fromdifferent sources and the volume of data ishuge. Dynamic Dashboards are preferredby intermediate level of managers forgiving a quick image by their businesssegment.Fig. 4. Example of Dynamic Dashboard, Source, ctive Visual AnalysisInteractive Visual Analysis (IVA) is newpart of business intelligence tool. Theinteractive visual analysis appears as aneed for analysing high-dimensional datathat has a large number of data points.Simplegraphingreportswithoutinteractive techniques give an insufficientunderstanding of what is inside the data.complex datasets.Using interactive visual analysis the usercorrelated views and iteratively select andexamining features. The objective ofanalysis is to obtain knowledge which isnot apparent from ordinary report. ForInteractive Visual Analysis is important theperceptive and cognitive capabilities ofhumans who use it. This is necessary inorder to extract knowledge from large andFig. 5. Example of Interactive Visual Analysis, Source, nt-software-blog/
42Customer Data Analysis Model using Business Intelligence Tools in Telecommunication CompaniesBusiness intelligence tools are very usefulfor large companies. As example, theTelecom Market is very dynamic.Companies are looking for solutions fortakeadvantageinthisdifficultcompetition. The analysis of what is insidethe data from systems like traffic, sales,online,accountingbecomemoreimportant. The data from operationalsystems contains information about theclient and how to keep this client, how tooffer solutions for giving a better price or abetter service. Also, gives ideas to decisionmakers on how to improve communicationto client, how to improve network qualitiesand so one. In this paper the authorpresents a model of data analysis of atelecommunication customer.with analysis of which elements impactscustomers’ behavior. First, is clearunderstood that to become a company’sclient, the actor has to sign a contract. Thecontract is a result of an offer made by acompany. To support the offers companyhas her own costs and stocks of products.The company gives to the client, on theoffer base, services and/or products. Usingcompany’s services the client make voicecalls, traffic on internet, content usage,transactions. All this traffic is made usingthe company’s network. If the client needsassistance from the company has tointeract using Interactions services (likeIVR, Customer Care calls) or using CareServices for problems with devices. Allthis elements are presented using use casediagram in the figure 7.2. Data Analysis ModelThe customer data analysis model startsFig.7. USE CASES DIAGRAM for Customer AnalysisThe use cases diagram helps theunderstanding of what are the elementswhich determine customer’s behaviour.This is important for understanding whichdata needs to be modelled in order todeveloped dynamic reports necessary forcustomer analysis. In a telecom company,information from customers comes fromdifferent data sources as: operationalsystems for customer’s traffic, operationalsystems for contracts, invoices, and onlinesystems. The data from operationalsystems are load in Data Warehouses. Anexample is presented in the Figure 8.
Database Systems Journal vol. VI, no. 2/201543understanding how data will be modelled.For customer analysis the logical model isdiscuss with business owner and thesponsors of customer analysis project. Theanalysis is made by business analyst. Forcustomer analysis the logical model ispresented in the figure 9.Based on logical Model is obvious now thelarge kind of analysis which can be madeon customer. In the Table are someexamples.Table 1. Some Possible Customer Analysis123456Fig.8. Data Warehouse StructureTelecommunication CompaniesinAll the information from operationalsystems needs to be modelled in order tomake possible the customer data analysis.After business process understanding, thelogical business model must to bedeveloped. Logical model is necessary forKind of Analysis TypeCustomer Analysis per trafficand customer typeCustomer with SmartphonesData Traffic AnalysisSmartphone Sales per channeldistributionTraffic analysis per r per volume of dataused and product typeOffers and contract typeevolution in period per channelCustomer Analysis per Traffic andCustomer Type is possible if the DataWarehouse contains information abouttraffic and customers. Next we will definethe steps to implement traffic events inData Warehouse. This will be made in foursteps: ETL stage, Data Marts, UniversesBuilding, and Data Presentation inDynamic Reports.
44Customer Data Analysis Model using Business Intelligence Tools in Telecommunication CompaniesLogical ModelLarge AccountsDelivers fromWarehousePromotionsProductInsuranceLocal annelTypeAccountingSalesSales altiesFreeTimeRetentionFig.9. Logical Model for Customer AnalysisIn ETL Stage Data of Operational Systemsare Extract, Load and Transformed forData Warehouse. Operational systemsinvolves in traffic events are described infigure 10.special tool. One tool that can be used isInformatica. Data loading workflow fortraffic CDR’s from operational systemspresents is described in figure 11.Fig. 11. Traffic ETL Stage WorkflowFig. 10. Traffic Star SchemaThe traffic CDR's must be load in DataWarehouse. The ETL is made with aAfter data loading in stage, the data willmodeled for data mart. Based on Data Martcan be construct cubes for OLAP analysis(base for data mining). The Data Martmodel based on information in trafficCDR’s is presented in the figure 12.
Database Systems Journal vol. VI, no. 2/201545ProductEvent DateCostReporting DateTraffic segmentProduct SegmentClient TypeNetwork Events KPIsNumber of eventsDuration of eventsVolume of trafficTraffic CostTraffic billedInvoice DateDirection Category Result ValueCall End Point CategoryNetwork Events MarksNetwork TechnologiesNetwork ServicesEvent CategoryCustomersFig.12. Traffic Star Schema Data MartThe business needs for reporting arereflected in the star schema and also indata dimensions tables. In figure 13 arepresented a Data Mart Traffic DimensionTables.OKNOKOKNot OkFig.13. Traffic Data Mart Dimension TablesThe data modeled in Data Mart can beused with an OLAP business intelligencetool for Dynamic Reports Building. Oneexample is SAP Business ObjectsInfoView. The Information is presented indimensions and measures. We have oneexample presented in the figure 14.
46Customer Data Analysis Model using Business Intelligence Tools in Telecommunication CompaniesFig.14. Traffic Star SchemaUsing the data modeled in universes, userscan develop self services reports. They canselect information from traffic dimensionsand correlate with customer’s information.This is made to analyze customer’sbehavior by traffic components.All the elements presented in logical modelneeds to be modeled in Data Warehousesand presented in universes. The modellingprocess will be made following the stepspresented in this paper. In this way thefinal users will have all the elements for acomplete analysis of customer’s behavior.3. ConclusionsThe analysis of what is inside the data arebase for sales forecast. Also, the futureoffers, services and products are adjustbased on these dynamic reports. Theimportance of analyzing the own dataabout personal customers is very importantto telecom companies and is easy to madeusing business intelligence tools. In thispaper I presented a brief overview how tomodel the data from operational systems inorder to help the final users to developself-service and dynamic reports.AcknowledgmentsPersonal thanks to professor Ion Lunguwho help me in my odyssey of performing.And also to my kids, all special, who letme write in the nights. They sleep so wellso I can be very concentrate on my work.References[1] Sid Adelman, Larissa Terpeluk Moss,Data Warehouse Project Management,Ed. Addison-Wesley, Boston, 2004.[2] John Wang, Data Warehousing andMining, Concepts, Methodologies,ToolsandApplications,Ed.Information Science Reference, NewYork, 2004.[3] Ralph Kimball, Margy Ross, The DataWarehouse Toolkit, The CompleteGuide to Dimensional Modelling,Second Edition[4] I.Lungu,A.Bara,Sistemeinformaticeexecutive, ASE PublishingHouse, 2007[5] http://www.statsoft.com/[6] http://datawarehouse4u.info/[7] http://kb.tableau.com/articles/knowledgebase[8] ent-software-blog/
Database Systems Journal vol. VI, no. 2/201547Monica MANEA graduated from the Faculty of Cybernetics, Statistics andEconomic Informatics of the Academy of Economic Studies in 1996. She hasa postgraduate diploma in Accounting and Management Information Systems.She attended Stanford University Project Management Classes between 20052006. At present she is studying for the doctor's degree at the Academy ofEconomic Studies Bucharest.
Fig. 1. Business Intelligence Platform Modern Business Intelligence platform should provide an end-to-end infrastructure, solutions and technologies that support following issues: information integration, master data management, data warehousing, BI tools. A business intelligence platform includes the four