Transcription
Int J Legal Med (2016) 130:341–352DOI 10.1007/s00414-015-1297-9ORIGINAL ARTICLESelection of highly informative SNP markers for populationaffiliation of major US populationsXiangpei Zeng 1 & Ranajit Chakraborty 1 & Jonathan L. King 1 & Bobby LaRue 1 &Rodrigo S. Moura-Neto 2,3 & Bruce Budowle 1,4Received: 1 September 2015 / Accepted: 23 November 2015 / Published online: 8 December 2015# Springer-Verlag Berlin Heidelberg 2015Abstract Ancestry informative markers (AIMs) can be usedto detect and adjust for population stratification and predict theancestry of the source of an evidence sample. Autosomal single nucleotide polymorphisms (SNPs) are the best candidatesfor AIMs. It is essential to identify the most informative AIMSNPs across relevant populations. Several informativenessmeasures for ancestry estimation have been used for AIMsselection: absolute allele frequency differences (δ), F statistics(FST), and informativeness for assignment measure (In).However, their efficacy has not been compared objectively,particularly for determining affiliations of major US populations. In this study, these three measures were directly compared for AIMs selection among four major US populations,i.e., African American, Caucasian, East Asian, and HispanicAmerican. The results showed that the FST panel performedslightly better for population resolution based on principalcomponent analysis (PCA) clustering than did the δ paneland both performed better than the In panel. Therefore, theElectronic supplementary material The online version of this article(doi:10.1007/s00414-015-1297-9) contains supplementary material,which is available to authorized users.* Xiangpei ZengXiangpei.Zeng@live.unthsc.edu1Institute of Applied Genetics, Department of Molecular and MedicalGenetics, University of North Texas Health Science Center, 3500Camp Bowie Blvd., Fort Worth, TX 76107, USA2Instituto de Biologia, Universidade Federal do Rio de Janeiro, Rio deJaneiro, Brazil3Instituto Nacional de Metrologia, Qualidade e Tecnologia, Duque deCaxias, Brazil4Center of Excellence in Genomic Medicine Research (CEGMR),King Abdulaziz University, Jeddah, Saudi Arabia23 AIMs selected by the FST measure were used to characterize the four major American populations. Genotype data ofnine sample populations were used to evaluate the efficiencyof the 23-AIMs panel. The results indicated that individualscould be correctly assigned to the major population categories.Our AIMs panel could contribute to the candidate pool ofAIMs for potential forensic identification purposes.Keywords Ancestry informative markers (AIMs) . Singlenucleotide polymorphisms (SNPs) . Populationdifferentiation . HapMap . 1000 Genomes . FSTIntroductionAncestry informative markers (AIMs) are genetic makers thatshow large differences in allele frequencies between humanpopulations [1–4]. These differences allow determination ofpopulation affiliation and apportionment of ancestry and canbe used to detect and adjust for population stratification ingenome-wide disease-gene association studies. Moreover,AIMs can play a role in ancestry inference to support investigative leads from forensic genetic evidence [5–7]. The valueof AIMs in a forensic investigation is that these markers mayprovide critical evidence about the source of an evidence sample or about the ancestry of unidentified human remains.Ancestry information may help to narrow the range of suspects and thus make better use of limited investigativeresources.There are four types of genetic markers that could provideancestry information: mitochondrial DNA (mtDNA), Y chromosome markers, autosomal short tandem repeats (STRs),and single nucleotide polymorphisms (SNPs). Lineagemarkers (Y-linked and mtDNA haplotypes) have proven effective in studying human migration and evolutionary
342histories across the world [8–10]. However, due to uniparentalinheritance and lack of recombination, their utility for population affinity inferences is not comprehensive. Further, because of uniparental ancestry of these markers, the contributions of the majority of an individual’s genome are notassessed. STRs typically are highly polymorphic, and a relatively small panel of markers can successfully distinguish anindividual from others, excluding identical twins. However,autosomal STRs are limited for ancestry inferences, becausethe majority of common alleles of STRs are shared amonghuman populations, and STRs have a relatively high mutationrate [11]. Contraction-expansion pattern of mutations at STRloci also imply that STR alleles of the same repeat size maynot all be identical by descent [12]. In spite of these, somepanels of STR markers have been shown to distinguishAfrican Americans, Hispanics, European Americans, andAsians to some degree [13]. In contrast, SNPs have a relatively low mutation rate; the same SNP allele at most genomiclocation is often identical by descent, and millions of humanSNPs are available in public databases, e.g., SNP database,International HapMap project, and 1000 Genomes [14–16].Thousands of SNPs with different allele frequencies betweenpopulations can be selected for ancestry and human population affinity studies. Therefore, autosomal SNPs are recognized as the best candidates for AIMs. Indeed, several SNPpanels have been developed for potential application of ancestral inference in forensic genetics [17–21].An ideal AIM SNP would have one allele fixed in onepopulation and be completely absent in another population. However, the majority of alleles are shared to somedegree between or among populations. It is essential toidentify the most informative AIM SNPs across relevantpopulations. Several marker informativeness measures forancestry estimation have been applied for selection ofAIMs. These measures include absolute allele frequencydifferences (δ) [22], F statistics (FST) [23], and informativeness for assignment measure (In) [22]. Some theoretical as well as empirical studies compared the effectiveness of these alternative measures of informativeness forancestry determination [22, 24]. Various studies have usedthese different measures to select AIMs [18–21]. Whilethe logic of using these measures is similar, their efficacyhas not been compared with objective selections ofgenome-wide SNPs, particularly for determining affiliations for major US populations. With an abundance ofSNPs in International HapMap project and 1000Genomes, it is possible to select an informative minimalnumber panel of AIMs and compare whether any of thesemeasures are better for discovery of such efficient panelsof AIMs. Therefore, the objective of this study was toselect the most informative AIMs using the three measures (δ, FST, and In) that resolve pairs of major populations and identify a robust panel of AIMs that couldInt J Legal Med (2016) 130:341–352characterize the four major US populations (e.g., AfricanAmerican, Caucasian, East Asian, and HispanicAmerican). To date, there are no agreed upon core AIMsfor forensic use. Therefore, these additional SNPs are provided to support AIMs panel development.Materials and methodsPopulation samplesThe HapMap project [15] contains comprehensive SNP dataon the four major US populations: African ancestry fromSouthwest USA (ASW), Utah residents with Northern andWestern European ancestry (CEU), Chinese fromMetropolitan Denver, Colorado (CHD), and Mexican ancestryfrom Los Angeles, California (MEX). The samples includedin the HapMap project are family duos and trios. The childrenwere removed, and only unrelated parents were used in thestudy. From the HapMap Phase III, genotype data were available for 52, 120, 85, and 50 unrelated individuals from ASW,CEU, CHD, and MEX, respectively s/2010-08 phaseII III/).AIMs selectionThe measures used for AIMs selection were δ, FST, and In.The candidate AIMs were selected in three steps. First, thethree measure values of each SNP were computed for eachpairwise population comparison, and then markers wereranked based on these measures from highest to lowest of theirvalues. These pairwise measures were calculated usingAncestrySNPminer iner/home.php) [25]. Second, the top 30informative markers for each measure in each pairwisepopulation comparison were chosen. GDA v1.1 [26] wasused to test for departures from Hardy-Weinberg equilibriumand linkage disequilibrium (LD) of these top 30 AIMs in eachpairwise population comparison. The minimum number ofmarkers, for each measure, to discriminate each pair of populations was identified based on principal component analysis(PCA) using the EIGENSOFT v6.0.1 [27] and receiver operating characteristics curve (ROC curve) [28]. Finally, the topmarkers from six pairwise population comparisons werepooled based on the three measures and evaluated as individual panels.Statistical power of AIMsThe number of AIMs, which was assessed to distinguish thetwo populations, was increased from 1 to 30 with incrementsof 1, starting with the most informative SNP and then sequentially adding the next most informative SNP. The changes of
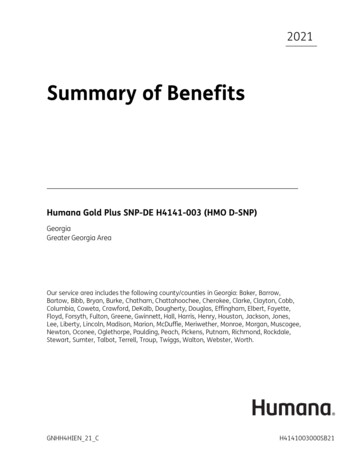
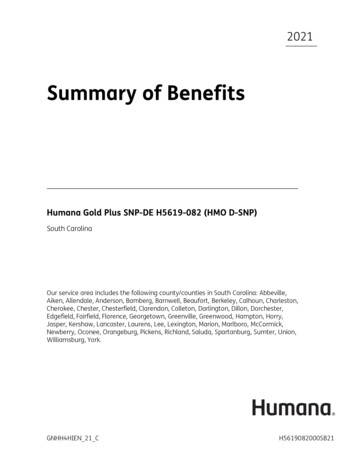
Int J Legal Med (2016) 130:341–352PCA clusters were examined. The PCA clustering performances of these AIMs in individual classification wereassessed using the maximum Matthews correlation coefficient(MCC) [29]:T P T N FP FNM CC ¼ ffiffiffiffiffiffiffiffiffiffiðT P þ FPÞðT P þ FN ÞðT N þ FPÞðT N þ FN Þwhere TP and FP are the amount of true positives and falsepositives, respectively, and TN and FN represent the amountof true negatives or false negatives, respectively. Two populations were determined to be completely separated with thedataset when MCC reaches one. The ROC curve is constructed by plotting the true positive rate against the false positiverate at different cutoff values. The cutoff values of PC1 weredetermined by using the ROC curve. This curve is a graphicalplot that demonstrates the performance of a binary classifiersystem with different discrimination thresholds. ROC curveanalyses were performed using the XLSTAT software [30].The Bayesian clustering algorithm (STRUCTURE) [31] wasused to estimate ancestry and individual admixture proportions. Discriminant function analysis (DFA) is a statisticalmethod to predict category membership by a set of independent variables [32]. In this study, DFA using SPSS v16.0 [33]was used to provide a probability of population assignment foreach individual sample.Results and discussionsAIMs selectionThree measures (δ, FST, and In) were used for AIMs selectionin the four major American populations. Of the millions ofSNPs existing in the SNP databases, there were 1318288,1232531, 1369287, 1211787, 1307348, and 1221276 SNPsavailable for comparisons of ASW and CEU, ASW and CHD,ASW and MEX, CEU and CHD, CEU and MEX, and CHDand MEX, respectively. Values of the three measure of eachSNP were computed and markers were ranked for eachpairwise population comparison. The same SNP may be selected by different measures but could be ranked differently. Inorder to avoid strong LD, the minimal physical distance of anytwo SNPs located on the same chromosome was set initially at100 kb. The top 30 AIMs for each measure in each pairwisepopulation comparison were chosen.Among the four populations (ASW, CEU, CHD, andMEX), there were no detectable departures from HardyWeinberg equilibrium expectations for the selected SNPs. Afew SNP pairs did display LD (Supplemental Tables 1, 2, 3, 4,5, and 6). In those instances where two markers were in LD,the more informative one was selected and the less informative one was deleted. For example, rs1288097 and343rs12594483 were in LD in ASW and CEU; rs1288097 wasselected (the second most informative marker) butrs12594483 was deleted (the third most informative marker)(Supplemental Table 1). Therefore, the top 30 candidate SNPswere reduced to less than 30 AIMs in all population pairs. Forexample, the top 30 SNPs were reduced to 26, 24, and 22AIMs by δ, FST, and In, respectively, in CEU and MEX(Supplemental Table 5). In order to determine the minimumnumber of SNPs to separate the paired populations, the candidate AIMs were increased in increments of 1 starting fromthe most informative SNP. Maximum MCC was used to evaluate the PCA clustering performance of the selected AIMs forindividual classification. The minimum numbers of markersto distinguish any two populations were identified, and theresults were listed in Supplemental Table 7. The number ofAIMs needed to resolve any of the six population pairs rangedfrom two to nine SNPs. As expected, CEU and MEX neededthe largest number of SNPs to be separated. Maximum MCCcurves showed that at least eight AIMs were required to distinguish CEU and MEX for δ and FST measures (MCC 1),while the MCC value of the In measure reached one at nineAIMs (Fig. 1). Figure 2a shows classification accuracy of 170samples (CEU and MEX) utilizing a different number ofAIMs that were selected by the δ measure. The MCC valueincreased with the increment of AIMs, and the value reachedone when the top eight informative AIMs were used (Fig. 2a).In addition, PCA clusters showed that CEU was generallydistinguished from MEX individuals using the genotype dataof these eight AIMs (Fig. 2b). However, CEU and MEX couldnot be completely resolved, due to the known Caucasian admixture component in MEX. Indeed, some MEX individualsmay never be resolved from CEU or from African or NativeAmerican populations because of their large individualspecific admixture components [34–36].Comparison of the three measuresEach of three measures selected 25 total markers to characterize the four major American populations (in pairwisecomparisons) (Supplemental Table 7). In the δ panel ofmarkers, rs4429562 was shared by CEU and CHD, andCHD and MEX comparisons, so this marker was countedonce. Two pairs of SNPs were in LD: rs6674304 andrs12087334, rs974627 and rs469471. One of them,rs6674304, was the third most informative marker betweenASW and CEU, while rs12087334 was the most informativemarker between ASW and MEX. In order to achieve the bestseparation for the overall panel, rs12087334 was selectedand rs6674304 was replaced by rs7689609 (the fourth informative marker between ASW and CEU). After replacement,the PCA clusters showed that the three AIMs (rs1834640,rs1288097, and rs7689609) still were able to resolve ASWand CEU. Markers rs974627 and rs469471 were in LD,
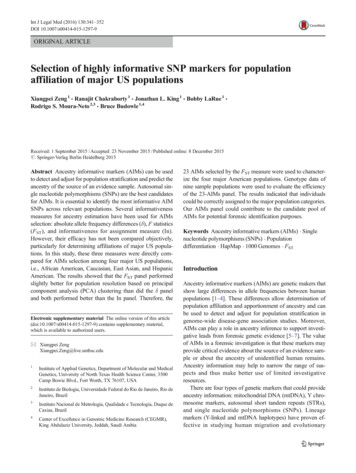
344Int J Legal Med (2016) 130:341–352Fig. 1 The three MCC curvesgenerated by δ, FST, and Inmeasures for MEX and CEUalthough they were located on different chromosomes.While this departure is not explained by synteny and couldbe due to chance, to attain good separation between CEUand MEX, rs974627 was selected and rs469471 was replaced by rs1761031 (the fifth informative marker betweenCHD and MEX). After replacement, the four markers(rs4429562, rs6500380, rs8032157, and rs1761031) stillcould distinguish CHD and MEX. In the F ST panel,rs1834640 and rs4429562 were shared by two pairwisecomparisons and therefore only counted once; rs974627and rs469471 were in LD, so rs469471 was replaced byrs1761031. In the In panel, rs1834640 and rs4429562 wereinformative in two population pairs and only counted once;rs6674304 and rs12087334 were in LD, and rs6674304 wasreplaced by rs1572510. The resultant total number ofmarkers in the AIMs panels selected by δ, FST and In was24, 23, and 23, respectively (Table 1). Twenty-two of 23AIMs in the FST panel were also in the δ panel, with a similarity rate of 0.95 (Table 2). The similarity rates of δ and In(16 of 23 SNPs in common) and FST and In (17 of 23 SNPs incommon) were 0.70 and 0.74 (Table 2). Although not substantially different, the PCA cluster results of the FST panelappeared to perform slightly better than the δ panel (Fig. 3a,b). Only two MEX individuals clustered with the CEUgroup, and no CEU individuals clustered with the MEXgroup. Both the δ and FST panels performed better than theIn panel, in which some MEX individuals cannot be distinguished between CEU and CHD (Fig. 3c). The correlationcoefficients of PC1 and PC2 between δ and FST panels were0.997 and 0.996, respectively, while the correlation coefficients of between δ and In, FST, and In were much lower(Supplemental Table 8). The statistical results indicated thatδ and FST panels generated more similar results comparedwith In panel. In addition, the FST panel had one fewer SNP,so the 23 AIMs selected by the FST measure were used tocharacterize the four major American populations.STRUCTURE was used to examine the full set of 23 AIMswith population clusters (K) increasing from 2 to 10, and tenFig. 2 The AIMs panel that was selected by the δ measure to separate CEU and MEX. a The classification accuracy of 170 samples (CEU and MEX)utilizing a varied number of selected AIMs; b PCA clusters of two populations by using genotype data of top eight AIMs identified in a
Int J Legal Med (2016) 130:341–352345Table 1 The final panels of AIMs identified by the three measures δ, FST, and In to distinguish the four major US populations. The 23 AIMs selected bythe FST measure were used to characterize the four major American populations. The physical distances of SNPs were downloaded from GRCh37.p13 (hg nsSNPsChrPosPopulationsrs18346401548392165ASW CEUrs18346401548392165ASW CEUrs18346401548392165ASW CEUrs1288097rs76896091544514137372083374ASW CEUASW CEUrs1288097rs76896091544514137372083374ASW CEUASW CEUrs1288097rs1572510151345141373105381134ASW CEUASW CEUrs71659711555921013ASW CHDrs71659711555921013ASW CHDrs71659711555921013ASW CHDrs745767rs1302139922177825415109006665ASW CHDASW CHDrs745767rs1302139922177825415109006665ASW CHDASW CHDrs745767rs1302139922177825415109006665ASW CHDASW CHDrs12087334rs1214926111611688745570998145ASW MEXASW MEXrs12087334rs1214926111611688745570998145ASW MEXASW MEXrs12087334rs11845995114116887455105930923ASW MEXASW MEXrs18279504117098482ASW MEXrs1184599514105930923ASW MEXrs121492611670998145ASW MEXrs11845995rs4429562142210593092342892596ASW MEXCEU CHDrs1827950rs442956242211709848242892596ASW MEXCEU CHDrs1827950rs442956242211709848242892596ASW MEXCEU 0338277754CEU CHDCEU CHDCEU 3721260370CEU CHDCEU MEXCEU 2050237637CEU MEXCEU MEXCEU MEXrs10962599rs71347499121679528650237637CEU MEXCEU MEXrs11725412rs27003724338277754123633220CEU MEXCEU MEXrs7404672rs117254121641096647938277754CEU MEXCEU 038919524CEU MEXCEU MEXCEU 5116795286CEU MEXCEU MEXCEU 30751286CEU MEXCEU MEXCEU MEXrs1014173314101142651CEU MEXrs9746271238919524CEU MEXrs93073884114075688CEU 33220483757776448088846926398CEU MEXCHD MEXCHD MEXCHD 8846926398CHD MEXCHD MEXCHD 814838552CHD MEXCHD MEXCHD MEXruns were performed at each value of K. All STRUCTUREruns were performed without using any prior population information. CLUMPP software was used to combine tenSTRUCTURE runs for a particular value of K (K 4) andcompute the average cluster membership values [37]. Theoptimal number of K was determined to be 4 (Fig. 4a). TheTable 2 Shared number of AIMs between δ, FST, and In among the toptwo to nine markers for six pairs of population comparisonsPopulation comparisonsASW and CEUASW and CHDASW and MEXCEU and CHDCEU and MEXCHD and MEXNumber of markers sharedδ and FSTδ and InFST and In334273234133234152average cluster assignment values of the optimal K (K 4) wasused in the Distruct program to generate the STRUCTUREgraph [38]. Individuals of CEU and CHD were more homogenous compared with ASW and MEX individuals, in whichsome individuals have demonstrated admixture of CaucasianSNPs (Fig. 4b).Evaluation of AIMs panelIn order to evaluate the efficiency of the 23-AIMs panel, thegenotype data of nine populations (not used for selecting theAIMs) were downloaded from HapMap [15] and 1000Genomes [16] databases. Four populations from theHapMap project were used: Yoruba from Ibadan, Nigeria(YRI); Toscans from Italy (TSI); Han Chinese from Beijing,China (CHB); and Japanese from Tokyo, Japan (JPT).Individuals without genotype data of three or more SNPs fromthis panel were excluded. There were 53 YRI, 82 TSI, 79CHB, and 42 JPT unrelated individuals available for the evaluation study. In PCA clusters, the test samples that fell within
346Int J Legal Med (2016) 130:341–352Fig. 3 The PCA clusters of the AIMs panels that were selected by a δ, b FST, and c In measures, respectivelythe 95 % confidence interval of one of the four referencepopulations were classified as belonging to that reference population. DFA was used to provide a probability of assignmentof an individual sample with one or more of the referencepopulations, especially those that did not fall within the95 % confidence interval of a reference population. Of the23 SNPs, HapMap does not provide genotype data ofrs10510511 for ASW and of rs10962599 for CHD. In PCA,23 AIMs can be used simultaneously to predict ancestry ofknown populations (YRI, TSI, CHB, and JPT) based on fourFig. 4 Analyses of four major US populations from HapMap using the AIMs panel selected by FST. a Indicated that the optimal number of K was 4. bThe STRUCTURE cluster plots of four populations (ASW, CEU, CHD, and MEX)
Int J Legal Med (2016) 130:341–352reference populations (ASW, CEU, CHD, and MEX) andmissing data are tolerated in this method. However, only 21AIMs (without rs10510511 and rs10962599) could be used inDFA for each population assignment, because, unlike PCA,this method requires genotype data on all loci for each individual. Approximately 92 % of YRI individuals fell within the95 % confidence interval of ASW in PCA clusters (Fig. 5a).The DFA results assigned all YRI individuals to ASW group(Fig. 6a, Supplemental Table 9). YRI individuals likely do nothave substantial Caucasian admixture compared with AfricanAmericans and yet clustered with ASW. A portion (30 %) ofTSI samples (Northern Italy) fell outside the 95 % confidenceinterval of CEU in PCA, but they could be considered similarto Caucasian or Hispanic American and not African Americanand East Asian (Fig. 5b). TSI individuals do not have genotype information for rs1834640, so three SNPs were removedfor DFA (rs1834640, rs10510511, and rs10962599). The results assigned all TSI individuals to CEU (Fig. 6b,Supplemental Table 9). In the AIMs selection, Chinese fromMetropolitan Denver, Colorado (CHD), were used to347represent the East Asian population. The majority (94 % and81 %) of CHB and JPT, respectively, individuals fell withinthe 95 % confidence interval of CHD in PCA clusters (Fig. 5c,d). Five CHB individuals and eight JPT individuals were outside that of CHD. These 13 samples still would be consideredas East Asians, because they were comparatively more isolated from the other major populations in the PCA clusters.HapMap does not provide genotype data of rs11845995 forJPT, so only 20 SNPs were used in DFA to predict the ancestryof JPT individuals (rs11845995, rs10510511, and rs10962599were removed). The DFA results assigned all CHB and JPTindividuals to the East Asian group (Fig. 6c, d, SupplementalTable 9). Five populations from 1000 Genomes also wereused in the evaluation study: Yoruba from Ibadan, Nigeria(YRI); British in England and Scotland (GBR); Han Chinesefrom Beijing, China (CHB); Colombians from Medellin,Colombia (CLM); and Mexican Ancestry from Los Angeles,USA (MEX). There were 108 YRI, 91 GBR, 103 CHB, 94CLM, and 17 MEX unrelated individuals. 1000 Genomesdoes not provide genotype data for rs12149261. Twenty-Fig. 5 Population classification of four global populations from HapMap using PCA. a–d represented YRI, TSI, CHB, and JPT, respectively
348Int J Legal Med (2016) 130:341–352Fig. 6 Population classification of four major populations from HapMapusing DFA. Groups 1–4 represented ASW, CEU, CHD, and MEX,respectively. The ungrouped cases in a–d were individuals of YRI, TSI,CHB, and JPT, respectively. Some SNPs were excluded from the analysisbecause of missing data. Overall, 21, 20, 21, and 20 AIMs were used ina–d, respectivelythree SNPs could be used in PCA to predict ancestry of YRI,GBR, CHB, CLM, and MEX individuals, but only 20 SNPswere used in DFA (rs12149261, rs10510511, and rs10962599were removed). YRI individuals clustered better than AfricanAmericans and not cluster with the other three major populations. Therefore, they were classified as African Americans inboth PCA and DFA (Figs. 7a and 8a, Supplemental Table 10).The majority of GBR individuals were located within the95 % confidence interval of the Caucasian group in PCA(Fig. 7b), and all of them were assigned as Caucasians byDFA (Fig. 8b, Supplemental Table 10). Eight CHB individuals fell outside the 95 % confidence interval of CHD in PCA(Fig. 7c), but all of them were assigned as East Asians in DFA(Fig. 8c, Supplemental Table 10). CLM individuals were themost difficult to assign. They were classified as AfricanAmericans, Caucasians, and Hispanic Americans (Fig. 7d).According to Bushnell et al. [39], 86 % of Columbians aremestizo and white, 10 % are black. The majority of CLMindividuals were classified as Hispanic Americans orCaucasians, and up to four samples could be considered asAfrican Americans in PCA (Fig. 7d). The DFA provided results of 4, 26, and 64 individuals assigned as AfricanAmericans, Caucasians, and Hispanic Americans, respectively (Fig. 8d, Supplemental Table 10). The ancestry of eachColombian individual was not provided by 1000 Genomes.Therefore, population assignment is difficult for CLM. In addition, the Mexican population (MEX) only represents theHispanic population in US and may not precisely explain thegenetic variations of the Hispanic populations in CentralAmerica and South America. Both HapMap and 1000
Int J Legal Med (2016) 130:341–352349Fig. 7 Population classification of five populations from 1000 Genomes using PCA. a–e represented YRI, GBR, CHB, CLM, and MEX, respectivelyGenomes databases contain samples of Mexican Ancestryfrom Los Angeles, USA (MEX). There were only 17 samplesincluded in 1000 Genomes that were not used in our AIMsselection (based on HapMap data). Twelve out of 17Fig. 8 Population classification of five populations from 1000 Genomesusing DFA. Groups 1–4 represented ASW, CEU, CHD, and MEX,respectively. The ungrouped cases in a–e were individuals of YRI,GBR, CHB, CLM, and MEX, respectively. Three SNPs were excludedfrom the analysis because of missing data
350individuals were within the 95 % confidence interval ofHispanic American in PCA (Fig. 7e). All individuals wereclassified as Hispanic Americans by DFA (Fig. 8e,Supplemental Table 10).Overall, the results indicated that these 23 AIMs can correctly assign individuals to the major population categories.However, these public databases only provide the genotypedata of 20 or 21 AIMs for each population and thus the fullpower of the 23-AIMs panel could not be evaluated. A futurestudy will develop an in-house 23-AIMs panel to generatedata on samples from four major US populations. Therefore,empirical testing of the full set of these AIMs will furtherevaluate the efficiency of the panel.Summary of several AIMs panelsSeveral AIMs panels have been described for potential forensic application (Supplemental Table 11). Two largepanels were developed by Kosoy et al. [18] and Halderet al. [40] to characterize seven and four populations,respectively. Nievergelt et al. [20] used In measure toselect 41 AIMs to distinguish populations from sevencontinental regions (Africa, the Middle East, Europe,Central/South Asia, East Asia, the Americas, andOceania). Kidd et al. [19] utilized 55 AIMs to analyze73 populations from around the world. Phillips et al.[41] selected 128 AIM-SNPs to differentiate Africans,Europeans, East Asians, Native Americans, andOceanians. Gettings et al. [42] used a 50-SNP assay forbiogeographic ancestry and phenotype prediction of themajor US populations in which 19 of the SNPs were ancestry informative markers. Three recently developedAIMs panels from Jia et al. [43], Rogalla et al. [44], andWei et al. [21] contain 35, 14, and 27 SNPs to characterize three populations: African, European, and East Asian.Although there are several AIMs sets available, there isno universal core set of SNPs for ancestry inference.Therefore, we developed a SNP AIMs panel with the intent to use a minimum number of markers to characterizefour major American populations: African American, EastAsian, European American, and Hispanic American.These 23 markers could contribute to the candidate poolof AIMs for potential forensic identification purposes.Only two of our markers, rs11725412 and rs1834640,are in common with another panel (i.e., Nievergelt’s panel). While MPS allows much larger panels to be evaluated, reducing the number of markers for both ease of paneldevelopment and increased throughput is desirable onboth MPS and CE platforms. More samples could bemultiplexed in an assay on the former platform, and marker multiplexing would be a better fit on the latter platform.Therefore, identifying a minimum number of AIMs todistinguish four US populations was sought. In our panel,Int J Legal Med (2016) 130:341–352there are four SNPs from chromosome 15, and they arelocated within 3–8 Mb of each other. Although they arenot in LD within the four US populations, it is possiblethat they may affect admixture membership estimation inother populations.ConclusionIn this study, three marker inform
ORIGINAL ARTICLE Selection of highly informative SNP markers for population affiliation of major US populations Xiangpei Zeng1 & Ranajit Chakraborty1 & Jonathan L. King1 & Bobby LaRue1 & Rodrigo S. Moura-Neto2,3 & Bruce Budowle1,4 Received: 1 September 2015/Accepted: 23 November 2015/Published online: 8 December 2015