Transcription
Gross et al. BMC Medical Research Methodology (2018) ARCH ARTICLEOpen AccessHarmonization of delirium severityinstruments: a comparison of the DRS-R-98,MDAS, and CAM-S using item responsetheoryAlden L. Gross1,2* , Doug Tommet3, Madeline D’Aquila4, Eva Schmitt4, Edward R. Marcantonio4,5,Benjamin Helfand3,6, Sharon K. Inouye4,5†, Richard N. Jones3† and for the BASIL Study GroupAbstractBackground: This study aimed to describe the level of agreement of three commonly used delirium instruments:the Delirium Rating Scale-Revised-98 (DRS-R-98), Memorial Delirium Assessment Scale (MDAS), and ConfusionAssessment Method-Severity (CAM-S).Methods: We used data from a prospective clinical research study, in which a team of trained lay interviewersadministered each instrument along with supporting interview and cognitive assessments in the same group ofpatients daily while in the hospital (N 352). We used item response theory methods to co-calibrate the instruments.Results: The latent traits underlying the three measures, capturing the severity of a delirium assessment, had a highdegree of correlation (r’s .82). Unidimensional factor models fit well, facilitating co-calibration of the instruments. Acrossinstruments, the less intense symptoms were generally items reflecting cognitive impairment. Although the intensity ofdelirium severity for most in the sample was relatively low, many of the item thresholds for the delirium severity scalesare high (i.e., in the more severe range of the latent ability distribution). This indicates that even people withsevere delirium may have a low probability of endorsing the highest severity categories for many items.Co-calibration enabled us to derive crosswalks to map delirium severity scores among the delirium instruments.Conclusion: These delirium instruments measure the same underlying construct of delirium severity. Relative locationsof items may inform design of refined measurement instruments. Mapping of overall delirium severity scores across thedelirium severity instruments enabled us to derive crosswalks, which allow scores to be translated across instruments,facilitating comparison and combination of delirium studies for integrative analysis.Keywords: Delirium, Severity, Elderly, Psychometrics, Item response theoryBackgroundDelirium -- the acute onset of inattention, global cognitiveimpairment, and frequent co-occurring psychomotor, behavior or perceptual disturbance -- is a common, serious,and often preventable complication among hospitalizedand institutionalized older adults [1]. An estimated 12 million older Americans ( 65 years-old) experience an episode* Correspondence: agross14@jhu.edu†Sharon K. Inouye and Richard N. Jones contributed equally to this work.1Department of Epidemiology, Johns Hopkins Bloomberg School of PublicHealth, 2024 E. Monument Street, Baltimore, MD 21205, USA2Johns Hopkins University Center on Aging and Health, Baltimore, MD, USAFull list of author information is available at the end of the articleof delirium each year [2, 3]. Delirium is distressing to patients and their families [4], prolongs hospital stays, delaysrehabilitation, and is associated with excess risk of dementiaand death [3, 5].In proportion to its personal and public healthimpact, delirium is an understudied neuropsychiatricdisorder [2, 3]. While delirium is preventable [6],effective treatments remain elusive [2, 3]. Publishedtreatment trials have been hampered by discrepantfindings and important methodologic limitations [7,8]. One important methodological distinction is thatfor delirium prevention trials, delirium incidence is an The Author(s). 2018 Open Access This article is distributed under the terms of the Creative Commons Attribution 4.0International License (http://creativecommons.org/licenses/by/4.0/), which permits unrestricted use, distribution, andreproduction in any medium, provided you give appropriate credit to the original author(s) and the source, provide a link tothe Creative Commons license, and indicate if changes were made. The Creative Commons Public Domain Dedication o/1.0/) applies to the data made available in this article, unless otherwise stated.
Gross et al. BMC Medical Research Methodology (2018) 18:92appropriate primary outcome, while for delirium treatment trials, outcomes that track the course of deliriumover time are essential. A set of responsive severity outcome measures that are valid reflections of symptomseverity would greatly facilitate delirium treatment trials.Finding measures that correlate with underlying pathophysiologic mechanisms would also help advance ourfundamental understanding of delirium and to developmore pathophysiologically based treatments. Both strategies would require the availability of sophisticated andfine-grained delirium severity measures.Delirium severity ratings have important clinicaland research applications because they provide directly graded, continuous measures, are correlated withclinical outcomes, and can be powerful prognosticpredictors. Clinical uses of such measures includetracking change in delirium and its symptoms overtime, identifying the earliest onset of clinically significant delirium, monitoring recovery from an episode,gauging patient and caregiver needs, and maintainingsafe staffing levels in hospitals or at home. Additionally, there are important research implications for delirium severity measures. Higher severity leads toincreased risk of long-term cognitive decline; thus,serial monitoring of severity is important in studies.Such measures provide key outcome measures forclinical trials and prognostic studies. These types ofmeasures could also demonstrate graded impact of severity on health care delivery and costs. Additionally,correlations of delirium severity measures with biomarkers may help advance pathophysiologic understanding of delirium.A multitude of measures have been designed tomeasure the severity of delirium. Currently used delirium severity measures provide mixed coverage of delirium signs and symptoms. In our review of theliterature (Jones et al. in preparation), we find thatthe most frequently cited multiple item summative instruments used to rate the severity of a delirium episode include the Confusion Assessment Method(CAM and CAM-S [9, 10]), the Delirium Rating Scale(DRS, and DRS-R-98 [11, 12]), and the Memorial Delirium Assessment Scale (MDAS [13]). The goal ofthis paper is to describe the measurement propertiesand correspondence of these three most commonlyused delirium severity instruments. We do this in thecontext of a clinical research study of older hospitalized patients, where a team of trained lay interviewersadministered each instrument along with supportinginterview and cognitive assessments to the samegroup of patients daily while in the hospital. Wemake use of modern psychometric methods to describe the extent to which these instruments measurethe same underlying attribute.Page 2 of 18MethodsAim and designThe goal of this project was to describe the relationshipof three delirium severity instruments to one another.We accomplished this within a prospective observationalstudy of hospitalized older adults using modern psychometric methods including factor analysis and item response theory.Study sample and procedureThe Better Assessment of Illness (BASIL) study is an ongoing prospective cohort study, with planned one-yearfollow-up of all study participants. Eligible BASIL participants were aged 70 years or older, English speaking, andresiding within 40 miles of and admitted or transferredto the medical or surgical services and Beth Israel Deaconess Medical Center (BIDMC), Boston, MA. Bothemergency and elective admissions were enrolled. Exclusion criteria included evidence of active alcohol abuse,diagnosis of schizophrenia or other psychotic disorder,severe deafness, nonverbal condition, immediate discharge plans, or terminal condition. Of patients enrolledbetween October 2015 and March 2017, N 352 patients had some data on each of the three deliriumseverity instruments for at least one day and comprisethe sample for the present study. Trained lay interviewers assessed participants for delirium daily whilehospitalized, and each participant provided between 1and 15 daily assessments. Interviewers used a structuredprotocol to assess delirium and underwent in-depthtraining before administering the cognitive tests andcoding the three delirium severity instruments.Inter-rater reliability checks were conducted regularlyduring the study to assure high quality ratings on thesemeasures.Conceptualization of the measurement of deliriumseverity and intensityWe distinguish the intensity and severity in the contextof delirium. As used in the field, delirium severity is abroad concept that encompasses the intensity of multiple symptoms. To allow for the conceptual distinctionof the varied aspects of delirium severity, we use theterm intensity to describe the distribution of cognitive,behavioral, psychiatric, and functional signs and symptoms associated with a single assessment. Intensity isviewed as existing along a continuum, ranging from theabsence of signs and symptoms of delirium to highly disruptive behaviors or severely impairing symptoms. Intensity occupies the same conceptual space as the sumof symptom ratings represented by the total scores onthe DRS-R-98, MDAS, and CAM-S. However, each instrument has its own metric that is defined by the particular selection of the number of domains assessed and
Gross et al. BMC Medical Research Methodology (2018) 18:92Page 3 of 18the specific definitions used to characterize different rating levels of each sign or symptom. The result is that thesummary scores may not necessarily have a direct relationship to one another, and thus, it can be challengingto integrate results from different studies using differentmeasurement instruments.We address this challenge by using item response theorymethods to define the metric of underlying intensity ofthe individual delirium signs and symptoms. We use acommon item equating design [14] and item responsetheory methods [15] to define an underlying delirium intensity metric that is equal across all three instruments.Moreover -- and as a consequence of using item responsetheory to define the metric for intensity -- the intensitymetric can be used to describe the signs or symptoms; thatis, the metric can be used to describe the level of impairment expressed by an individual patient at a discrete timeof observation. Also, the metric can be used to describespecific items that assess the signs or symptoms of delirium: namely the region of the intensity metric that is measured symptoms are rated in lower or higher categories. Inthis way, the conceptualization of delirium severity represents a composite of the intensity of individual symptoms.disturbances. Again, an overall score is created by summingeach item score; scores of 13 or higher indicates delirium,and higher scores indicate greater delirium severity.The CAM [9] consists of 10 operationalized itemsfrom the DSM-III: acute onset and fluctuation, inattention, disorganized thinking, altered level of consciousness, disorientation, memory impairment, perceptualdisturbances, psychomotor agitation or retardation, andaltered sleep-wake cycle. The CAM diagnostic algorithmof delirium requires the presence of acute onset andfluctuation and inattention, and either disorganizedthinking or altered level of consciousness. The severityscores derived from the CAM include the CAM-S [10]long form (10 items from the full CAM) and short form(four items from CAM diagnostic algorithm). Scoringsystems allow for the quantification of the severity of delirium. The CAM-S is scored by rating CAM features,except acute onset or fluctuation, on a three-point scale:0 (absent), 1 (mild), or 2 (marked). Acute onset or fluctuation is rated 0 (absent) or 1 (present). The composite(sum) short form scores range from 0 to 7, and the longform scores range from 0 to 19, with higher scores indicating greater delirium severity.Delirium severity assessment instrumentsDelirium ratingThe DRS-R-98, MDAS, and CAM-S were used to ratedelirium severity following brief interviews. The instruments encompass some overlap in features of deliriumyet are distinctive. The instruments vary in their coverage of delirium severity domains and the manner inwhich the intensity of a specific symptom is rated. Thus,the interview source items used to score the three instruments vary.The DRS-R-98 [16] uses family, chart, and nurses toidentify and rate the severity of delirium according to 13items: sleep/wake cycle disturbance, perceptual disturbances and hallucinations, delusions, lability of affect, language, thought process abnormalities, motor agitation,motor retardation, orientation, attention, short-termmemory, long-term memory, and visuospatial ability Theratings for each item include 0 (no impairment), 1 (mild),2 (moderate), and 3 (severe impairment). An overall scoreis created by summing the score for each item and higherscores indicate greater severity of delirium.The MDAS [13] assesses the severity of delirium using10 items on a four point scale (0 to 3) similar to theDRS-R-98 scale described above. The items assess diagnostic criteria of delirium according to the Diagnosticand Statistical Manual of Mental Disorders, Fourth Edition (DSM-IV [17]). MDAS items include reduced levelof consciousness, disorientation, short-term memory,impaired digit span, reduced ability to maintain and shiftattention, disorganized thinking, perceptual disturbance,delusions, psychomotor activity, and sleep/wake cycleThe daily hospital interviews in the BASIL study included avariety of formal questions and cognitive tests. These interview items were administered by the same raters, in sameordering, for every participant. In addition, interviewersgathered observational evidence throughout the hospitalvisits. Inter-rater reliability was assured through initialtraining and ongoing standardization approaches of theraters throughout the study. We modified the DRS-R-98 toaccommodate assessment by trained lay interviews, ratherthan clinicians as originally intended by its developers. Thescoring of the DRS-R-98, MDAS, and CAM-S was informed by source items (e.g., interview questions or cognitive tests) and informal observations. In addition toquestioning and cognitive testing, the rated items in thethree instruments include symptoms rated based on observations of the patient noted throughout the interview. Interviewers were trained to take extensive observationalnotes during the entire course of the patient visit. Somerated items, such as abnormal level of consciousness andpsychomotor agitation/retardation, were not associatedwith specific formal source items and were scored using observational evidence only. The rated items of the DRS-R98, MDAS, and CAM-S have a differing number of response categories. Rated items from the DRS-R-98 andMDAS have four response categories (not present, mild,moderate, and severe), while the rated items in the CAMhave three response categories (not present, mild, marked).To facilitate co-calibration across delirium severity instruments, for initial modeling steps, described in the analysis
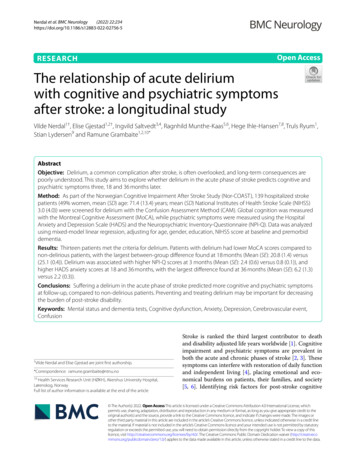
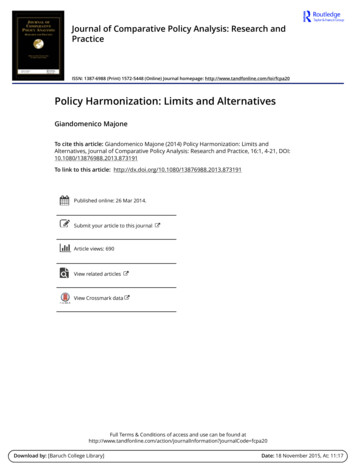
Gross et al. BMC Medical Research Methodology (2018) 18:92plan, the response categories were dichotomized to notpresent vs any symptom, except for sleep disturbance. Because most participants endorsed mild sleep disturbance,we dichotomized it as not present or mild vs moderate orsevere to identify only the more severe cases of sleep disturbance. The original polytomous items were used duringthe final scoring procedure. Items that were coded as uncertain, refused or don’t know were set to missing.Harmonization approachHarmonization is a broad term that describes a processof addressing differences in measurement or assessmentthat could involve procedural, rational, or statistical approaches [18]. Our approach was to use statisticalmethods for harmonization using item response theory(IRT) methods [14]. IRT is a latent variable techniquethat describes a large family of statistical approaches thatare used to describe the relationship between item responses (in our case, delirium sign or symptom ratings)and the latent trait presumed to underlie those responses (in our case, delirium intensity). We equate thelatent trait distributions underlying each of three delirium assessment instruments, and report links (or crosswalks) among the total scores derived from eachinstrument. We use a blended common person andcommon item design [14, 19].Seven items were shared among the three instruments,while the other items were shared among two instruments or not shared at all. Shared means that the content of the symptom was similar across instruments.The shared and unshared delirium items were associatedPage 4 of 18with varying source material, as outlined in Fig. 1. Shareditems among the three instruments included attention,disorganized thinking/thought process abnormality, orientation, perceptual disturbance, psychomotor agitation/retardation, sleep/wake cycle disturbance, and memoryimpairment. The assessment of attention involved digitspan repetition (forward and backward), sentence repetition, and days of the week and months of the year backward. Source items used to score orientation assessedorientation to year, season, month, day of the week, date,city or town, name of place, and type of place. Sleep/wakecycle disturbance was assessed using six questions relatedto sleep cycle in the past 24 h. A three-object recall wasused to evaluate memory impairment.Analysis planTo perform statistical harmonization of the instruments,we used co-calibration based on IRT in four modelingsteps.First, a unidimensional confirmatory factor analysis(CFA) model was fit to each of the three instrumentsseparately using dichotomized versions of the set ofseven shared items among the delirium instruments. Weused Mplus software (version 8, Muthén & Muthén, LosAngeles CA) and a robust maximum likelihood estimator and logit link for dichotomous items, and therebyimplement a two parameter logistic IRT model with thisCFA [20]. The goal of this step is to assess the appropriateness of a unidimensional model.In the second modeling step, another unidimensional CFA model was fit separately to each of theFig. 1 Map of instrument items, interview and rater assessments. In addition to formal interview questions, observational evidence was used torate all domains. Orientation was assessed by questions regarding orientation to time and place. Sleep was assessed with a series of 6 questionsabout sleep quality in the last 24 h. The DSI (Delirium Symptom Interview) asked seven questions about distorted perceptions over the past 24 h.* Asterisked cognitive items are from the Montreal Cognitive Assessment (MoCA [23])
Gross et al. BMC Medical Research Methodology (2018) 18:92three instruments using dichotomized versions of allthe rated items of the instrument, with the factorloading and location parameters of the shared itemsconstrained to the estimated values from the firstmodel. The goal of this step is to determine item parameters for the non-shared items while constrainingthe measurement model to conform to the unidimensional model estimated using the shared items.In a third modeling step, the items in the MDAS andthe CAM-S were linked to the DRS-R-98 using the Haebara IRT linking procedure [21]. The shared items usedto equate the MDAS to the DRS-R-98 were: disorganized thinking, orientation, perceptual disturbance,sleep/wake cycle disturbance, delusions, and memoryimpairment. The shared items used to equate theCAM-S to the DRS-R-98 were: attention, disorganizedthinking, orientation, perceptual disturbance, psychomotor agitation, sleep/wake cycle disturbance, andpsychomotor retardation. Using factor loading and location parameters from the set of common rated items inthe earlier steps causes the resulting factor scores fordelirium severity to be on the same metric for each instrument. This IRT linking procedure places the itemparameters on the same metric across the three instruments, using the shared items as anchors.In a fourth modeling step, after the dichotomous version of the items in the MDAS and CAM-S wereequated to the DRS-R-98 in the above modeling steps, aunidimensional CFA model for each delirium instrumentwas fit to the polytomous version of the items. The factor loading and the first threshold for each item wereconstrained to the equated item parameters from thethird step, and the remaining thresholds were freely estimated. This step allows us to obtain estimates for thehigher category thresholds assuming the measurementslopes and first thresholds are valid population parameters. The two-stage approach (first estimate slopes andthresholds for dichotomized items, then given these estimate thresholds for higher categories) was necessitatedto stabilize the estimates in the presence of a small number of responses in the higher categories.Once delirium severity was linked across the DRS-R-98,MDAS, and CAM-S (long form and short form), we described item characteristics for each rated item, the agreement between severity scores, test characteristic curves,and the test information or precision of each measurement model. These methods illustrate the relationshipbetween characteristics of the items and severity scores,thereby informing the complex construct of deliriumseverity as measured by the present instruments.As commonly practiced, the mean of the latent delirium severity factor from each model was set to 0 withvariance 1. The CFA models used a logit link and a maximum likelihood estimator. Models were also run usingPage 5 of 18Table 1 Baseline characteristics of the BASIL sample (N 352)CharacteristicMean (SD) or N (%)Age, years, mean (SD)80.3 (6.8)Female sex, n (%)203 (57.7)Non-white race, n (%)52 (14.8)Years of education, mean (SD)14.5 (3.0)Married, n (%)139 (39.7)Lives alone, n (%)135 (38.6)Lives in nursing home, n (%)13 (3.7)Dementia, n (%)101 (28.7)Charlson comorbidity score, mean (SD)2.2 (2.2)Surgical patient, n (%)102 (29.0)CAM delirium (ever), n (%)68 (19.3)the weighted least squares (WLSMV) estimator to obtainRoot Mean Square Error (RMSEA) and Comparative FitIndex (CFI) fit statistics [22]. RMSEAs below 0.05 andCFIs above 0.95 indicate excellent model fit. Since modelsused repeated daily delirium assessments, in factor analyses we used robust estimation procedures in Mplus toaddress the non-independence of observations resultingfrom clustering on person in the repeat assessments.ResultsStudy participants were on average 80 years old and hadmore than a high school education (mean 14.5 years ofeducation) (Table 1). The average length of a hospitalstay was 9 days (mean 8.6 / 6.4 days). The N 352participants contributed a total of 1178 daily observations to the present study. Most participants were female(59%), non-Hispanic white (85%), and currently unmarried (60%) but not living alone (62%); 29% had dementia.Descriptive statistics for the DRS-R-98, MDAS, andCAM-S are presented in Table 2. We first evaluated evidence for unidimensionality of indicators for eachinstrument. Model fit was excellent in CFA models usingcommon items among the instruments (CFI 0.97;RMSEA 0.04) (Table 3). Fit of the CFA models using allrated items were somewhat lower except for the MDASbut continued to demonstrate a moderate level of fit(CFI 0.92; RMSEA 0.09).Table 2 Descriptive statistics of the DRS-R-98, MDAS, and CAM-Sfrom all hospital interviews: Results from the BASIL study (N 1178daily observations)Delirium 0328MDAS3.93.30322CAMS - Long form2.32.40114CAMS - Short form0.71.3006Note: SD Standard deviation
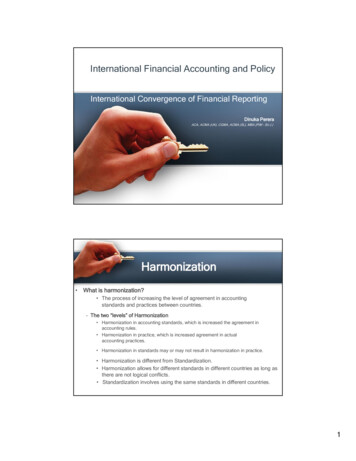
Gross et al. BMC Medical Research Methodology (2018) 18:92Page 6 of 18Table 3 Model fit statistics for unidimensional models usingdifferent item sets: Results from the BASIL study (N 1178 dailyobservations)Indicator inclusion:Shared ItemsAll ItemsDelirium MDAS0.970.040.980.02CAM-S0.990.020.900.10CFI Comparative Fit Index, RMSEA Root Mean Square Error of Approximation.Rated items that were common and unique to each instrument are shown inFig. 1. Good model fit is typically defined as CFI values greater than 0.95 andRMSEA values less than 0.05. Poor fit for all-item models signal inadequacy ofthe unidimensionality assumptionFigure 2 presents model-estimated item locationparameters for each instrument, grouped by the rateditem, along the range of delirium intensity. The distribution of delirium intensity factor scores in the sample isdenoted on the bottom of the figure by purple(DRS-R-98), pink (MDAS), and green (CAM-S). Theitem location parameters map to the level of delirium intensity. More intense items fall to the right, while lessintense items fall to the left. Using a threshold of 4 SDunits above the mean, the more intense categories ofsleep disturbance, impaired digit span, language impairment, visuospatial impairment, perceptual disturbance,delusions, and psychomotor agitation/retardation aremore likely to be seen in more severe cases of delirium.Fig. 2 Item-person map: Results from the BASIL study (N 1178 daily observations). Model-estimated item location parameters for each deliriuminstrument, grouped by rated item, are plotted along the range of delirium intensity. The distribution of delirium intensity scores in the sample isdenoted on the bottom of the figure by the purple (DRS-R-98), pink (MDAS), and green (CAM-S) frequency distributions
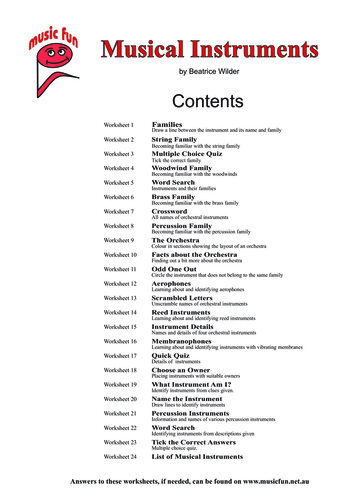
Gross et al. BMC Medical Research Methodology (2018) 18:92Page 7 of 18Fig. 3 Measurement precision contrasting different delirium intensity instruments: Results from the BASIL study (N 1178 daily observations).Measurement precision or reliability for each delirium instrument is calculated using factor loadings and thresholds from the CFA models thatincluded all rated items. The distribution of delirium intensity scores in the sample is denoted on the bottom of the figureFig. 4 Test characteristic curves for delirium severity instruments: Results from the BASIL study (N 1178 daily observations). These plots for eachdelirium instrument show the expected score a subject would have on an instrument for a given level of delirium intensity. The distribution ofdelirium intensity scores in the sample is denoted on the bottom of the figure
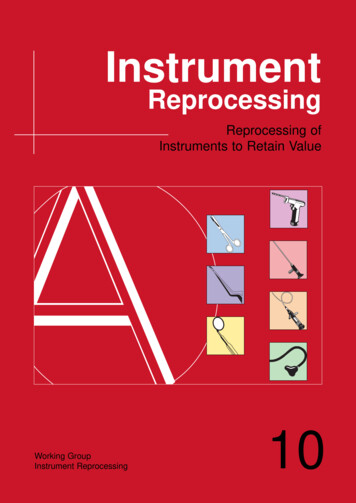
Gross et al. BMC Medical Research Methodology (2018) 18:92Figure 2 demonstrates three important points. First,across instruments sleep disturbance and cognition relate to relatively less severe delirium. Second, despite therelatively low delirium intensity in most of the sample,highlighted by the colored frequency distributions ofscores at bottom ranging between 1 and 2 standard deviation units from the sample mean, most of the itemthresholds provide information in the higher range ofthe spectrum. This indicates that even people with severe delirium have a low probability of endorsing manyitems. Rated items with minimum thresholds morePage 8 of 18intense than delirium intensity for most of the sampleinclude abnormal level of consciousness, perceptual disturbance, delusions, psychomotor agitation/retardation,and labile affect. In other words, most of the patients inthis sample did not experience these symptoms even ifthey were diagnosed with delirium. Third, Fig. 2 showsthat differences in scoring of the instruments are possible at similar levels of delirium intensity. For example,thresholds are different for perceptual disturbance acrossdelirium instruments. Although small numbers of participants at the most extreme levels of items account forFig. 5 Crosswalk plot linking the CAM-S Long Form with the DRS-R-98 and MDAS: Results from the BASIL study (N 1178 daily observations)
Gross et al. BMC Medical Research Methodology (2018) 18:92the higher thresholds, this difference across instrumentsis partly attributable to differences in the exact wordingof the questions or coding of answering choices in eachof the respective instruments. For example, CAM-S ratings are more often based on an overall determinationabout whether the delirium symptom prolonged or interfered with the interview. By contrast, the DRS-R-98and MDAS provide specific scoring instructions to rateeach item, which differ substantially in scoring, i.e., perceptual disturbances.Figure 3 presents test information functions for theDRS-R-98, MDAS, and CAM-S, calculated using factorPage 9 of 18loadings and thresholds from the CFA models that included all rated items. This provides information aboutthe measurement precision, or reliability, of the measurement models for each of the instruments. All instruments show more variability towards the edges of thedistribution. The DRS-R-98, containing more rateditems and more categories for each item than the otherinstruments, has both the widest breadth of informationand the highest information curve. Thus, it has morereliability across a wide breadth of delirium intensity.The information curve for the CAM-S long form provides reliabilities of 70% or higher over approximatelyFig. 6 Crosswalk plot linking the CAM-S Long Form with the DRS-R-98 and CAM-S Short Form: Results from the BASIL study (N 1178 daily observations)
Gross et al. BMC Medical Research Methodology (2018) 18:923.5 standard deviation units of the spectrum of delirium intensity. As expected, given less categories and items rated,the CAM-S short form provides less precision than theCAM-S long form but over a comparable range (see Additional file 1: Tables S2-S4). Precision for the MDAS isabove 70% across approximately 4 standard deviation units.Figure 4 shows test characteristic curves for the i
charge plans, or terminal condition. Of patients enrolled between October 2015 and March 2017, N 352 pa-tients had some data on each of the three delirium severity instruments for at least one day and comprise the sample for the present study. Trained lay inter-viewers assessed participants for delirium daily while