Transcription
LEGO STRATEGY ANALYSISEXAM PAPERTHE LISBON MBASTRATEGIC MANAGEMENTPEDRO ALVES, 111224th TERM - 10.DEC.2012
Exam PaperTABLE OF CONTENTSTABLE OF CONTENTS . 2Brief Company Presentation . 3Toy Industry Analysis . 3Macro Environment. 4Competitors . 4Suppliers . 5Customer Segments . 5Attractiveness. 5Structure . 6Key Success Factors. 6Organizational Analysis. 7Resources.7Strengths & Core Competencies .7Strategic Fit . 8Strategy Analysis .9Products-Markets . 9Vertical Integration. 10Internationalization . 10Organizational Development . 10Diversification . 12Custom pieces . 123D printers . 12Science kits . 12References .13Appendix . 14page 2
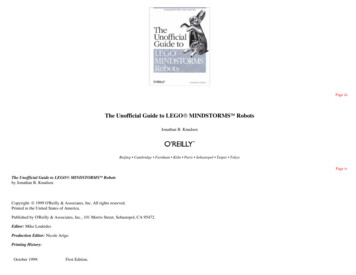
Exam Paperpage 3BRIEF COMPANY PRESENTATIONLEGO Group is a family business that started in 1932 making wooden toys in the city of Billund,Denmark. Only in 1958, Godtfred Kirk Christiansen, son of the company founder, created theLEGO brick, later praised “Toy of the Century”, by both Fortune Magazine and the BritishAssociation of Toy Retailers [1], [2].Today LEGO is the 4th largest toy manufacturer in sales volume, after Mattel, Bandai-Namco andHasbro, with a turnover of 2,511M in 2011 (originally 18,731 MDKK) and employing more than9,000 worldwide. Besides toys, the company has a diverse portfolio of products and servicesincluding games, video games, apparel and theme parks.Among its most relevant creations are the LEGO brick, the motorized trains, the minifigures,LEGO Technic, LEGO MINDSTORMS and Ninjago.FIGURE 1 – SELECT LEGOCREATIONSThe company puts a strong emphasis on building toys that enrich children’s life preparing themto be better adults and on the high quality of its products.FIGURE 2 – WORLD TOYMARKET IN RECENT YEARSTOY INDUSTRY ANALYSISThe global toy industry has been growing atCAGR of 2.9% from 2008 to 2011 (data for2011 is estimated) [3], while the globaleconomy has grown only 2.6% over the sameperiod [4], as shown in Figure 2.The industry is not equally divided neither byregion, neither by country, as one canobserve in Figure 3 (data from 2010). 100,000 80,000Sales in the toy and games industry is highlyinfluenced by the general economic situation,as it’s not a primary need item, and by theenvironment surrounding the Christmasseason, as approximately 60% of the annualpurchases are done in that time of the year. 78,100 77,200 79,6006%5.20% 60,0004.90%2%3.70%3.10% 40,000-2%-0.70% 20,000While some emerging countries areexperiencing relevant growth, such asAustralia, Brazil and China, others arereducing their market sizes, like the USA and Canada.Interestingly, a few developed countries arefacing relevant growth rates, like France,Germany and Japan, the later due to a newgame console release in 2010.10% 84,100 83,300-6% --10%20072008World Toy Market (M )200920102011Global GDP Growth [%]FIGURE 3 – TOP10MARKETS FOR TOYSShareGrowthKids Popul.[millions]Spend/Kid% 15 yrsUnited States26.3%-2.0%62.4 28419%Japan7.5%18.4%16.9 31216%China6.7%15.8%238.3 232%UK5.4%3.0%10.8 36512%France4.9%5.0%12 30710%Germany4.0%7.0%11 24719%Brazil3.9%15.0%53.3 594%Australia2.8%21.3%4 48617%India2.7%2.4%352.8 60%2.5%-6.5%5.4 31717%CountryCanadaTotal66.7%
Exam Paperpage 4MACRO ENVIRONMENTTo better understand the industry, a PEST analysis is presented below.ContextPoliticalEconomicTrendsPositive ImpactNational regulations to promotesafer toys for childrenHigh import taxes in developingeconomiesGlobal economy slow downHigh growth of middle-class inemerging countriesFIGURE 4 – PEST ANALYSISNegative ImpactBan/taxes in product importsfrom other regionsCosts increaseNeed to produce locallyNew middle-class families withshare of wallet for toysMarket decrease in developedcountriesSocio-CulturalLeverage on company cultureCosts increasePressure to use environmentfriendly toysPressure to use educational toys Perfect for LEGO toysCompetition from gamesDigitally educated childrenOpportunity to sell LEGO gamesTechnologicalInternet availabilitySmart mobile devices usageNew 3D printing technologyBe close to consumerOpportunity to create newmarket spaceDifficult to protect intellectualpropertyCOMPETITORSLEGO ranks number 3 in sales revenues among its direct competitors on toy manufacturing. InFigure 5 a simple description of the Top5 toy manufacturers is presented (data from 2011).CompanySalesEmployeesOI/Assets(2)CountryCore BrandsUSABarbie, Polly Pocket, Hot Wheels,Matchbox, Speed Racer, Power WheelsDisney Classics, High School Musical,CARS, Batman, Fisher-Price, Little People,BabyGear, View-Master, Sesame Street,Dora the Explorer, Go-Diego-Go!, MickeyMouse, Winnie the Pooh, Handy MannyMattel6,266M 28,00018.4%Bandai-Namco5.53M 7,01310.1%JPHasbroLegoTomy-TakaraFIGURE 5 – MAINCOMPETITORSGundam, PRETTY CURE!, POWERRANGERS, Tamagotchi, BabyLabo, Little Battle eXperience, Games,Arcade machines, Movies, Amusementstores and parks4.29M 5,90014.4%USAPlayskool, Transformers, My Little Pony,Littlest Pet Shop, Tonka, GI Joe, SuperSoaker, Milton Bradley, Parker Brothers,Tiger, Wizards of the Coast3.56M (1)9,37443.9%DKLEGO toys, games, video games, apparel,amusement parksTomica, Plarail, Licca-chan, Koeda-chan,Licensee of Transformers, Disney andother brandsNotes: (1) Converted at a 0.19 rate – average for 2011; (2) Operating Income /Total Assets2.42M 2,2947.8%JP
Exam Paperpage 5From these indicators one can conclude that LEGO is quite a profitable business, when comparedwith its direct competitors.Besides the traditional competitors, the company should also consider the producers of gameconsoles, such as Microsoft, Nintendo and Sony, and the producers of on-line and for mobilegames, such as Zynga, Rovio and ValvE, which are competing for the share of wallet and timespent playing.SUPPLIERSSuppliers don’t have much bargain power, as the plastic molding and injection technologiesbecame wide spread and tend to be treated as commodities. The differentiation is the quality ofmaterials and finishing, again commoditized attributes.CUSTOMER SEGMENTSBased on data analysis made by the Toy Industry Association demand of toys is driven by thegrowth in the population of children age 12 and younger, where children age 5 and under areresponsible for about half of retail toy sales. From the Entertainment Software Association itwas possible to find that the reported average age of a video game buyer is 35 years old.For the analysis, market is therefore divided into 4 segments, as shown in Figure 6.SegmentWhoWhatPre-TeenTeenagersAdultsParents, FamilyParents, FamilyParents, Family,himself/herselfHimself, herselfDolls, Figures,Plush, ActionFiguresActivity,Construction,Electronic Toys,Vehicles, Games,PuzzlesOutdoor, Sports,Video GameVideo Game,Electronic Toys 5 yrs6-12 yrs13-18 yrs 18 yrsWhomWhenWhereFIGURE 6 – MARKETSEGMENTSPre-SchoolSpecial occasions, Christmas seasonSpecialized stores,hypermarketSpecialized stores,hypermarketAnytimeSpecialized storesSpecialized stores,hypermarket, onlineATTRACTIVENESSThe following table summarizes the market segments attractiveness, where the margin wascalculated based on Porter’s 5 Forces model (in Appendix).SegmentPre-SchoolPre-TeenTeenagersValue [5] [3] [3]Growth [5] [4] [3] [3]Margin [3.6] [3.5] [3.6] [4.0][3][2][3]RiskAttractiveness4.153.133.15Adults [2][4]3.25FIGURE 7 –ATTRACTIVENESS
Exam Paperpage 6The most attractive segment is that from pre-schoolers, because of the high value and highgrowth especially in emerging economies.STRUCTUREDue to its nature, to the chosen market segmentation, to introduction of electronics in toys andto rise of video games, this industry might not follow exactly the typical pattern of the industrycycle.However, with the data available, each segment is plotted regarding its life cycle current statusin Figure 8.Pre-teenINDUSTRYSALESFIGURE 8 – INDUSTRY THMATURITYDECLINETIMEKEY SUCCESS FACTORSAs said before, because toys are not primary need goods, their demand depends on personalincome availability. On the other hand, it’s most of the times a gift for children, and therefore apurchase decision made with strong personal emotions.Innovation is key, being this one of the most dynamic markets segments in the retail business,with the majority of sales concentrated in few weeks at the end of the year. Moreover, becausethe target consumer gets naturally older, a toy provider may miss a sale for their entire life andFIGURE 9 – KEY SUCCESSmarketing plays a very important tsKey BuyingFactorsQualitySafety ReputationCertificationsVisual aspect,Stimulation capabilityConsumer trendsLearning capabilitiesAppearanceConsumer trendsChallengeConnect with friendsLongevity of toy, gameConnect with dvertisingConnection w/ devicesPlatform ail AvailabilityBrandInnovationCollectiblesRetail AvailabilityBrandInnovationUpgradeabilityRange of accessoriesRetail AvailabilityBrandProduct evolutionQualityKey SuccessFactors
Exam Paperpage 7ORGANIZATIONAL ANALYSISGiven the information from the LEGO case study [5] and broad information available on-line, inthis section the core competencies are analyzed from the identified resources, and selectedthose that constitute core competencies.FIGURE 10 – LEGORESOURCESRESOURCESPotential for arge installed production facilitiesBrand nameInnovationIntangibleFocus on high quality standardsRaw materials knowledge (resins)Product design creativityManagement organization and leadershipOrganizationalInvolvement of operational teams in turnaroundEfficient supply chainSTRENGTHS & CORE COMPETENCIESTo determine the major strengths and core competencies, the resources were evaluatedalongside LEGO competitors to identify its advantages. The results are summarized in Figure 11.strengthsLarge installed productionfacilitiesBrand nameInnovationFocus on high qualitystandardsRaw materials knowledge(resins)Product design creativityManagement organizationand leadershipEfficient supply chainvalue tocustomerdifferentiationfrom competitionFIGURE 11 – LEGOSTRENGTHS AND CORECOMPETENCIESexpandable tonew marketscorecompetency
Exam Paperpage 8STRATEGIC FITTo understand the strategic fit of each market segment Figure 12 is presented scoring eachLEGO core competence with the specific segment Key Success Factors.Segments etailAvailabilityBrand43Upgradeability443.86Range ofaccessories34RetailAvailabilityBra
LEGO brick, later praised “Toy of the Century”, by both Fortune Magazine and the British Association of Toy Retailers [1], [2]. Today LEGO is the 4th largest toy manufacturer in sales volume, after Mattel, Bandai-Namco and Hasbro, with a turnover of 2,511M in 2011 (originally 18,731 MDKK) and employing more than 9,000 worldwide. Besides toys, the company has a diverse portfolio of products File Size: 1MBAuthor: Lisbon, Pedro AlvesPage Count: 14Publish Year: 2012