Transcription
ATMOS Research & ConsultingANNE STONER and KATHARINE HAYHOEClimate Impact Assessmentfor the City of HoustonAUGUST 2020Image sources: Houston Chronicle, flooding during Hurricane Harvey (left), Jose Velasquez/EyeEm/Getty Images (right)
Houston’s Climate Future 2Table of ContentsLIST OF FIGURES .3ACRONYMS AND ABBREVIATIONS .4PREFACE .5ABOUT THIS ASSESSMENT .6EXECUTIVE SUMMARY .7INTRODUCTION .9ONE. GLOBAL CLIMATE CHANGE: PAST, PRESENT AND FUTURE.9TWO. OBSERVED CHANGES IN THE U.S. AND GULF COAST . 12THREE. PROJECTED FUTURE CHANGES IN THE U.S. AND GULF COAST REGION . 17CLIMATE TRENDS AND PROJECTIONS . 21ONE. PROJECTED CHANGES IN AVERAGE TEMPERATURE, THE LENGTH OF SUMMER, AND HEATING AND COOLINGDEGREE-DAYS. 21TWO. CHANGES IN EXTREME TEMPERATURES . 31THREE. CHANGES IN ANNUAL AND SEASONAL PRECIPITATION AND DRY DAYS . 37FOUR. CHANGES IN EXTREME PRECIPITATION . 42FIVE. REGIONAL VARIABILITY . 46SIX. CONCLUSIONS AND SUMMARY . 48DATA, MODELS, AND METHODS . 52ONE. OBSERVED DATA . 52TWO. CLIMATE INDICATORS . 52THREE. FUTURE SCENARIOS . 54FOUR. GLOBAL CLIMATE MODELS AND EMPIRICAL-STATISTICAL DOWNSCALING . 55FIVE. SOURCES OF UNCERTAINTY IN FUTURE PROJECTIONS . 58PRODUCTS. 61ONE. DAILY STATION-BASED CLIMATE PROJECTIONS - DATA . 61TWO. ANNUAL STATION-BASED CLIMATE INDICATORS - DATA. 61THREE. MULTI-MODEL MEAN AND RANGES OF STATION-BASED CLIMATE INDICATORS FOR THE HIGHER AND LOWERFUTURE SCENARIOS – DATA AND TIME SERIES PLOTS . 61APPENDICES . 64APPENDIX A: CLIMATE INDICATOR TIME SERIES FOR WEATHER STATIONS . 64APPENDIX B: CLIMATE INDICATOR BAR CHARTS FOR WEATHER STATIONS . 64APPENDIX C: CLIMATE INDICATOR BAR CHARTS FOR WEATHER STATIONS – RETURN FREQUENCY OF THE 24-HOUR100-YEAR PRECIPITATION EVENT . 64REFERENCES . 65
Houston’s Climate Future 3List of FiguresFigure 1 Human and natural factors influencing Earth’s climate . 11Figure 2 Historical billion dollar weather and climate disasters . 12Figure 3 Observed changes in US annual, winter, and summer temperature . 14Figure 4 Observed changes in US annual and seasonal precipitation . 15Figure 5 Observed local relative sea level trends . 16Figure 6 Projected changes in US annual average temperatures . 17Figure 7 Projected change in total seasonal precipitation . 18Figure 8 Projected sea level in the Houston area under 4 C (7.2 F) and 2 C (3.6 F) of globalwarming . 20Figure 9 Projections in the timing of the first day, the last day, and the length of summer(time series) . 25Figure 10 Projections in the timing of the first day, the last day, and the length of summer(bar charts) . 26Figure 11 Projections in cooling degree days (time series) . 27Figure 12 Projections in cooling degree days (bar charts) . 28Figure 13 Projections in heating degree days (time series) . 29Figure 14 Projections in heating degree days (bar charts) . 30Figure 15 Projections in days above 100 F and nights above 80 F (time series) . 33Figure 16 Projections in days above 100 F and nights above 80 F (bar charts) . 34Figure 17 Projections in temperature of the hottest day and week, and length of the longestheatwave (time series). 35Figure 18 Projections in temperature of the hottest day and week, and length of the longestheatwave (bar charts) . 36Figure 19 Projections in annual precipitation and number of dry days (time series) . 38Figure 20 Projections in annual precipitation and number of dry days (bar charts). 39Figure 21 Projections in seasonal precipitation (time series) . 40Figure 22 Projections in seasonal precipitation (bar charts) . 41Figure 23 Projections in the wettest 3-day precipitation amounts and the number of eventsper year above 4 inches (time series) . 44Figure 24 Projections in the wettest 3-day precipitation amounts and the number of eventsper year above 4 inches (bar charts) . 45Figure 25 Projections in the 12-month SPEI drought index . 46Figure 26 Map of the 11 weather stations . 53Figure 27 Historical and future carbon emissions . 55Figure 28 Downscaling: importance of spatial scale. 57Figure 29 Projected changes in four different climate indicators . 63
Houston’s Climate Future 4Acronyms and AbbreviationsCDDs:Cooling Degree-DaysCMIP5:The Coupled Model Intercomparison Project version 5GCM:Global Climate ModelGHCN:Global Historical Climatology NetworkHDDs:Heating Degree-DaysIPCC:Intergovernmental Panel on Climate ChangeNCA4:Fourth U.S. National Climate AssessmentNOAA:National Oceanic and Atmospheric AdministrationRCP4.5:RCP8.5:Representative Concentration Pathway 4.5 is a lower scenario where humancaused increases in radiative forcing reach 4.5 W/m2 by the year 2100Representative Concentration Pathway 8.5 is a higher scenario wherehuman-caused increases in radiative forcing reach 8.5 W/m2 by the year2100SPEI:Standardized Precipitation-Evapotranspiration IndexWMO:World Meteorological Organization
Houston’s Climate Future 5PrefaceHouston’s Climate Impact Assessment was a collaboration between the City’s ChiefResilience Officer and Chief Sustainability Officer and was made possible through generousfunding from C40 Cities, a network of the world’s megacities committed to addressingclimate change. The Climate Impact Assessment was identified in 2019 by both teams as acritical component to creating a safer, more resilient and sustainable Houston. ThisAssessment further links the City’s first resilience strategy, Resilient Houston, released inFebruary 2020 and the City’s first climate action plan, Houston Climate Action Plan, releasedon the 50th Earth Day in April 2020. The climate science and data within will help inform,guide, and prioritize the implementation of both plans and engage Houstonians in climatemitigation and adaptation education and action.
Houston’s Climate Future 6About This AssessmentGlobal climate is changing due to human activities and at a rate unprecedented in moderntimes. These changes have important and, in some cases, unique implications for humansystems and society. “Human society is built on the implicit assumption that climate is largelystationary: that historical records can be used with confidence to determine the energy loadsof our buildings, the hundred-year floodplains of our cities, and the growing zones for thecrops that power our economy and feed our world. What happens when that assumption isno longer valid?” ask Hayhoe and Kopp (2016).In 2020, the City of Houston released its first Resilient Houston strategy and Houston’sClimate Action Plan. Together, these form a framework for the city to adapt to and mitigateclimate change. As called for in Resilient Houston, this Climate Impact Assessment is anecessary next step for better understanding the heat, drought, and precipitation risksassociated with climate change as well as the clear need to reduce and capture emissions ofcarbon dioxide, methane, and other heat-trapping gasses through energy transition,transportation, building optimization and materials management.This assessment quantifies how climate is changing across the U.S., the Gulf Coast region, andfor Houston in particular. It summarizes observed and projected changes in temperature andprecipitation for 11 long-term weather stations across the greater Houston area, and translatesthese into 25 different climate indicators, from the temperature of the hottest day of the yearto projected changes in heavy precipitation. This information will be used by the City andpartners in the next phases of the Climate Impact work, including: Implementation of Resilient Houston focused on a healthy place to live, and equitable,inclusive and affordable city, a leader in climate adaptation, a city that grows up, notout, and a transformational economy that builds forward. Using this Climate ImpactAssessment to inform City policies and programs is specifically called for by Action32.Implementation of Houston’s Climate Action Plan focused on transportation, energytransition, building optimization, and materials management.
Houston’s Climate Future 7Executive SummaryHouston’s climate is already changing and many of the observed changes are projected tocontinue and even accelerate over the rest of this century. This report summarizes observedand projected changes in temperature and precipitation for 11 weather stations across thegreater Houston area from 1950 through 2100. Temperature and precipitation projectionsare shown for a lower and higher future scenario that encompass a range of likely futuresas a result of human choices and resulting greenhouse gas emissions.Since 1950, the city of Houston has experienced significant increases in annual averagetemperature, in the number of hot days with temperature above 100 F, in the number ofwarm nights with temperature above 80 F, and in cooling degree-days, a measure of airconditioning needs. In addition, summer now begins earlier and ends later in the year.Over the rest of this century, projected future changes for Houston include: Increases in the average temperature of all seasons Lengthening of summer, with summer beginning earlier and ending later Increases in energy demand for cooling buildings for the spring, summer, and fallseasons Increases in the number of hot days per year (defined here as maximum temperatureabove 100 F) and the number of warm nights per year (defined here as minimumtemperature above 80 F) Increases in the temperature of the hottest days experienced each year Longer multi-day heatwaves Little change in total annual precipitation but a decrease in summer precipitation andincrease in fall precipitation Greater variability in day-to-day precipitation that includes both slight increases innumber of dry days and increasing risk of drought due to soil moisture decreasesresulting from higher temperatures, as well as increases in the precipitation fallingduring extreme precipitation events such as the wettest three-day period each year.Projected changes have important implications for future planning with respect toHouston’s infrastructure, its energy and water resources, its public services, and the healthand welfare of its inhabitants. For both temperature and precipitation, the changes reportedhere are consistent with those projected to occur throughout the Gulf Coast region inresponse to human-induced climate change. The projections are appropriate for use inscientific analyses to quantify the impacts of climate change on both human and naturalsystems across the region, and to inform long-term planning, education, and outreachregarding climate adaptation and resilience in the region.This assessment does not analyze observed or projected changes in hurricanes, coastalstorms, or sea level. Instead, it provides a brief summary based on the scientific literatureand the Fourth U.S. National Climate Assessment (NCA4) Volume 1 and Volume 2.
Houston’s Climate Future 8Assessment OutlineThe Introduction to this report introduces the topic of climate change and its causes, bothhuman and natural. It describes historical extreme weather events that have impactedHouston and the attribution of extreme events to human-induced climate change. It concludesby summarizing findings from NCA4 and from the scientific literature on observed andprojected changes in temperature, precipitation, hurricanes and sea level across the U.S. andthe Gulf Coast region in general.The Climate Trends and Projections section focuses in on the city of Houston, analyzinghistorical and projected temperature and precipitation trends in 25 different climateindicators, from the temperature of the hottest day of the year to projected changes in heavyprecipitation, at 11 long-term weather stations across the greater Houston area. Historicaltrends are based on daily observations collected at these weather stations. Future projectionsare based on simulations from an ensemble of global climate models (GCMs) from theCoupled Model Intercomparison Project version 5 (CMIP5). Future projections are based ontwo different scenarios: the lower Representative Concentration Pathway (RCP) scenarioRCP4.5 and the higher RCP8.5. The lower RCP4.5 scenario represents a future where themajority of the world follows the stated goal of the city of Houston to meet its ParisAgreement targets, transitioning to clean energy sources and reducing carbon emissions. Incontrast, the higher RCP8.5 scenario represents a future where fossil fuel use and carbonemissions continue to increase through the end of the century, tracking historical trends todate. Global climate model output for each scenario statistically downscaled to each of 11Houston weather stations is compared to observations for two historical periods (1971-1990,2001-2020) and used to calculate projected values for three future 20-year periods (20212040, 2051-2070, 2081-2100).The Data, Models and Methods section describes the observational data used, how the climateindicators were defined, how historical trends were calculated, and how the future projectionswere generated. It also describes the global climate models, scenarios, and empirical-statisticaldownscaling models used. It concludes by discussing the sources of uncertainty in futureprojections and how these were addressed in this report.The Products section describes the outputs that are available for use in scientific analyses,impact modeling, long-term planning, education, and outreach. They include data files, barcharts, and time series.The Appendices contain figures and data for all of the 11 stations included in the study.Sample figures are included in this report to illustrate projected changes for a single weatherstation (Houston Hobby Airport). The complete set of observed and projected future indicatorvalues for individual weather stations by year is available in PDF format in Appendix A: ClimateIndicator Time Series for Weather Stations, the complete set of bar charts of observed andprojected future indicator values is available in PDF format in Appendix B: Climate IndicatorBar Charts for Weather Stations, and a complete set of bar charts of the 24-hour 100-yearprecipitation events showing projections for individual global climate models is available inPDF format in Appendix C: Climate Indicator Bar Charts for Weather Stations – ReturnFrequency of the 24-hour 100-year Precipitation Event.
Houston’s Climate Future 9IntroductionONE. Global Climate Change: Past, Present and FutureClimate is changing. Since 1900, global mean temperature has increased by about 1.8 F (1 C)and global mean sea level has risen by about 7-8 inches (16-21 cm; Hayhoe et al. 2018). Inaddition, sea ice in the Arctic is decreasing, ice loss from Greenland and Antarctica isaccelerating, permafrost is thawing, and heavy rainfall and extreme heat is becoming morefrequent in many locations (Hartmann et al. 2013; Knutson et al. 2017; Vose et al. 2017;Easterling et al. 2017; Sweet et al. 2017; Taylor et al. 2017). The Fourth U.S. National ClimateAssessment (NCA4) describes these and other observed changes that are occurring across theGulf Coast region, North America and the world.This change is unprecedented in the history of modern civilization. Over the last twothousand years, climate changed relatively little at the global scale. Relative to the long-termaverage, global temperature varied by less than 0.9 F ( 0.5 C; Masson-Delmotte et al. 2013).As a result, many human systems, including infrastructure, agriculture, and the allocationand use of natural resources, are based on the assumption of a relatively stable climate. Inother words, it is assumed that past conditions experienced over long-term, climatic timescales provide a reliable guide for planning for the future. This assumption underlies buildingcodes, urban plans, infrastructure design and maintenance, agricultural methods, long-termwater plans, flood zone delineation, and more.Today, however, the global climate is changing at a rate that is unprecedented over the historyof human civilization. NCA4 concludes, “global climate continues to change rapidly comparedto the pace of the natural variations in climate that have occurred throughout Earth’s history,”and “global annual averaged temperatures for 1986–2015 are likely much higher, and appearto have risen at a more rapid rate during the last 3 decades, than any similar period possiblyover the past 2,000 years or longer” (Wuebbles et al. 2017).Climate is defined as the statistics of weatheraveraged over a relatively long period of time.The World Meteorological Organization (WMO)uses a 30-year period to define climate normals,“reference points used by climatologists tocompare current climatological trends to that ofthe past or what is considered 'normal'.” Thirtyyears is typically used for historical trendsbecause this period has historically been “longenough to filter out any interannual variation oranomalies, but also short enough to be able toshow longer climatic trends." (WMO, 2014) Thisreport uses climatic periods of 20 years, ashorter period better able to capture thechanges in climate that are occurring while stillaveraging over a period sufficient to encompassa broad range of natural variability.Although a 1.8 F increase in the global meantemperature may not sound significant, thischange has already increased the magnitudeand/or the frequency of many different typesof extreme events (Hayhoe et al. 2018); it isdriving the migration or invasion of plantsand animals into areas they did not inhabitpreviously (Lipton et al. 2018); and it isaffecting many aspects of human society,from water and energy resources to foodproduction to the integrity of infrastructureand public services (Gowda et al. 2018; Lall etal. 2018; Maxwell et al. 2018; Zamuda et al.2018). If observed and future changes are notaccounted for in future planning, manyhuman and natural systems may becomestressed or even fail.
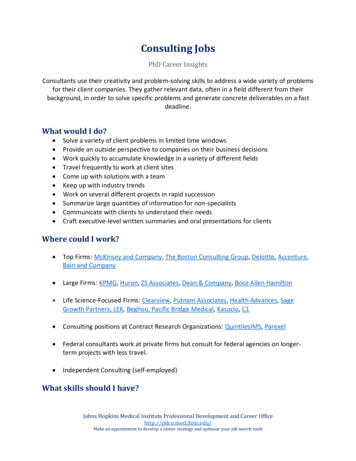
Houston’s Climate Future 10Humans are responsible. Climate has historically varied due to natural causes including theinternal variability of the climate system and changes in solar output, orbital cycles, volcaniceruptions and other geologic activity. Natural factors still influence climate today. However,as can be clearly seen in Figure 1, human emissions of greenhouse gases from combustion offossil fuels and land use change now overwhelm their influence on Earth's climate.In reference to observed warming since 1900, NCA4 concludes, “there are no convincingalternative explanations [other than human agency] supported by the extent of theobservational evidence” (Wuebbles et al. 2017) and expands on this, stating, “observationalevidence does not support any credible natural explanations for this amount of warming;instead, the evidence consistently points to human activities, especially emissions ofgreenhouse or heat-trapping gases, as the dominant cause” (Hayhoe et al. 2018).Regarding natural factors, NCA4 states: “We find no convincing evidence that naturalvariability can account for the amount of global warming observed over the industrial era.Solar output changes and internal variability can only contribute marginally to the observedchanges in climate over the last century, and we find no convincing evidence for natural cyclesin the observational record that could explain the observed changes in climate” (Wuebbles etal. 2017). Instead, the dominant factor causing climate to change today is human activities,specifically human emissions of carbon dioxide and other heat-trapping gases releasedduring fossil fuel combustion, deforestation, agriculture and other activities.Human choices will determine how much more climate changes. Some additional amountof future change is inevitable, due to human choices that have already been made and humanemissions that have already occurred. This is the result of two different types of lags. Thefirst lag is in the physical climate system, in responding to human emissions of heat-trappingthat have already occurred. This is analogous to the lag in the response of the human bodyto, for example, poor lifestyle choices such as diet or smoking. The second lag is in the energysector, in transitioning from traditional fossil-based energy to low or zero-carbon energy.Although policies may be put in place near-term, it takes some time for the infrastructureand for heat-trapping gases to be altered in response.A significant amount of future change, however, can be avoided by reducing and eventuallyeliminating carbon emissions from human activities, compared to continuing to rely on fossilfuels. NCA4 emphasizes the importance of human choices in determining the magnitude offuture change, stating, “beyond the next few decades, the magnitude of climate changedepends primarily on cumulative emissions of greenhouse gases and aerosols and thesensitivity of the climate system to those emissions (high confidence).” (Hayhoe et al. 2017)It is estimated that, “with significant reductions in emissions, global temperature increasecould be limited to 2 C [3.6 F] or less compared to preindustrial temperatures [but] withoutsignificant reductions, annual average temperatures could increase by 5 C [9 F] or more bythe end of this century compared to preindustrial temperatures.” (Hayhoe et al. 2018)Our future is in our hands. This report tracks observed changes in the greater Houston areathat are consistent with those occurring at the regional, state, and national scale. It alsosummarizes projections corresponding to a higher and a lower possible future, depending onthe choices the world makes. This information can be used to prepare for or adapt to futurechange, as well as to quantify the benefits of policies like the City of Houston’s Climate ActionPlan to reduce heat-trapping gas emissions and avert future impacts. More information onthe future scenarios used in this report, which are also used in the Fourth U.S. NationalClimate Assessment, and the Intergovernmental Panel on Climate Change’s Fourth and FifthAssessment Reports, is provided in the Data, Models, and Methods section.
Houston’s Climate Future 11Figure 1 Both human and natural factors influence Earth’s climate, but the long-term global warming trend observedover the past century can only be explained by the effect that human activities have had on the climate.(a) The temperature changes simulated by a climate model when only natural factors (yellow) are considered. The otherlines show the individual contributions to the overall effect from observed changes in Earth’s orbit (brown), the amountof incoming energy from the sun (purple), and changes in emissions from volcanic eruptions (green). Note that no longterm trend in globally averaged surface temperature over this time period would be expected from natural factors alone.(b) The simulated changes in global temperature when considering only human influences (dark red), including thecontributions from emissions of greenhouse gases (purple) and small particles (referred to as aerosols, brown) as well aschanges in ozone levels (orange) and changes in land cover, including deforestation (green). Changes in aerosols andland cover have had a net cooling effect in recent decades, while changes in near-surface ozone levels have had a smallwarming effect. These smaller effects are dominated by the large warming influence of greenhouse gases such as carbondioxide and methane. Note that the net effect of human factors (dark red line) explains most of the long-term warmingtrend. (c) The temperature change (orange) simulated by a climate model when both human and natural influences areincluded. The result matches the observed temperature record closely, particularly since 1950, making the dominantrole of human drivers plainly visible. Researchers do not expect climate models to exactly reproduce the specific timingof actual weather events or short-term climate variations, but they do expect the models to capture how the whole climatesystem behaves over long periods of time. The simulated temperature lines represent the average values from a largenumber of simulation runs. The orange hatching represents uncertainty bands based on those simulations. For any givenyear, 95% of th
critical component to creating a safer, more resilient and sustainable Houston. This Assessment further links the City's first resilience strategy, Resilient Houston, released in February 2020 and the City's first climate action plan, Houston Climate Action Plan, released on the 50th Earth Day in April 2020. The climate science and data .