Transcription
WSEAS TRANSACTIONS on COMPUTERSMiroslav Voznak, Jan RozhonMethodology for SIP Infrastructure Performance TestingMiroslav Voznak, Jan RozhonDepartment of TelecommunicationsVSB – Technical University of Ostrava17. listopadu 15, OstravaCzech Republicmiroslav.voznak@vsb.cz, jan.rozhon@vsb.czAbstract: - This paper deals with a testing method suitable for SIP infrastructure. The performance testing is an issue ofresearch and no standardized methodology has been adopted yet. We present the main ideas of the methodology thatallows for testing the keystone of SIP based infrastructure – the SIP Server – in both SIP Proxy and B2BUA (Back toBack User Agent) configurations. Our methodology has its foundations in the work of the IT Company Transnexus andthese foundations have been enhanced with the ideas reflecting the nature of the SIP protocol. In addition, the entirelynew methodology for benchmarking the SIP server in the B2BUA configuration has been introduced. This methodutilizes one of the attributes of the B2BUA – the flow of media passing through the B2BUA – and measures theeffectiveness of codec translation, which relates to the performance measured in cases without codec translation. Ourapproach offers the complex method for testing SIP infrastructure, which has been verified experimentally. The outcoming results are the part of this paper together with appropriate comments and conclusions.Key-Words: - Asterisk; B2BUA; codec translation; Opensips; Performance testing; SIP Proxy1 Introduction2 State of the artThe whole topic of SIP infrastructure performancetesting is under development and there are no unifiedrecommendations as how to perform the tests and whatto pay attention to. Moreover, the proprietary solutionsoffer huge comprehensibility of testing scenarios butthey do not use generally recognized means and ways toperform the testing, so the results may not becompatible. Many issues in this area have been solvedby Transnexus. Their white papers [1] and generalapproach to the testing has significantly inspired ourresearch because it is based on open source solutions andallows us to integrate basic thoughts mentioned in theIETF draft [2]. This RFC draft focuses on methodologyfor benchmarking SIP environment. Considering thisinformation, it is obvious that there is a big gap in thearea of SIP infrastructure performance testing andbenchmarking. This gap and its elimination is the mainmotivation for our research. Simple SIP infrastructureperformance testing configured in both B2BUA and SIPProxy modes and the examples of the output results arethe main contribution of this paper.In this paper the current state of development of theSIP infrastructure performance testing will be described.In addition, new methodology for SIP benchmarkingwill be presented and verified experimentally. Theresults obtained in the experiment will then be analyzedand commented. From this output of our paper theoptimal and maximal load of the SIP server can bedetermined, which is useful mainly in small and mediumbusiness VoIP installations.As mentioned in the introduction, there are someproprietary solutions for SIP testing, the main advantageof which is a huge comprehensibility of testingscenarios. However, in the real world, there are alsodisadvantages, such as high price and possibleincompatibility of the results, as each company focuseson a different main area of interest. On the other hand,the IETF has published several drafts which have themethodology and the metrics of SIP infrastructuretesting as their main topic of concern, see [2], [3] and[4]. These drafts try to define the basic terms for SIPbenchmarking as well as the times, the measuring ofwhich is important to gain the relevant results. Given theearly stage of development of these drafts, there are nosoftware or hardware means for SIP benchmarking thatwould utilize these drafts yet. Halfway to creating asuitable and generally applicable testing method is theTransnexus’ SIP benchmarking model which can serveas an inspiration [1], [5]. This company created a usefulSIP infrastructure testing method using an open sourcetraffic generator SIPp. In order to develop a methodwhich would reflect the main thoughts of the IETF draftsit is useful to modify the Transnexus’ procedure to betterreflect the nature of SIP protocol from the SIPtransactions and dialogs point of view and the resultswill be sufficient to determine the effectiveness of asystem, the highest load which it can handle as well asthe dynamically changing characteristics of a system,which is crucial for assessing whether the SIP server canbe operated in given environments.ISSN: 1109-27501012Issue 9, Volume 9, September 2010
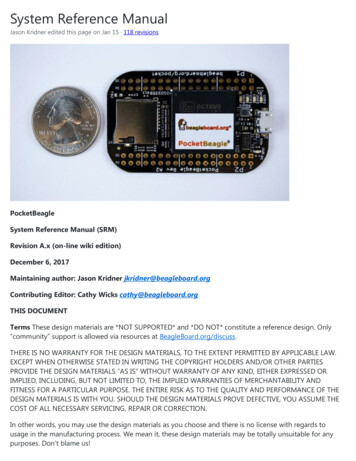
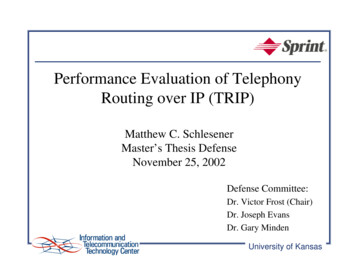
WSEAS TRANSACTIONS on COMPUTERSMiroslav Voznak, Jan Rozhon3 MethodologyAlthough Transnexus’ benchmarking model served as aninspiration in the early phase of the development of ourmethodology it lacks the effort for standardization. Theymeasure times between transmission and reception ofsome key messages (e.g. Invite, 100 Trying, 180Ringing), however their approach does not look at thesemessages as the part of the SIP transaction. This resultsin outputs from which the user is unable to read morecomplex attributes of the system. To be more specific,you can learn how quickly the SIP server is able torespond to your message, but you cannot learn howquickly it can process it and resend it to the destination.Our approach on the other hand makes this possible, so itis not the issue to recognize the “real world” parametersof the SIP server such as Call Setup Length (laterdescribed as SRD).From the practical point of view Transnexus’ modelis rather too complex. As the commercial subject,Transnexus has focused on creating the model thatwould utilize some of their commercial products, whichled them to use their management and billing platform,which required two more separate computers. Moreover,the testing scenarios they created utilize several differentend locations for the simulation of call rejection, noroute issue, no device problem and so on. This againincreases the complexity of the test platform due to theneed of more physical machines. From mentioned it isclear that this model is unsuitable for practice. From ourpoint of view it is beneficial to create the testingplatform that would be as simple as possible, whichwould make it easier to deploy in any practicalenvironment. This is why we decided not to use anyother special hardware and to simulate the end locationfor calls just by the listening UASs, which is madepossible by the fact that we want to evaluate the abilityof the SIP server to successfully connect calling andcalled party.In order to perform SIP testing, we simulate bothends of the SIP dialogue to test the main part of the SIPinfrastructure, the SIP server. The SIP server representsa set of servers always involving SIP Registrar and SIPProxy or B2BUA (Back to Back User Agent). The latteris the most used solution in enterprise environment, forboth SMEs (Small and Medium sized Enterprise) andLEs (Large Enterprise). Fig. 1 depicts test hardwareconfiguration for testing the SIP Proxy and B2BUA.This is a general configuration which does not reflect allthe aspects of test platform used for our measurements.Firstly, we used both physical and virtual computers tosimulate SIP traffic. The results with both configurationswere almost identical allowing future user of thismethodology to decide for topology that would be bestfor him according to available hardware.ISSN: 1109-2750Fig. 1. Test Bed Diagram for B2BUA and SIP ProxyConfiguration.The only condition required for testing SIP serversuccessfully and comparably is the interconnectingdevice (or system). Basically, this can be any device ornetwork capable of routing of SIP messages among SIPtraffic generators, SIP server and SIP traffic recipients,but to make the results of measurements comparablewith those taken in different network, we would berequired to use the exact same topology, which may bethe issue. This is why it is advantageous to use as simpletopology as possible to reduce additional costs and workcaused by the need of some special topology. So, themost flexible variant is to use the single switch, which isundoubtedly a commonplace in all modern SIPinstallations.Secondly, the number of devices used for the testingmay vary due to the performance of the SIP server. Themore the SIP server is efficient the more devices areneeded to test its performance especially on the UACside. Due to the software limitations of the SIP trafficgenerator (SIPp) one computer in UAC mode is capableof creating 200 simultaneous calls with media (fortesting B2BUA) and about 220 calls per second withoutmedia (for testing SIP Proxy) no matter what the1013Issue 9, Volume 9, September 2010
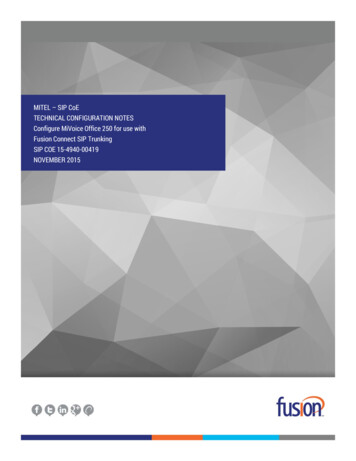
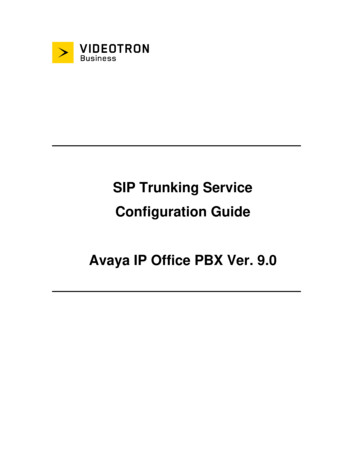
WSEAS TRANSACTIONS on COMPUTERSMiroslav Voznak, Jan Rozhonhardware configuration of the PC running SIPp instanceis. Therefore we need to estimate the SIP serverperformance to determine the number of computers(physical or virtual) needed for test, which makes thevirtualization the more viable option. Number of UASsis not affected by the SIP server’s performance thatmuch, however it is necessary to force the SIP server todecide between different paths to UAS, therefore therehave to be at least two computers in UAS mode in thetest topology.As well as the topology the test scenario should be assimple as possible mainly to reduce the complexity ofthe test and except of that also because it is not possibleto test the SIP Proxy (and B2BUA as well) in all thepossible configurations. Thus it is useful to focus onbasic default configuration and perform the tests with it.The output results then carry the information about the“best case scenario” according to which we can decideabout the SIP server’s performance and compare it withits rivals.category of the measured parameters. This definitionmust come out from the features of the SIP protocol andgenerally recognized convention from IP and classictelephony.A. Measured parametersAs mentioned in the Introduction we use the parametersdefined in IETF draft for all our measurements. Butexcept of them we use the hardware utilizationparameters as well. Let’s now take a look at thelocations, where these groups of parameters aremeasured.First group is measured at UAC and includes the callstatistics such as number of (un)successful calls anddurations of the message exchanges. RTP samples foranalysis are captured here as well.Second group – the hardware utilization parameters –is measured directly on the SIP server. At this place CPUand memory utilization and network traffic is measured.The complete list of all measured parameters includes: Fig. 2. Registration Request Delay and Session RequestDelay in SIP Dialog.From the hardware utilization characteristics the CPUutilization plays the main role in performance analysis ofthe SIP server. This conclusion is logical because of theimportance of CPU in the computer architecture and theCPU oriented operations of the general SIP serverarchitecture.In general, the CPU utilization characteristic islimited by the maximal CPU performance, which is100%, but this boundary can be reached rarely. To bemore specific, due to the time intervals betweenparticular measurements of the CPU utilization cancause that short peak in CPU utilization characteristic isnot registered. However, during this peak delays and callquality impairments can occur. To reflect thisimperfection of our methodology, performance boundaryunder 100% should be anticipated. Actual value of theCPU performance boundary may vary, though.Therefore we search the CPU utilization characteristicfor the first point where maximum CPU utilization isreached. This point is then the maximum number ofcalls, which the SIP server can handle from the hardwareperformance point of view.The limit definition for the SIP delay characteristicsRRD and SRD comes from the nature of the SIPprotocol. When the call is set up the delays betweenCPU utilization.Memory utilization.Number of (un)successful calls.Registration Request Delay – time between firstRegister method and its related 200 OK response [2].Session Request Delay (SRD), the time between firstInvite method and related 180 Ringing message [2].Mean Jitter a Maximum RTP Packet Delay.Fig. 2 shows the meaning of the RRD and SRD delays inmore detail.B. Limit definition in results analysisThe previously defined parameters do not suffice toassess the SIP server’s performance. To be able todetermine the SIP server’s performance from thecollected data we need to define the limit values for eachISSN: 1109-27501014Issue 9, Volume 9, September 2010
WSEAS TRANSACTIONS on COMPUTERSMiroslav Voznak, Jan Rozhonmessages should not exceed several hundreds ofmilliseconds and although these limitations are tied upwith the travel of the SIP message from one end of callto another, it can be used for our purposes as well,because of the similarities that come from the need to setup a call quickly enough not to bother the user withnoticeable delays.From this, we can estimate that the quality boundaryfor RRD and SRD is somewhere around 300milliseconds. However, this value may vary inaccordance to the need of each one particular user.Generally, we can say that limit from the SIPtransactions point of view is reached, when SRD andRRD characteristics start increasing rapidly. Thisboundary will give us a slight space as the potentialreserve.The quality of speech is vulnerable to great delaysbetween consecutive RTP packets. It is affected by thejitter as well, but the jitter issue can be eliminated by thesufficient Jitter buffer on the receiving side, thereforemaximum packet delay is the key characteristic in RTPstream analysis. From the theory of IP telephony thedelays between packets should be in the tens ofmilliseconds, therefore and because of the similarreasons mentioned with SRD and RRD, we decided toset this boundary to approximately 90 milliseconds.All the delay characteristics use similar analogy withthe theoretical values for end-to-end delays, that is whytheir definition could not be exact and these parametersmay vary in different environments. To eliminatedifferent interpretation of the same results and tosimplify the delays analysis, we use as the qualityboundary for all the delay characteristics the point,where the particular characteristic change its “almostconstant” trend to rapid increase. This approach gives uscorrect results, which was tested experimentally, and themethodology of the analysis is much simplier.instead of media. Because the load is not constant butincreases slowly at the beginning of the test (first 10seconds) and decreases at the end of it (last 10 seconds),the results taken after this starting period and before theending one are the only ones which are going to beconsidered valid. To allow additional changes in timeinterval setting in the scenario and to strengthen theconsistency of the method we decided to use the datacollected during the middle 10 minutes of each step. Allthe parameters named in the previous subsection aremeasured except those related with RTP stream.The 10 second long time interval that was mentionedseveral times came from the compromise betweenreasonable call length and the need for generating asmuch of the calls per second as possible. It allows fordecent performance and does not require huge databaseof subscribers. This interval can be changed but cannotexceed 2.5 minutes that allow for collecting the validdata.SRD is measured although this scenario cannot beconsidered as end-to-end (this condition is defined indraft [2]). We decided to measure it because the load onthe UASs is minimal even for high call rates, whichmakes the delays created by the UASs both minimal andalmost constant. Therefore we can use this parameter todecide about the SIP Proxy’s performance, because thedelays created by it are the only variable making thecollected data useful. This is the only deviation of ourmethod from the draft [2].D. B2BUA testingUnlike SIP Proxy for this type of SIP server the RTPstream presents the highest load on the SIP servertherefore the number of simultaneous calls must be usedas a metric. This is the main difference between theB2BUA and SIP Proxy testing scenarios. Second not soimportant difference (from the methodology point ofview) is that in this configuration we are to measureeffectiveness of codec translation because in thisscenario performance of the B2BUA is not affected onlyby its setting but also by UAC and UAS configurations.The test routine will then be repeated for each case ofdifferent codec setting.The method of the test is however almost the same,the only issue we face is the new metric together withthe need for revising the time interval for a single call.The new metric is an issue when the SIP trafficgenerator cannot be ordered to create certain number ofsimultaneous calls. In this case it is necessary tocalculate the number of calls generated per second. Thiscan be done by this equation:C. SIP Proxy testingIn basic configuration of the SIP Proxy we are able tomeasure just the SIP and utilization parameters. RTPstream does not flow through SIP Proxy and thus it doesnot represent the load for it. This is why we do not haveto think about the call length because no matter howlong the call is the hardware utilization is the same, sothe only appropriate metric for measuring SIP Proxy isthe number of calls generated per second (or any othertime interval).Each measurement on SIP Proxy consists of severalsteps. Every single step takes about 16 minutes, thismeans that for 15 minutes, 10-second long calls are to begenerated at a user-defined call rate. Then there is a 10second period when the unfinished calls are terminated.This repeats for every single step of the call rate. Everycall consists of a standard SIP dialogue and pauseISSN: 1109-2750C R CS T1015Issue 9, Volume 9, September 2010(1)
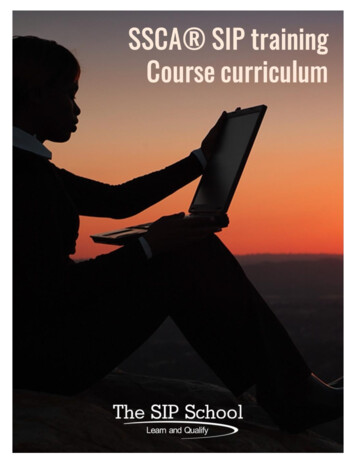
WSEAS TRANSACTIONS on COMPUTERSMiroslav Voznak, Jan RozhonCR is the desired Call Rate, CS is the number ofsimultaneous Calls we want to generate and T is Timeinterval defining how long the call (media) should be.Time interval used for B2BUA in our measurements wasset to 60 seconds because most calls have this length, butagain this parameter can be changed. To perform thetesting of RTP streams we use a special computer, whichallows us to use more sophisticated tools for capturingthe network traffic without the RTP and SIP parts of thetests influencing each other. Because we focus on testingeffectiveness and speed of codec translation we were, atthis point, able to determine the maximum load whichthe SIP server can handle from the SIP or RTP point ofview. However, these results would only be valid for asingle machine/platform and that is why we add onemore step to the data analysis. The same procedure oftesting as mentioned above is performed on a machineconfigured to allow media to only pass through the SIPserver. The results taken during this test serve as a basisto which we relate all the other results. The relation isexpressed in (2) as a performance ratio. The performancerating factor PRF is a ratio of any previously mentionedparameter measured in codec translation case (PCT) witha certain number of simultaneous calls to the value of thesame parameter (P) taken in case without codectranslation and the same load.PRF PCT 100Pused by UAC. UASs are configured to use G711u-law,G711A-law, G726-32 and GSM codecs. The AsteriskPBX performs the codec translation. RTP streams can becaptured and analyzed with Wireshark. Wireshark offersvery complex means for RTP analysis [7]. However, thegeneration of RTP streams on the client side consumes alot of CPU power, this means that we have to limit thenumber of calls generated by a single machine, whichleads us to multiply the number of PCs running the UACscheme. The total number of the computers can bedecided according to an estimated maximum load on aSIP server. Since in our case the SIP server is a PC withmerely a dual-core processor, the total number ofsimultaneous calls will not exceed one thousand [8].Each PC with our hardware configuration can generatearound 200 simultaneous calls. This is why the numberof clients should equal or exceed four. In our case, fouris just enough to perform the test of B2BUA. UASs canhandle much higher load, and this is why there will bejust two of them.(2)This step allows us to compare the results fromhardware and platform independently.4 ExperimentTo simulate both UACs and UASs, we are going to usethe SIP performance testing tool called SIPp [6]. Thisopen source utility can simulate many concurrent SIPcalls. Moreover it allows measuring important timessuch as those defined in the IETF draft [2]. SIPpperforms the calls which follow user-defined scenariosin xml language. This xml scenarios are distributed onevery computer and SIPp is invoked by using bash scriptand SSH. One of the computers works as a SSH clientand controls the whole test by sending orders to othercomputers (SSH servers) via SSH. The message callflows exchanged between related UAC and UAS SIPpinstances are depicted in the Fig. 3. As a B2BUA we useAsterisk PBX and as SIP Proxy we deploy Opensips.The key values of hardware utilization on the SIPserver are measured by System Activity Reporter (SAR)every 10 seconds and 60 times, i.e. during the middle 10minutes of the test when the generated load is constant.The media for B2BUA testing consist of a 60-secondlong music song recorded in G711u pcap file, which isISSN: 1109-2750Fig. 3. Flow of messages in tests on B2BUA and SIPProxy.1016Issue 9, Volume 9, September 2010
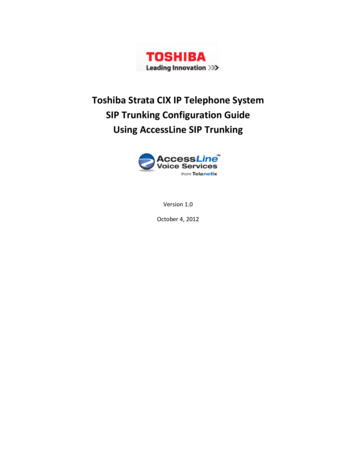
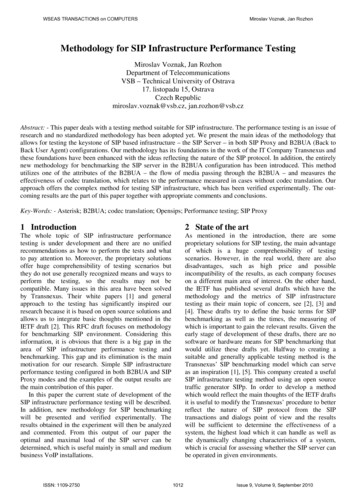
WSEAS TRANSACTIONS on COMPUTERSMiroslav Voznak, Jan RozhonSince the media are not required for testing the SIPProxy, the scenario places a 10 second long pauseinstead of them. During this time period no SIPmessages and no media is transmitted. Due to the muchhigher performance of the SIP Proxy in comparison withB2BUA we can estimate that our machine is able tohandle around 2 500 calls generated per second, whichforces us to use at least 12 computers as UAC. TwoUASs are sufficient though. The entire process ofperformance testing needs multiple computers togenerate SIP traffic. To be able to successfully perform atest, the whole process must be automated. Therefore allthe computers are being given orders by a Main UACvia SSH. On the Main UAC the bash script is invoked todeal with this task. In the first step, main UAC countsthe number of calls that each computer should generateper one second period. Then it orders the UASs toregister and starts listening on UDP port 5060. Secondly,SIPp on all UACs is invoked to generate traffic. As thelast step, SAR is invoked. This is done after 2,5 minutesto ensure the stable load has been reached already. Theresults contain CPU, memory and network statistics, andare stored in a file data callrate.sar in binary format.As mentioned in the methodology the hardwareconfiguration of the computers running SIPp is not tooimportant, even five years old hardware is up to the task,but the configuration of the SIP server is crucial. For ourmeasurements we used SIP server with these attributes: CPU – AMD Athlon 64 X2 5200 RAM – 4GB DDR2 (3.5 GB used due to x86system) Debian 5.0 x86 Asterisk PbX v.1.6.2 Opensips v.1.6.0A. B2BUAFor each category, there are two different charts. Thefirst one shows the results for the case without codectranslation and is colored in blue. The second shows thenormalized values (acquired by inserting the collecteddata to equation (2)) of the cases with a codec translationand is colored in three different colors.1) Mean CPU UtilizationAll the devices are connected to a gigabit switchwhen SIP Proxy is tested and to 100 megabit switchwhen B2BUA is tested. The switches can differ becausethere is no actual need or reason to compare the resultsof SIP Proxy and B2BUA, since their operation iscompletely different.Fig. 4. Mean CPU utilization for case without codectranslation (G.711u-G.711u) and its related NormalizedValues for cases with codec translation.5 ResultsThe data collected during the whole test of SIP Proxy orB2BUA are in text format (binary data can beconverted), so the data analysis can easily be done byany spreadsheet application, but for the correctinterpretation of the data we have to perform a series ofthe same measurements to ensure that the effect ofrandom events such as data packet scheduling techniquesis marginal. The actual data then can be determined asthe average of the collected data or the multitude ofmeasurements can just serve to reveal the flawed data,which then can be replaced by the interpolated values.ISSN: 1109-2750First chart shows a simple relation between thenumber of concurrent calls passing through the B2BUAand its CPU utilization. The second chart shows that (asexpected) codec translation from G711u to G711Aconsumes about 20% more CPU power than a simpleG711u case without translation. On the other hand, themost demanding is the G726-32bit codec. The lowestload returns the most interesting information. With theload of 60 calls, the differences in CPU powerconsumption for GSM and G726 are the highest1017Issue 9, Volume 9, September 2010
WSEAS TRANSACTIONS on COMPUTERSMiroslav Voznak, Jan Rozhoncompared to the one without codec translation. Withhigher loads it starts decreasing rapidly.the load is under 240 simultaneous calls. Then, as theCPU utilization increases, the delays get very long. Thelast G711A value for both charts is so low due to a rapidincrease of delays for G711u to G711u case between600-660 simultaneous calls. The fluctuations in chartswith normalized values are caused by the random eventsduring the measurements with and without codectranslation. Because we relate these values in a singleequation, the variances get more distinctive, howeverthis does not affect the final decision about the B2BUAperformance from the SIP point of view.2) RRD and SRD Delays3) Mean Jitter and Maximum RTP Packet DelayFig. 6. Mean Jitter and Maximum Packet Delay andrelated Normalized Jitter.Normalized values of mean jitter and maximumpacket delay confirmed expected outcome as the valuesrelated to a small load are very similar to the main valuesfrom the case without codec translation. Peaks in thearea of the medium load are caused by the volatile natureof the parameters and have no effect on final decisionabout the B2BUA’s performance. A very rapid decreaseof both normalized values for G711A is caused by theincrease of the main values from non-translation caseFig. 5. Mean CPU utilization for case without codectranslation (G.711u-G.711u) and its related NormalizedValues for cases with codec translation.Charts on Fig. 5 clearly illustrate that the call is set upeven quicker when there is a codec translation in use andISSN: 1109-27501018Issue 9, Volume 9, September 2010
WSEAS TRANSACTIONS on COMPUTERSMiroslav Voznak, Jan Rozhonand by the significant number of unsuccessful calls inthis scenario.Fig. 8. Mean CPU Utilization (SIP Proxy – 4 UDPlisteners).Fig. 7. Normalized Maximum Packet Delay.B. SIP ProxyThe situation is much simpler than with the B2BUA.The only output from our measurements is raw datadescribing the ability of the SIP Proxy to handleincreasing number of calls generated per second, but allthe representatives of the SER architecture allow user toset the number of listening subprocesses and this numbershould (in theory) affect the performance of the SIPProxy as well. Therefore all the measurements wereperformed with the number of UDP listeners to thevalues of 4 and 16.1) Mean CPU UtilizationThe results are not surprising except of the peak thatappeared when 600 calls per second were generated.This data is not flawed, because the similar peak in thesame area was measured many times, therefore it ismuch likely caused by the call handling mechanism ofthe SIP Proxy. From both charts it is obvious, thatincreased number of UDP listeners does not have thepositive effect on the SIP Proxy’s performance. On thecontrary, the CPU utilization with 16 listeners iscomparable with the performance of the SIP Proxysubprocessed to 4 listeners with the load of about 150calls higher. This may be caused by the insufficientperformance of the CPU, which cannot handle increasednumber of processes in real time and causes delays. Thelimiting factor for this measurement was the CPUutilization, however increased performance can bereached if other than MySQL database is used, becausedatabase itself consumed 17% of the CPU power.Unfortunately, when we performed the measurements,no working database module was released for Opensipsexcept of MySQL due to the transition between twomajor releases.ISSN: 1109-2750Fig. 9. Mean CPU Utilization (SIP Proxy – 16 UDPlisteners).2) RRD and SRDFig. 10. RRD and SRD (SIP Proxy – 4 UDP listeners).1019Issue 9, Volume 9, September 2010
WSEAS TRANSACTIONS on COMPUTERSMiroslav Voznak, Jan Rozhonwith the values that came from the CPU utilizationmeasurements. In other words, the IRA and ISAparameters are highly related to CPU utilizationcharacteristic and therefore they do not provide newinformation about the limits of the SIP server, whichmakes them redundant in SIP server performanceanalysis. On the other hand, in some special cases theseparameters might be useful and therefore we includedmeasurements of these parameters to our methodology.Fig. 11. RRD and SRD (SIP Proxy – 16 UDP listeners).From the SIP perspective, the situation is similar to onethat came out from CPU utilization statistics. Again, thenumber of subprocesses has negative influence on theoverall performance of the SIP Proxy. RRD and SRDdelays are about 2-3 times higher when the number ofsubprocesses is set to 16. Moreover, the huge leap inboth characteristics (RRD and SRD) appears about 200calls earlier. From the perspective of the two presentedparameters (CPU utilization and del
of the SIP server to successfully connect calling and called party. In order to perform SIP testing, we simulate both ends of the SIP dialogue to test the main part of the SIP infrastructure, the SIP server. The SIP server represents a set of servers always involving SIP Registrar and SIP Proxy or B2BUA (Back to Back User Agent).