Transcription
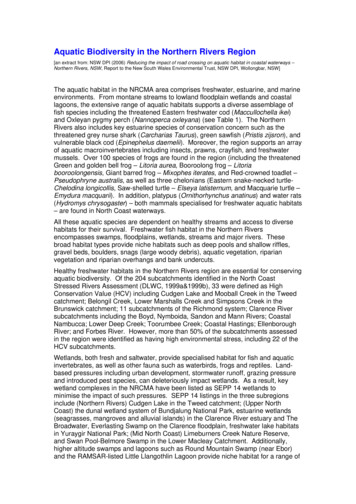
Hydrographic Surveys of Rivers and Lakes Using aMultibeam Echosounder Mapping SystemUsing Sound Waves to Map River and Lake BottomsThe Multibeam Echosounder Mapping SystemA multibeam echosounder (MBES) is a type of soundnavigation and ranging device that uses sound waves to “see”through even murky waters (fig. 1: Note that all figures usedin this report are for an illustrative rather than an interpretivepurpose, not all geographic locations will be shown). Unlikea single beam echosounder (also known as a depth sounderor fathometer) that releases a single sound pulse in a single,narrow beam and “listens” for the return echo, a multibeamsystem emits a multidirectionalradial beam to obtain information within a fan-shaped swath(figs. 1, 2). The timing anddirection of the returning soundwaves provide detailed information on the depth of water andthe shape of the river channel,lake bottom, or any underwaterfeatures of interest. This information has been used by theU.S. Geological Survey (USGS)Surveyed channel bedto efficiently generate highresolution maps of river andEXPLANATIONlake bottoms.A multibeam echosounder mapping system (MBMS) isan integration of several individual components: the MBES,an inertial navigation system (INS), and a data-collection anddata-processing computer. The MBES that was used for numerous surveys completed by the USGS in Missouri is the TeledyneRESON SeaBat 7125–SV2 (fig. 3), which is operated at afrequency of 200 or 400 kilohertz.ShallowU.S. Department of the InteriorU.S. Geological SurveyWater depthFigure 1. Schematic of a survey with a multibeamechosounder mapping system on the MississippiRiver near the Jefferson Barracks Bridge onInterstate 255 near St. Louis, Mo. Photograph byRichard Huizinga, U.S. Geological Survey.Survey boat with anInertial NavigationSystem (INS)MultibeamechosounderFan-shapedradial swathDeepFact Sheet 2018–3021June 2018
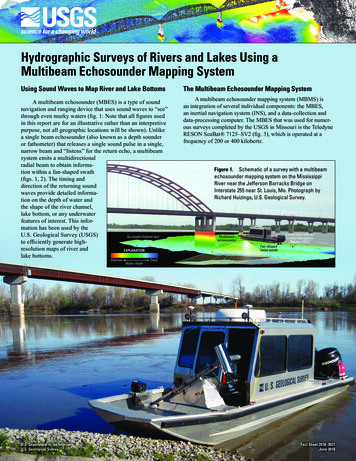
To accurately position and interpret the data received bythe MBES, the INS uses two Global Navigation Satellite Systemantennae and an inertial motion unit to provide position inthree-dimensional space and measure the heave, pitch, roll, andheading of the vessel (and, thereby, the MBES). A connection toa source of real-time kinematic corrections often is established toimprove real-time display of a survey. Whether or not a sourceof real-time kinematic corrections is used during a survey, datafrom the INS typically are postprocessed to mitigate the effectsof degraded positional accuracy of the vessel during the survey.After the survey is completed, the acquired data from the MBESare processed to remove data spikes and other spurious pointsin the MBES soundings, georeferenced using the postprocessedINS data, and visualized as a triangulated irregular network surface or a point cloud (figs. 1, 2). The various components of theMBES mapping system are described in detail in studies of theMissouri and Mississippi Rivers in Missouri (Huizinga, 2016,2017; Huizinga and others, 2010).EXPLANATIONSingle beam data pointApplications of the Multibeam Echosounder MappingSystemChannel-Bed ScourEXPLANATIONShallowDeepWater depthFigure 2. Example of single beam (top) and multibeam echosounder(bottom) output (modified from Alvarado and Robinson, 2011).Figure 3. TheTeledyne RESONSeaBat 7125–SV2 multibeamechosounder. A, Asviewed from thebottom. B, Mountedon the port side ofthe U.S. GeologicalSurvey survey boat.Photograph byRichard Huizinga,U.S. GeologicalSurvey. Any useof trade, product,or firm names isfor descriptivepurposes only anddoes not implyendorsement by theU.S. Government.Scour in river channels is the removal of channel-bedand bank material by flowing water and is the leading causeof bridge failures in the United States (Richardson and Davis,2001). Scour at a bridge site is the result of short- and long-termgeomorphic processes and local effects caused by elementsof the structure (pier, footing) in or adjacent to the waterway(Richardson and Davis, 2001; Huizinga and Rydlund, 2004).Scour processes can be exacerbated during high-flow conditions because velocity and depth typically increase. Because theeffects of scour can be severe and dangerous, bridges and otherstructures over waterways are inspected routinely. Multibeamsurveys around bridges can reveal the short- and long-termeffects of bed scour near the bridge structures (figs. 4, nsideshroud)Piezoceramicprojector arrayStabilizerstrutsHead tiltbracketTransducerhead
FlowDrilled shaftUnderminedseal courseEXPLANATION472871271670070469868268667Figure 4. Examples of three-dimensional representations of scouraround a bridge pier obtained using a multibeam mapping system.The top image is the Interstate 635 Bridge on the Missouri River atRiverside, Mo., and the bottom image is the Interstate 435 Bridge onthe Missouri River at Randolph, Mo. (Huizinga 2016).Elevation of point, in feetabove the North AmericanVertical Datum of 1988Channel-Bottom CharacteristicsFlowEcho from sides ofdrilled shaftsIn rivers, the channel-bed features reflect dynamicinteractions between flowing water and the mobile sediment available on the bed. These interactions generate awide range in channel-bed characteristics depending onthe hydrologic and geologic context and provide a variety of aquatic habitat conditions for fish and invertebrates. Knowing when and where selected channel-bedconditions are found, how these features are used byaquatic species of interest, and how these features maychange with time are all valuable pieces of information for fisheries managers. For example, channel-bedfeatures acquired using the MBMS, in conjunction withvelocity distribution data provided by an acoustic Doppler current profiler (Mueller and others, 2013), wereused to assess pallid sturgeon habitat in the MissssippiRiver near a proposed bridge construction site (fig. 6;Huizinga and others, 2010).Multibeam echosounder surveys have been completed by the USGS at numerous bridge locations alongthe Missouri and Mississippi Rivers to determine channel-bed characteristics. At all the surveyed locations, avariety of fluvial features were detected in the channel,ranging from a planar or nearly planar bed—indicating minimal bedload transport in these areas—to largedunes that indicate substantial transport of bedload.Rock outcrops also were detected at several sites where the alluvial material ofEXPLANATIONElevation of point, in feetthe channel bed had been washed away.above the North AmericanRepeated surveys at these locations haveVertical Datum of 1988allowed for the quantification of bed715710changes (deposition and scour) with time705700and provide some indication of the bed695volume change and the relation between690685streamflow changes and the associated680channel-bed responses (fig. 7).675
94 38'50"'55"'00"94 3894 39'05"'10"94 3994 39EXPLANATIONChannel-bed elevation,in feet above North AmericanVertical Datum of 19887357307257200"39 9'2715710705700Pier 3695FLOW6906855"39 9'194 39Rock outcrop'15"tStone revetmenPier 20"39 9'10050 100 150 200 250 FEET255075 METERSFigure 5. Planar view of mapped Missouri River channel reachindicating substantial scour around a bridge pier and other channelsubstrate features (Interstate 635 Bridge over the Missouri River atRiverside, Mo.; Huizinga, 2016).Estimation of Bedload TransportBedload, defined as “the sediment that slides, rolls, or skipsalong in almost continuous contact with the streambed” (Hubbell, 1964, p. 2), currently (2018) is not measured consistentlyin most rivers. Direct measurement of bedload in large sand-bedrivers is highly inaccurate (Hubbell, 1964; Edwards and Glysson, 1999), and unconfirmed theoretical estimates commonlyare used (Gomez, 2006). Techniques using time-lagged MBMSsurveys (as demonstrated in figure 7), such as about an hour,have been developed to estimate bedload transport based ondune movement and the associated change in areas of scour andfill (Abraham and others, 2011).Lake Surveys and Volume CalculationsSedimentation in lakes and reservoirs can result in reducedcapacity for flood storage and water supply and a loss of usableaquatic habitat over time. A detailed bathymetric survey allowsfor an accurate determination of available lake capacity forvarious uses. The MBMS has been used to map and determineaccurate volume estimates for lakes in Missouri (fig. 8) andsurrounding States. Such information can be used to determinewater-supply availability, reservoir sedimentation rates and projected lifespans, and the spatial distribution of selected aquatichabitat.References CitedAbraham, D.D., Kuhnle, R.A., and Odgaard, A.J., 2011, Validation ofbed-load transport measurements with time-sequenced bathymetricdata: Journal of Hydraulic Engineering, v. 137, no. 7, p. 723–728.Alvarado, A., and Robinson, D., 2011, Hydro survey—Multi-beam vs.single beam (part 1): Ayres Associates web page, accessed January,2018, at multibeam-vs-single-beam-part-1/.Edwards, T.K., and Glysson, G.D., 1999, Field methods for measurement of fluvial sediment: U.S. Geological Survey Techniques ofWater-Resources Investigations, book 3, chap. C2, 89 p.Gomez, B., 2006, The potential rate of bed-load transport: Proceedings of the National Academy of Sciences of the United States ofAmerica, v. 103, no. 46, p. 17170–17173. [Also available at , D.W., 1964, Apparatus and techniques for measuring bedload:U.S. Geological Survey Water-Supply Paper 1748, 74 p., accessedApril 15, 2015, at nga, R.J., 2012, Bathymetric and velocimetric surveys at highwaybridges crossing the Missouri River in and into Missouri during summer flooding, July–August 2011: U.S. Geological Survey ScientificInvestigations Report 2012–5204, 166 p.Huizinga, R.J., 2014, Bathymetric surveys and area/capacity tables ofwater-supply reservoirs for the city of Cameron, Missouri, July 2013:U.S. Geological Survey Open-File Report 2014–1005, 15 p., https://doi.org/10.3133/ofr20141005.Huizinga, R.J., 2016, Bathymetric and velocimetric surveys at highwaybridges crossing the Missouri River near Kansas City, Missouri,June 2–4, 2015: U.S. Geological Survey Scientific InvestigationsReport 2016–5061, 93 p. [Also available at https://doi.org/10.3133/sir20165061.]Huizinga, R.J., 2017, Bathymetry and velocity data from surveys athighway bridges crossing the Missouri and Mississippi Rivers nearSt. Louis, Missouri, October 2008 through May 2016: U.S. Geological Survey data release, accessed January 2018 at https://doi.org/10.5066/F71C1VCC.Huizinga, R.J., Elliott, C.M., and Jacobson, R.B., 2010, Bathymetricand velocimetric survey and assessment of habitat for pallid sturgeonon the Mississippi River in the vicinity of the proposed Interstate70 Bridge at St. Louis, Missouri: U.S. Geological Survey ScientificInvestigations Report 2010–5017, 28 p. [Also available at https://pubs.usgs.gov/sir/2010/5017/.]
90 10'55"90 10'50"90 10'45"90 10'40"90 10'35"90 10'30"EXPLANATIONFlow38 39'Vertically averaged velocity,in feet per second6.5 to 7.06.0 to 6.55.5 to 6.05.0 to 5.54.5 to 5.04.0 to 4.53.5 to 4.03.0 to 3.52.5 to 3.02.0 to 2.51.5 to 2.01.0 to 1.50.5 to 1.00.3 to 0.538 38'55"Channel-bed elevation, in feetabove North American VerticalDatum of 6236035835635435235034834638 38'50"sedropoof p ridgeeniterl70 BCen rstateInte38 38'45"Proposed locationof main channelpiers38 38'40"38 38'35"38 38'30"38 38'25"0St. Louis City, Missouri0100 200 300 400 500 600 FEET50100150 METERSSt. Clair County, IllinoisFigure 6. Planar view of mapped Mississippi River channel reach indicating bed features andcorresponding velocity distribution (Huizinga and others, 2010).
'50"94 38'55"94 38'00"94 39'05"94 39'10"94 390"39 9'2Pier 3FLOW5"39 9'194 39Rock outcropStone revetment'15"Pier 20"39 9'1EXPLANATIONChange in channel-bed elevation, in feet-45 -30 -20 -15 -10 -7 -5 -3 -1 1SCOUR350 50 100 150 200 250 FEET0255075 METERS7 10 15 20 30DEPOSITIONFigure 7. Planar view of mapped Missouri River channel reach at Kansas City, Mo., indicating the change in bed conditions betweensurveys in 2015 and 2011 (Interstate 635 Bridge over the Missouri River at Riverside, Mo.; Huizinga, 2016).Huizinga, R.J., and Rydlund, P.H., Jr., 2004, Potential-scour assessments and estimates of scour depth using different techniques atselected bridge sites in Missouri: U.S. Geological Survey ScientificInvestigations Report 2004–5213, 42 p. [Also available at https://pubs.usgs.gov/sir/2004/5213/.]Mueller, D.S., Wagner, C.R., Rehmel, M.S., Oberg, K.A., and Rainville, F., 2013, Measuring discharge with acoustic Doppler currentprofilers from a moving boat (ver. 2.0, December 2013): U.S Geological Survey Techniques and Methods, book 3, chap. A22, 95 p. [Alsoavailable at https://doi.org/10.3133/tm3A22.]Richardson, E.V., and Davis, S.R., 2001, Evaluating scour at bridges(4th ed.): U.S. Federal Highway Administration Publication FHWANHI 01–001, Hydraulic Engineering Circular no. 18, 378 p.By Richard J. Huizinga and David C. HeimannFor further information, please contactEXPLANATIONShallowWater depthDeepFigure 8. Planar view of mapped bottom of Reservoir3 near Cameron, Mo., from a multibeam echosoundersurvey in July 2013 (Huizinga, 2014).Director, Central Midwest Water Science CenterU.S. Geological Survey1400 Independence RoadRolla, MO 65401(573) 308-3667https://mo.water.usgs.gov/ISSN 2327-6916 (print)ISSN 2327-6932 (online)https://doi.org/10.3133/fs20183021
are used (Gomez, 2006). Techniques using time-lagged MBMS surveys (as demonstrated in figure 7), such as about an hour, have been developed to estimate bedload transport based on dune movement and the associated change in areas of scour and fill (Abraham and others, 2011). Lake Surveys and Volume Calculations