Transcription
Cyber Security Awareness and Its Impacton Employee’s BehaviorLing Li(&), Li Xu, Wu He, Yong Chen, and Hong ChenOld Dominion University, 5115 Hampton Blvd, Norfolk, USA{lli,lxu,whe,y7chen,hchen001}@odu.eduAbstract. This paper proposes a model that extends the Protection MotivationTheory to validate the relationships among peer behavior, cue to action, andemployees’ action experience of cyber security, threat perception, responseperception, and employee’s cyber security behavior. The findings of the studysuggest that the influence from peer behavior and employees action experienceof cyber security is an important factor for improving cyber security behavior inorganizations. Peer behavior positively affects cue to action, which positivelyimpacts employees’ action experience. Employees’ action experience thenwould have positive impacts on their threat perception and response perception.As a result, employees’ threat perception and response perception are positivelyrelated to their cyber security behavior. This process is a chain reaction.Keywords: Cyber security awareness Employee cyber security behavior1 IntroductionRecent cyber security breaches have caught attention of many organizations to takeappropriate measures to security their database and business, and to develop effectivecyber security policies. The top 5 cyber security threats identified by a SungardAvailability Services survey [1] in 2014 are vulnerable web applications, being overallsecurity aware, out-of-date security patches, failure to encrypt PCs and sensitive data,and obvious or missing passwords. Among these threats, security awareness wasranked the second as the most important cyber security issue and was noted by 51% ofrespondents. Therefore, designing and implementing security awareness programs,such as cyber security policy enforcement [2–4] and mandated trainings [3, 5, 6],security communication and computer monitoring [6], and top management commitment [6], are essential to improve cyber security.2 Background and HypothesesThis paper proposes a model by integrating the protection motivation theory(PMT) and the Health Belief Model (HBM) to test the cyber security awareness and itsimpact on employee’s behavior. Figure 1 shows the relationships among peer behavior,cue to action, employees’ action experience of cyber security, threat perception (perceived severity, perceived vulnerability and perceived barriers), response perception(response efficacy and self-efficacy), and cyber security behavior. IFIP International Federation for Information Processing 2016Published by Springer International Publishing AG 2016. All Rights ReservedA.M. Tjoa et al. (Eds.): CONFENIS 2016, LNBIP 268, pp. 103–111, 2016.DOI: 10.1007/978-3-319-49944-4 8
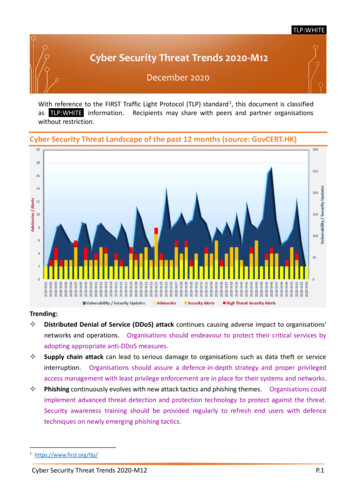
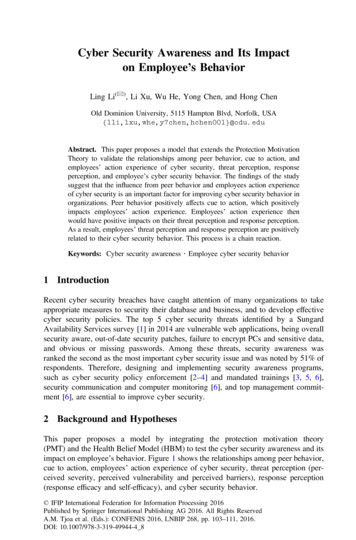
104L. Li et al.Prior research has explored the reasons why security awareness programs are noteffective. Specifically, Herath and Rao [7] developed and tested a theoretical model ofthe incentive effects of penalties, pressures and perceived effectiveness of employeeactions. They found that employees’ cyber security behaviors were influenced byintrinsic and extrinsic motivators. Ng and Xu [8] adopted the Health Belief Model(HBM) in user security study and found that users’ perceived susceptibility, perceivedbenefits, and self-efficacy would determine their security behavior. A number ofpublished studies adopt the protection motivation theory (PMT) to investigate howemployees’ threat perception and response perception regarding cyber security impacttheir compliance behaviors (e.g. [9–13]).However, findings reported by these studies are inconsistent. For example, Ng andXu [8] find that individuals exposed to higher levels of cue to action do not have ahigher level cyber security behavior than others; whereas Johnston and Warkentin [10]find that social influence have a positive effect on individuals’ intention to adopt cybersecurity actions. Individuals’ perceived severity of cyber-attacks have been found haveboth positive impacts [9, 13, 14], or negative impacts [8], or even no impact [15] ontheir intention to comply with cyber security policies. Similarly, individuals’ perceivedvulnerability of cyber-attacks has been found to be both positively [14] or negatively[13] influence their intention to comply with cyber security policies. Furthermore,individuals’ response efficacy of cyber-attacks is found to be both positively [9, 10] ornegatively [13, 14] affect their intention to comply with cyber security policies as well.We intend to provide a clearer picture on employee cyber security behavior byproposing a model (Fig. 1) that integrates the protection motivation theory (PMT) andthe Health Belief Model (HBM) to validate the relationships among peer behavior, cueto action, employees’ action experience of cyber security, their threat perception(perceived severity, perceived vulnerability, and perceived barriers) and responseperception (response efficacy and self-efficacy), and their cyber security behavior.A number of hypotheses based on Fig. 1 have been developed.Fig. 1. Conceptual Model
Cyber Security Awareness and Its Impact on Employee’s Behavior105Hypothesis 1. Peer behavior is positively associated with cues to action foremployees’ cyber security behaviors.Hypothesis 2. Cues to action positively affect employees’ action experience ofcyber security.Hypothesis 3a. Employees’ action experience positively affects their perceivedseverity of cyber security incidents.Hypothesis 3b. Employees’ action experience positively affects their perceivedvulnerability caused by cyber security incidents.Hypothesis 3c. Employees’ action experience negatively affects their perceivedbarriers about cyber security incidents.Hypothesis 3d. Employees’ action experience positively affects their responseefficacy about cyber security incidents.Hypothesis 3e. Employees’ action experience positively affects their self-efficacyabout cyber security incidents.Hypothesis 4a. Employees’ perceived severity positively affects their self-reportedcyber security behavior.Hypothesis 4b. Employees’ perceived vulnerability positively affects theirself-reported cyber security behavior.Hypothesis 4c. Employees’ perceived barriers negatively affect their self-reportedcyber security behavior.Hypothesis 4d. Employees’ response efficacy positively affects their self-reportedcyber security behavior.Hypothesis 4e. Employees’ self-efficacy positively affects their self-reported cybersecurity behavior.3 Research MethodThe empirical data was collected using a survey questionnaire in the US in 2015. Samplesize in this study is 579. The socio-demographic characteristics data are reported inTable 1. About 35% of the respondents are male and 65% are female. Among theparticipants, 68.58% are under 30 years old. Respondents are from diverse industries.When they were asked whether their company had an explicit cyber security policy,about 46% of the participants answered “yes”, 14.68% answered “no”, and a little over athird of the participants (39.21%) said that they knew nothing about their company’sinformation security policy. Variables about behavior and belief are assessed via aseven-point Likert scale, ranging from strongly disagree (1) to strongly agree (7).Structural equation modeling (SEM) method was applied to explore the relationships among the constructs in the conceptual model. SEM follows a two-step approachthat includes constructing the measurement model and testing the structural model.Specifically, we test the proposed model and assess the overall fit using the maximumlikelihood method in Amos.Nine latent constructs and their observed variables are measured in the proposedmodel. Most of measurements in this study were tested in previous studies. To assessthe reflective constructs in our measurement model, we examined construct reliabilityand validity, convergent validity, and discriminant validity. First, we conducted
106L. Li et al.principal component analysis to identify and to confirm the different factors under eachconstruct in our model. Specifically, we ran exploratory factor analysis (EFA) andconfirmatory factor analysis (CFA) in SPSS. EFA using principal-component factoranalysis with Varimax rotation was performed to examine the factor solution amongthe nine factors in the study. The results reveal that the nine factors have eigenvaluesgreater than 1. Next, CFA is conducted to confirm the factors under each latent variable. The results of CFA are shown in Table 2.The results of CFA confirm the significance of all paths between observed variablesand the first order latent variables at the significant level p 0.001. The constructvalidity of our model is explained through the percentage of variance extracted [16].The total variance explained by each construct is in the range of 53–73% (see Table 2).Reliability for the constructs is assessed via Cronbach’s alpha. The reliability for allTable 1. Socio-demographic characteristicsFrequency Percent (%)GenderMaleFemaleAgeYounger than 1818–2021–3031–4041–5051 and ion165Finance/Banking/Insurance 18Information technology31Retail/wholesale74Real itary19Others117579Security Policy AwarenessNo85Yes267Don’t 0.21100.0014.6846.1139.21100.00
Cyber Security Awareness and Its Impact on Employee’s BehaviorTable 2. Results of factor analysisIndicatorAction experience(AE)AE1AE2AE3AE4Perceived vulnerability(PV)PV1PV2PV3PV4Perceived severity(PS)PS1PS2PS3Perceived barriers(PBA)PBA1PBA2PBA3PBA4Response efficacy(RE)RE1RE2RE3RE4Cues to action(CA)CA1CA2CA3CA4Security self-efficacy(SE)SE1SE2SE3SE4SE5SE6Peer behavior(PBE)PBE1PBE2PBE3Loading S.E. 070.540.510.520.65Total Cronbac AVE62.45 0.800.4368.72 0.850.5573.41 0.820.6854.61 0.720.4864.01 0.810.5862.25 0.880.6667.50 0.760.570.72*** 0.12 0.520.77*** 0.10 0.590.97*** 0.10 0.570.720.650.730.720.78*** 0.08 0.610.81*** 0.09 0.660.67*** 0.08 0.45(continued)107
108L. Li et al.Table 2. (continued)IndicatorLoading S.E. R2 Total Cronbac AVESelf-reported security behavior(SCB)53.46 0.710.38SCB10.63*** 0.08 0.40SCB20.64*** 0.06 0.42SCB30.46*** 0.08 0.21SCB40.71*** 0.08 0.51constructs is considered acceptable [17], because all the values are bigger than thethreshold 0.70 (Table 2). Hence, we claim that both the construct validity and theconstruct reliability of our model are satisfactory.Convergent validity assesses consistency across multiple items. It is shown whenthe indicators load much higher on their hypothesized factor than on other factors (i.e.,own loadings are higher than cross loadings). Items that do not exceed the thresholdwill be dropped from the construct list. For our model, all estimated standard loadingsare significant at the significant level of p 0.001 [18] with acceptable magnitude( 0.50, ideal level is 0.70) [19] except SCB3. The results indicate that the measurements in our model have good convergent validity.The fit statistics of the structural model is reported in Table 3. The fit indiceschosen for our model represent two characteristics: the global fit measures and comparative fit measures. The chi-square test (v2) with degrees of freedom is commonlyused as the global model fit criteria. The chi-square statistic must, however, be interpreted with caution especially for a large sample size because the hypothesized modelmay be rejected if the discrepancy is not statistically equal to zero. We choose comparative fit index (CFI), goodness of fit index (GFI), incremental fit index (IFI), androot mean square error of approximation (RMSEA) to assess the congruence betweenthe hypothesized model and the data.The goodness of fit indices for the specified model are displayed in Table 3. The v2value for the structural equation model is 1882 (DF 582). The ratio of v2 and thedegrees of freedom (DF) is 3.23. The comparative fit index (CFI) is 0.87, thegoodness-of-fit index (GFI) is 0.84 and the incremental fit index (IFI) is 0.87. All thevalues are closed to the generally accepted minimum norms for satisfactory fit of 0.90.The test of the structural model includes estimating the path coefficients, whichindicate the strength of the relationships between the independent and dependent variables, and the R2 values, which are the amount of variance explained by the independentvariables. The full set of relationship for the structural model is provided in Table 4.The hypotheses in our structural model test the relationships among peer behavior,cue to action, employees’ action experience of cyber security, threat perception (perceived severity, perceived vulnerability, and perceived barriers), response perception(response efficacy and self-efficacy), and their cyber security behavior. The results ofour study support 11 out of 12 hypotheses that have been developed based on theconceptual model in Fig. 1. Hypothesis 4a (Employees’ perceived severity positivelyaffects their self-reported cyber security behavior) is the only one that is not supported.Table 4 shows the summary of hypotheses test result for the structural model.
Cyber Security Awareness and Its Impact on Employee’s Behavior109Table 3. Fit statistics for structural modelModel goodness of fit statisticsModel value1882v2df582v2/DF3.23Root mean square error of approximation (RMSEA) 0.062Comparative fit index (CFI)0.87Goodness-of-fit index (GFI)0.84Incremental fit index (IFI)0.874 DiscussionsThis paper proposes a model that integrates the protection motivation theory and theHealth Belief Model to validate the relationships among peer behavior, cue to action,employees’ action experience of cyber security, threat perception (perceived severity,perceived vulnerability, and perceived barriers), response perception (response efficacyand self-efficacy), and their self-reported cyber security behavior. The results confirmthat (a) peer behavior is a significant factor in enhancing the cue to action foremployee’s behavior towards cyber security; (b) cue to action significantly influencesemployees’ action experience related to cyber security; (c) employees’ action experience of cyber security positively affects their perceived severity, perceived vulnerability, response efficacy, and security self-efficacy but negatively affects their perceivedbarriers; (d) employees’ perceived severity, perceived vulnerability, response efficacy,Table 4. Summary of hypotheses test result for the structural modelPathsH1H2H3aH3bH3cH3dH3eH4aH4bH4cH4dH4ePeer behavior ! Cue to actionCue to action ! Action experienceAction experience ! Perceived severityAction experience ! Perceived vulnerabilityAction experience ! Perceived barriersAction experience ! Response efficacyAction experience ! Security self-efficacyPerceived severity ! Self-reported securitybehaviorPerceived vulnerability ! Self-reported securitybehaviorPerceived barriers ! Self-reported securitybehaviorResponse efficacy ! Self-reported securitybehaviorSecurity self-efficacy ! Self-reported securitybehaviorStandard pathcoefficient0.530.740.170.62 0.190.470.430.03p-value 0.001 0.001 0.001 0.001 0.001 0.001 0.001 0.50.12 0.05 0.24 0.0010.21 0.0010.49 0.001
110L. Li et al.and self-efficacy positively impact their self-reported security behavior and employees’perceived barriers negatively impacts their self-reported security behavior. Thesefindings concur with the results in previous research regarding the factors thatregarding employees’ cyber security behavior in workplace [8–10, 12, 14].This study explores self-reported cyber security behavior to measure employees’cyber security activities; this approach is different from prior cyber security studies thatused behavioral intention or likelihood of behavior as their dependent variables. Ourmeasurement reflects employees’ actual behavior, not their intentions. Therefore, theresults achieved in this study are more convincing.The results of this study reveal that the influence from peer behavior and employeesown action experience of cyber security is an important factor for improving cybersecurity in organizations. Peer behavior positively affects cue to action, which positively impacts employees’ action experience (H1 and H2). Employees’ action experience then would have positive impacts on their threat perception and responseperception (H3a, H3b, H3d, and H3e). As a result, employees’ threat perception andresponse perception positively affect their cyber security behavior (H4a, H4b, H4d, andH4e). This process is a chain reaction.5 ConclusionsFrom the findings of the study, we may suggest that organizations may considerdeveloping a system of rewards to create a pro-security internal atmosphere. Particularly, those employees who follow cyber security regulations and rules should beencouraged. In this way, employees can get clear cues from their peers in terms oftaking cyber security action. Meanwhile, organizations should promote experiencesharing regarding mitigating cyber security risks and reducing cyber security threat.This could be realized through effective training programs.This study has limitations that should be taken into account. Future research need tocompare the results of self-reported behavior and behavioral intention/likelihood ofbehavior. Future research may also analyze the moderating effect of cyber securitypolicy awareness level, industry, employee age, and other factors with other statisticaltools. Moreover, future research should explore the underlying causes of the moderating effect of gender and examine the effect using empirical tests.Acknowledgements. This work was supported by the National Science Foundation of the U.S.under [Grant Number 1318470].References1. DeMetz, A.: The #1 cyber security threat to information systems today (2015). /#6b46ca2bb1b02. Chen, Y., He, W.: Security risks and protection in online learning: a survey. Int. Rev. Res.Open Distrib. Learn. 14(5), 1–20 (2013)
Cyber Security Awareness and Its Impact on Employee’s Behavior1113. D’Arcy, J., Hovav, A., Galletta, D.: User awareness of security countermeasures and itsimpact on information systems misuse: a deterrence approach. Inf. Syst. Res. 20(1), 79–98(2009)4. Yayla, A.: Enforcing information security policies through cultural boundaries: a multinational company approach. In: Proceedings of 2011 ECIS, Paper 243, pp. 1–11 (2011)5. Stoneburner, G., Goguen, A.Y., Feringa, A.: SP 800-30. Risk management guide forinformation technology systems (2002)6. D’Arcy, J., Greene, G.: Security culture and the employment relationship as drivers ofemployees’ security compliance. Inf. Manag. Comput. Secur. 22(5), 474–489 (2014)7. Herath, T., Rao, H.R.: Encouraging information security behaviors in organizations: role ofpenalties, pressures and perceived effectiveness. Decis. Support Syst. 47(2), 154–165 (2009)8. Ng, B.Y., Xu, Y.: Studying users’ computer security behavior using the health belief model.In: Proceedings of PACIS 2007, vol. 45, pp. 423–437 (2007)9. Herath, T., Rao, H.R.: Protection motivation and deterrence: a framework for security policycompliance in organisations. Eur. J. Inf. Syst. 18(2), 106–125 (2009)10. Johnston, A.C., Warkentin, M.: Fear appeals and information security behaviors: anempirical study. MIS Q. 34, 549–566 (2010)11. Siponen, M., Mahmood, M.A., Pahnila, S.: Technical opinion are employees putting yourcompany at risk by not following information security policies? Commun. ACM 52(12),145–147 (2009)12. Steinbart, P.J., Keith, M.J., Babb, J.: Examining the continuance of secure behavior: alongitudinal field study of mobile device authentication. Inf. Syst. Res. 27, 219–239 (2016)13. Vance, A., Siponen, M., Pahnila, S.: Motivating IS security compliance: insights from habitand protection motivation theory. Inf. Manag. 49(3), 190–198 (2012)14. Siponen, M., Mahmood, M.A., Pahnila, S.: Employees’ adherence to information securitypolicies: an exploratory field study. Inf. Manag. 51(2), 217–224 (2014)15. Ng, B.Y., Kankanhalli, A., Xu, Y.C.: Studying users’ computer security behavior: a healthbelief perspective. Decis. Support Syst. 46(4), 815–825 (2009)16. Fornell, C., Larcker, D.F.: Structural equation models with unobservable variables andmeasurement error: algebra and statistics. J. Market. Res. 18, 382–388 (1981)17. Gefen, D., Straub, D., Boudreau, M.C.: Structural equation modeling and regression:guidelines for research practice. Commun. Assoc. Inf. Syst. 4(1), 7 (2000)18. Gefen, D., Straub, D.: A practical guide to factorial validity using PLS-graph: tutorial andannotated example. Commun. Assoc. Inf. Syst. 16(1), 5 (2005)19. Chin, W., Marcolin, B.: The holistic approach to construct validation in IS research:examples of the interplay between theory and measurement. In: Administrative SciencesAssociation of Canada Annual Conference, vol. 16, pp. 34–43. Administrative SciencesAssociation of Canada (1995)
Old Dominion University, 5115 Hampton Blvd, Norfolk, USA {lli,lxu,whe,y7chen,hchen001}@odu.edu Abstract. This paper proposes a model that extends the Protection Motivation . Cyber Security Awareness and Its Impact on Employee's Behavior 105. principal component analysis to identify and to confirm the different factors under each