Transcription
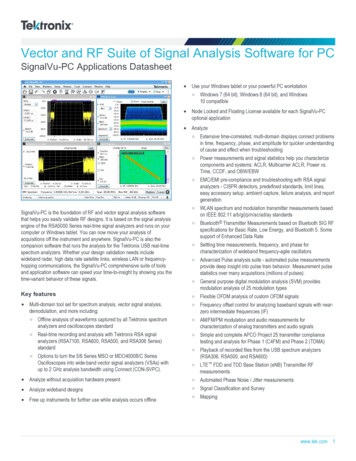
Vector and RF Suite of Signal Analysis Software for PCSignalVu-PC Applications DatasheetUse your Windows tablet or your powerful PC workstationWindows 7 (64 bit), Windows 8 (64 bit), and Windows10 compatibleNode Locked and Floating License available for each SignalVu-PCoptional applicationAnalyzeExtensive time-correlated, multi-domain displays connect problemsin time, frequency, phase, and amplitude for quicker understandingof cause and effect when troubleshootingPower measurements and signal statistics help you characterizecomponents and systems: ACLR, Multicarrier ACLR, Power vs.Time, CCDF, and OBW/EBWEMC/EMI pre-compliance and troubleshooting with RSA signalanalyzers - CISPR detectors, predefined standards, limit lines,easy accessory setup, ambient capture, failure analysis, and reportgenerationSignalVu-PC is the foundation of RF and vector signal analysis softwarethat helps you easily validate RF designs. It is based on the signal analysisengine of the RSA5000 Series real-time signal analyzers and runs on yourcomputer or Windows tablet. You can now move your analysis ofacquisitions off the instrument and anywhere. SignalVu-PC is also thecompanion software that runs the analysis for the Tektronix USB real-timespectrum analyzers. Whether your design validation needs includewideband radar, high data rate satellite links, wireless LAN or frequencyhopping communications, the SignalVu-PC comprehensive suite of toolsand application software can speed your time-to-insight by showing you thetime-variant behavior of these signals.Key featuresMulti-domain tool set for spectrum analysis, vector signal analysis,demodulation, and more including:WLAN spectrum and modulation transmitter measurements basedon IEEE 802.11 a/b/g/j/p/n/ac/ad/ay standardsBluetooth Transmitter Measurements based on Bluetooth SIG RFspecifications for Basic Rate, Low Energy, and Bluetooth 5. Somesupport of Enhanced Data RateSettling time measurements, frequency, and phase forcharacterization of wideband frequency-agile oscillatorsAdvanced Pulse analysis suite - automated pulse measurementsprovide deep insight into pulse train behavior. Measurement pulsestatistics over many acquisitions (millions of pulses).General purpose digital modulation analysis (SVM) providesmodulation analysis of 25 modulation typesFlexible OFDM analysis of custom OFDM signalsFrequency offset control for analyzing baseband signals with nearzero intermediate frequencies (IF)Offline analysis of waveforms captured by all Tektronix spectrumanalyzers and oscilloscopes standardAM/FM/PM modulation and audio measurements forcharacterization of analog transmitters and audio signalsReal-time recording and analysis with Tektronix RSA signalanalyzers (RSA7100, RSA600, RSA500, and RSA306 Series)standardSimple and complete APCO Project 25 transmitter compliancetesting and analysis for Phase 1 (C4FM) and Phase 2 (TDMA)Options to turn the 5/6 Series MSO or MDO4000B/C SeriesOscilloscopes into wide-band vector signal analyzers (VSAs) withup to 2 GHz analysis bandwidth using Connect (CON-SVPC).Playback of recorded files from the USB spectrum analyzers(RSA306, RSA500, and RSA600)LTE FDD and TDD Base Station (eNB) Transmitter RFmeasurementsAnalyze without acquisition hardware presentAutomated Phase Noise / Jitter measurementsAnalyze wideband designsSignal Classification and SurveyFree up instruments for further use while analysis occurs offlineMappingwww.tek.com 1
SignalVu-PC Vector Signal Analysis SoftwareApplicationsWideband radar and pulsed RF signalsFrequency agile communicationsBroadband satellite and microwave backhaul linksWireless LAN, Bluetooth, Commercial WirelessLand Mobile Radio (LMR), APCO P25EducationLong Term Evolution (LTE), CellularEMC/EMI pre-compliance and troubleshootingCapture with a variety of toolsCapture once - make multiple measurements without recapturing. Usingperformance oscilloscopes (MSO/DPO70000/SX/DX Series), up to fourchannels can be captured simultaneously; each of which can beindependently analyzed by SignalVu-PC software. Channels can be RF, Iand Q, or differential inputs. You can also apply math functions to theacquisition before analysis by SignalVu-PC. Acquisition lengths varydepending upon the selected capture bandwidth: full-bandwidthacquisitions can range from 1 ms to 25 ms depending upon model andoption selections. Real-time signal analyzer captures range from up to7.15 seconds at maximum acquisition bandwidth to several hours atreduced bandwidths.Connect with MSO5/6 or MDO4000 SeriesOscilloscopesWhen the Connect (CON-SVPC) option is installed, SignalVu-PC extendsthe functionality of either the MO4000B/C or 5/6 Series MSO (withhardware option SV-RFVT). The combination of hardware and softwaretransforms the 6 Series MSO into a wide-band vector signal analyzer (VSA)with up to 2 GHz capture bandwidth on up to 4 independent user-selectablechannels; or up to 500 MHz and 8 channels using a 5 Series MSO; or up to1 GHz on a single channel using the MDO4000B/C Oscilloscope.SignalVU-PC controls the MSO or MDO RF front-end, acquires the vectorcalibrated I/Q data, and makes wide-band, time-correlated, multi-domainmeasurements. You can analyze, correlate and troubleshoot issues in time,frequency, phase, amplitude, and even modulation.You can leverage the MSO or MDO triggering capability and extend yourdebugging work into system-level troubleshooting of your embedded RFdevices.AnalyzeSignalVu-PC vector signal analysis software uses the same analysiscapabilities found in the RSA5000 and RSA6000 Series real-time signalanalyzers.Time-correlated measurements can be made of frequency, phase,amplitude, and modulation versus time. This is ideal for signal analysis thatincludes frequency hopping, pulse characteristics, modulation switching,settling time, bandwidth changes, and intermittent signals.Acquisitions from the USB Spectrum Analyzers and all Tektronix MDO/MSO/DPO Series oscilloscopes, including the spectrum analyzer in theMixed Domain Oscilloscope can be analyzed with SignalVu-PC, addingdeep analysis capabilities to these broadband acquisition systems.Once captured into memory, SignalVu-PC provides detailed analysis inmultiple domains. The spectrogram display (bottom left panel) shows thefrequency of an LFM pulse changing over time. By selecting the point intime in the spectrogram during the On time of the pulse, the chirp behaviorcan be seen as it sweeps from low to high (upper right panel).2 www.tek.com
DatasheetTime-correlated, multi-domain view provides a new level of insight intodesign or operational problems not possible with conventional analysissolutions. Here, the hop patterns of a narrowband signal can be observedusing Spectrogram (upper right) and its hop characteristics can be preciselymeasured with Frequency vs Time display (bottom left). The time andfrequency responses can be observed in the two views right as the signalhops from one frequency to the next. All of the analysis shown above isavailable in the free base version of SignalVu-PC.Wideband satellite and point-to-point microwave links can be directlyobserved with SignalVu-PC analysis software. Here, general purposeDigital Modulation Analysis (SVM) is demodulating a 16QAM backhaul linkrunning at 312.5 MS/s.Optional applications tailored for your RFapplicationsThe base SignalVu-PC version ships free and enables real-time spectrumanalysis, RF power and statistics, spectrograms, amplitude, frequency andphase vs. time, and analog modulation measurements. Field-upgradeablesoftware options may be added, including pulse and OFDM analysis,general purpose modulation analysis, settling time, automated phase noisemeasurements, EMI pre-compliance, commercial standard analysis(WLAN, Bluetooth, LTE), playback of recorded files, and more.Settling time measurements (SVT) are easy and automated. The user canselect measurement bandwidth, tolerance bands, reference frequency(auto or manual), and establish up to 3 tolerance bands vs. time for Pass/Fail testing. Settling time may be referenced to external or internal trigger,and from the last settled frequency or phase. In the illustration, frequencysettling time for a hopped oscillator is measured from an external triggerpoint from the device under test.www.tek.com 3
SignalVu-PC Vector Signal Analysis SoftwareWLAN sub 6 GHz Wi-Fi transmitter testingWith the WLAN measurement applications, you can perform standardsbased transmitter measurements in the time, frequency, and modulationdomains.SV23 supports IEEE 802.11a, b, g, j and p signalsSV24 supports 802.11n 20 MHz and 40 MHz SISO signalsSV25 802.11ac 20/40/80/160 MHz SISO signalsSV2C is a bundle of Connect (CON) to MDO4000C Series and all theWLAN measurement applications described above (SV23, SV24 andSV25)All modulation formats, as shown in the following table can be measured.Standard Std )802.112012 section802.11bDSSS HR/ 2.4 GHzDSSSDSSS/CCK111 MbpsDBSK,20 MHzDQPSKCCK5.5M,CCK11M16 & 17802.11gERPDSSS/CCK/PBCC133 MbpsBPSKDQPSK17802.11aOFDM2.4 GHz5 GHz802.11g2.4 GHz802.11j/p5 GHzOFDM 64 BPSK 54 Mbps QPSK16QAM64QAM20 MHz20 MHz1820 MHz195, 10,20 MHz1820802.11nHT2.4 GHz & OFDM 64,5 GHz128 150 MbpsBPSKQPSK16QAM64QAM20 ,40 MHz802.11acVHT5 GHzBPSKQPSK16QAM64QAM256QAM20, 40, 80, 22160 MHz4 www.tek.comOFDM 64,128, 256,512 867 MbpsThe WLAN presets make the Error Vector Magnitude (EVM), Constellation,and Spectral Emission Mask (SEM) measurements push-button. Inaddition, you can download the WLAN pre-compliance wizard to easily andquickly prepare for compliance regulatory tests. The Wizard automaticallymeasures Transmit Power, Occupied Bandwidth, Spectral Power Density,Spectral Emission Mask and Spurious Emission Mask.The WLAN RF transmitter measurements are defined by the IEEE 802.112012 revision of the standard. Analysis of 1024-QAM 802.11ac signals isalso possible.
DatasheetEasy analysis of WLAN 802.11ac transmitter with a WLAN preset that provides spectralemission mask, constellation diagram, and decoded burst information.www.tek.com 5
SignalVu-PC Vector Signal Analysis SoftwareBluetooth transmitter testingTwo options have been added to help with Bluetooth SIG standard basetransmitter RF measurements in the time, frequency and modulationdomains. Option SV27 supports Basic Rate and Low Energy Transmittermeasurements defined by RF.TS.4.2.0 and RF-PHY.TS. 4.2.0 TestSpecification. It also demodulates and provides symbol information forEnhanced Data Rate (EDR) packets. Option SV31 supports Bluetooth5 standards (LE 1M, LE 2M, LE Coded) and measurements defined in theCore Specification. Both options also decode the physical layer data that istransmitted and color-encode the fields of packet in the Symbol Table forclear identification.Pass/Fail results are provided with customizable limits and the Bluetoothpresets make the different test set-ups push-button.Below is a summary of the measurements that are automated with optionSV27 and SV31 (unless noted):Bluetooth Low Energy (BLE) Transmitter MeasurementsOutput power at NOC TRM-LE/CA/01/C and at EOC TRM-LE/CA/02/CIn-band emission at NOC TRM-LE/CA/03/C and at EOC TRM-LE/CA/04/CModulation characteristics TRM-LE/CA/05/CCarrier frequency offset and drift at NOC TRM-LE/CA/06/C and atEOC TRM-LE/CA/07/CBasic Rate Transmitter MeasurementsOutput power TRM/CA/01/CPower Density TRM/CA/02/C (no preset)Power Control TRM/CA/03/C (no preset)Tx output Spectrum – Frequency Range TRM/CA/04/C (no preset)Easy validation of Bluetooth transmitter with push button preset, pass/fail information andclear correlation between displays.MappingWhen paired with the Alaris Smart Antenna (DF-A0047) with electroniccompass, and battery-powered RSA500 Series (with built-in GPStransceiver) or RSA306B (with third party GPS dongle), the Mapping (MAP)application enables interference hunting, spectrum clearing, coveragemapping, surveying, and triangulation on signal sources.Locate interference with an azimuth function that lets you draw a line or anarrow on a mapped measurement to indicate the direction your antennawas pointing when you took a measurement. You can also create anddisplay measurement results and labels.Tx output spectrum - 20 dB Bandwidth TRM/CA/05/CTx output spectrum - Adjacent Channel Power TRM/CA/06/CModulation characteristics TRM/CA/07/CInitial carrier frequency tolerance TRM/CA/08/CCarrier frequency-drift TRM/CA/09/CThe following additional information is also available with SV27 and SV31:symbol table with color coded field information, constellation, eye diagram,frequency deviation vs time with highlighted packet and octet, frequencyoffset and drift detailed table, as well as packet header field decoding.Markers can be used to cross-correlate the time, vector and frequencyinformation.Mapped channel power readings using the azimuth function.6 www.tek.com
DatasheetLTE FDD and TDD base station transmitterRF testingWiGig IEEE802.11ad/ay 60 GHz Wi-Fitransmitter testing (offline analysis)Option SV28 enables the following LTE measurements:Options SV30NL-SVPC and SV30FL-SVPC provide offline analysis forWiGig IEEE802.11ad/ay IC characterization. However, TektronixDPO70000SX Series oscilloscope with option SV30 installed can be usedfor full online 60 GHz measurements and analysis using SignalVu. Formore details, refer to SignalVu-PC vs. SignalVu section of this document.Cell IDChannel PowerOccupied BandwidthAdjacent Channel Leakage Ratio (ACLR)Spectrum Emission Mask (SEM)Transmitter Off Power for TDDReference Signal PowerThere are four presets to accelerate pre-compliance testing and determinethe Cell ID. These presets are defined as Cell ID, ACLR, SEM, ChannelPower and TDD Toff Power. The measurements follow the definition in3GPP TS Version 12.5 and support all base station categories, includingpicocells and femtocells. Pass/Fail information is reported and all channelbandwidths are supported.The Cell ID preset displays the Primary Synchronization Signal (PSS) andthe Secondary Synchronization Signal (SSS) in a Constellation diagram. Italso provides Frequency Error and Reference Signal (RS) Power.The ACLR preset measures the E-UTRA and the UTRA adjacent channels,with different chip rates for UTRA. ACLR also supports Noise Correctionbased on the noise measured when there is no input. Both ACLR and SEMwill operate in swept mode (default) or in faster single acquisition if theinstrument has enough acquisition bandwidth.SV30 installed on an oscilloscope provides significant margin in EVMperformance compared to what is required by the standard. Both ControlPHY (802.11ad) and Single Carrier PHY (802.11ad and 802.11ay) aresupported and provides analysis of 802.11ay 2.16 GHz packets or4.23 GHz adjacent 2-channel bonded packets.Testing and verification can be done on IF and RF setups. RF power,Received Power Indicator (RCPI), Frequency error (Max, Average, Std.Deviation), DC Offset, IQ DC origin offset, IQ Gain and Phase imbalance,Signal Quality, and estimated SNR measurements are reported in theSummary display. Pass/Fail results are reported using customizable limitsand the presets make the test set-up push-button.For further insight into the signal, color coding is available in the userinterface, allowing you to visualize the EVM spread across the analyzedpacket with color codes differentiating regions. You can also view thedemodulated symbols in tabular form with different color codes and with anoption to traverse to the start of each region for easier navigation.WiGig IEEE802.11ad/ay transmitter testing (offline analysis)Modulation formatsFast validation of LTE base station transmitter with push button preset, and pass/failinformation802.11ad: MCS0-12.6802.11ay: MCS1-21802.11ad/ay Single carrier: π/2 BPSK,π/2 QPSK, π/2 16QAM, π/2 64QAM802.11ad Control PHY: π/2 DBPSKwww.tek.com 7
SignalVu-PC Vector Signal Analysis SoftwareMeasurementsDisplaysRF output power, Received ChannelPower Indicator (RCPI), Estimated SNR,Frequency Error, Symbol Rate Error, IQOrigin Offset, IQ Phase Imbalance, IQGain Imbalance, IQ Quadrature Error,EVM results for each packet region(STF, CEF, Header and Data). Packetinformation includes the Packet type,Preamble, Synchronization Word orAccess Code, Packet Header, Payloadlength, and CRC details.Constellation, EVM vs Time, SymbolTable, SummarySignal surveyThe signal classification application (SV54) enables expert systemsguidance to aid the user in classifying signals. It provides graphical toolsthat allow you to quickly create a spectral region of interest, enabling you toclassify and sort signals efficiently. The spectral profile mask, when overlaidon top of a trace, provides signal shape guidance, while frequency,bandwidth, channel number, and location are displayed allowing for quickchecks. WLAN, GSM, W-CDMA, CDMA, Bluetooth standard and enhanceddata rate, LTE FDD and TDD, and ATSC signals can be quickly and simplyclassified. Databases can be imported from your H500/RSA2500 signaldatabase library for easy transition to the new software base.Playback of recorded filesWith SV56, playback of recorded files from one of the USB spectrumanalyzers is possible. Playback of recorded signals can reduce hours ofwatching and waiting for a spectral violation to minutes at your deskreviewing recorded data. Recording length is limited only by storage mediasize and recording is a basic feature included in SignalVu-PC. SignalVu-PCSV56 Playback allows for complete analysis by all SignalVu-PCmeasurements, including DPX Spectrogram. Minimum signal durationspecifications are maintained during playback. AM/FM audio demodulationcan be performed. Variable span, resolution bandwidth, analysis length,and bandwidth are all available. Frequency mask testing can be performedon recorded signals up to 40 MHz in span, with actions on mask violationincluding beep, stop, save trace, save picture, and save data. Portions ofthe playback can be selected and looped for repeat examination of signalsof interest. Playback can be gap-free, or time gaps can be inserted toreduce review time. A Live Rate playback ensures fidelity of AM/FMdemodulation and provides a 1:1 playback vs. actual time. Clock time of therecording is displayed in the spectrogram markers for correlation to realworld events. In the illustration below, the FM band is being replayed, witha mask applied to detect spectral violations, simultaneous with listening tothe FM signal at the center frequency of 92.3 MHz.Above is a typical signal survey. This survey is of a portion of the TV broadcast band,and 7 regions have been declared as either Permitted, Unknown, or Unauthorized, asindicated by the color bars for each region.In this illustration, a single region has been selected. Since we have declared this to bean ATSC video signal, the spectrum mask for the ATSC signal is shown overlaid in theregion. The signal is a close match to the spectrum mask, including the vestigial carrierat the lower side of the signal, characteristic of ATSC broadcasts.SignalVu-PC with mapping can be used to manually indicate the azimuth ofa measurement made in the field, greatly aiding in triangulation efforts. Theaddition of a smart antenna able to report its direction to SignalVu-PCautomates this process. Automatically plotting the azimuth/bearing of ameasurement during interference hunting can greatly speed the time spentsearching for the source of interference. Tektronix offers the Alaris DFA0047 handheld direction finding antenna with frequency coverage from20 MHz -8.5 GHz (optional 9 kHz-20 MHz) as part of a completeinterference hunting solution. All SignalVu-PC data streams include timestamp information for effective data logging and coherent signal analysisapplications. Full specifications for the DF-A0047 antenna are available in aseparate antenna datasheet available on www.Tektronix.com.8 www.tek.com
DatasheetAdvanced Pulse analysisThe Advanced Pulse Analysis package (SVP) provides 31 individualmeasurements to automatically characterize long pulse trains. An 850 MHzwide LFM chirp centered at 3.85 GHz is seen here with measurements forpulses 7 through 14 (top right). The shape of the pulse can be seen in theAmplitude vs. Time plot shown in the upper left. Detailed views of pulse#8's frequency deviation and parabolic phase trajectory are shown in thelower two views.Automated phase noise and jittermeasurementsPhase noise degrades the ability to process Doppler information in radarsystems and degrades error vector magnitude in digitally modulationcommunication systems. Automated phase noise and jitter measurementswith a spectrum analyzer (PHAS) may reduce the cost of yourmeasurements by reducing the need for a dedicated phase noise analyzer.Shown below, the phase noise of a 1 GHz carrier is measured at -133 dBc/Hz at 10 kHz offset. Single-sideband phase noise is displayed in dBc/Hzversus offset frequencies from carrier, shown in trace or tabular form: one Peak trace (in blue) and one average trace (in yellow). Trace smoothingand averaging is supported.The RSA7100B's intrinsic phase noise of -134 dBc/Hz, at this frequencyand across its operating range, provides ample measurement margin for avast majority of applications.Applications include testing VCO phase noise, oscillator phase noise, clocksource jitter, signal generator phase noise, and more. The Tektronix phasenoise / jitter application, when combined with DPX signal processing,provides a powerful solution for designing and troubleshooting momentarilyunstable signal sources.Cumulative statistics provides timestamps for Min, Max values as well as Peak to Peak,Average and Standard deviation over multiple acquisitions, further extending theanalysis. Histogram shows you outliers on the right and left.The phase noise application performs automated carrier tracking,averaging, and dynamic measurement bandwidth adjustment, providing theaccuracy and speed of measurement needed at all carrier offsets - rangingfrom 10 Hz to 1 GHz. Results are available in log-frequency trace or tabularform with pass/fail limits on-screen or via programmatic control. Integrationlimits are programmable for RMS phase noise, jitter, and residual FM. Thelow instrument phase noise of the RSA7100B together with thismeasurement application allows for high-performance phase noisemeasurements at frequencies up to 26.5 GHz.Pulse-Ogram displays a waterfall of multiple segmented captures, with correlatedamplitude vs time and spectrum of each pulse. Can be used with an external trigger toshow target range and speed.www.tek.com 9
SignalVu-PC Vector Signal Analysis SoftwareAPCO P25 compliance testing andanalysis application (SV26)Complete set of push-buttonTIA-102 standard-based transmittermeasurements with pass/fail resultsincluding ACPR, transmitter power andencoder attack times, transmitterthroughput delay, frequency deviation,modulation fidelity, symbol rateaccuracy, and transient frequencybehavior, as well as HCPM transmitterlogical channel peak ACPR, off slotpower, power envelope, and timealignment.Bluetooth Basic LE TX SIGmeasurements (SV27)Presets for transmitter measurementsdefined by Bluetooth SIG for Basic Rateand Bluetooth Low Energy. Results alsoinclude Pass/Fail information.Application also provides Packet HeaderField Decoding and can automaticallydetect the standard including EnhancedData Rate.Bluetooth 5 measurements (SV31)Bluetooth SIG measurements forBluetooth Low Energy version 5. Resultsalso include Pass/Fail information.Application also provides Packet HeaderField Decoding of LE Data Packets.SV31 requires SV27.AM/FM/PM modulation and audiomeasurements(SVA)Carrier power, frequency error,modulation frequency, modulationparameters ( peak, peak-peak/2, RMS),SINAD, modulation distortion, S/N, THD,TNHD, hum and noise.Settling time (frequency and phase)(SVT)Measured frequency, Settling time fromlast settled frequency, Settling time fromlast settled phase, Settling time fromtrigger. Automatic or manual referencefrequency selection. User-adjustablemeasurement bandwidth, averaging,and smoothing. Pass/Fail mask testingwith 3 user-settable zones.Advanced Pulse analysis(SVP)Pulse-Ogram waterfall display ofmultiple segmented captures, withamplitude vs time and spectrum of eachpulse. Pulse frequency, DeltaFrequency, Average on power, Peakpower, Average transmitted power,Pulse width, Rise time, Fall time,Repetition interval (seconds), Repetitioninterval (Hz), Duty factor (%), Duty factor(ratio), Ripple (dB), Ripple (%), Droop(dB), Droop (%), Overshoot (dB),Overshoot (%), Pulse- Ref Pulsefrequency difference, Pulse- Ref Pulsephase difference, Pulse- Pulsefrequency difference, Pulse- Pulsephase difference, RMS frequency error,Max frequency error, RMS phase error,Max phase error, Frequency deviation,Phase deviation, Impulse response (dB),Impulse response (time), Time stamp.The previous figure shows the RSA7100B typical and nominal phase noiseperformance.Education licenseQualified educational facilities can cost-effectively use SignalVu-PC inteaching environments. The specially priced education version includes allavailable analysis standard and provides results watermarked 'EducationVersion'.Measurement functionsSpectrum analyzer measurements(base software)Time domain and statisticalmeasurements(base software)Channel power, Adjacent channelpower, Multicarrier adjacent channelPower/Leakage ratio, Occupiedbandwidth, xdB down, Markermeasurements of power, delta power,integrated power, power density, dBm/Hz, and dBc/Hz, Signal strength withaudible feedback.RF IQ vs time, Amplitude vs time, Powervs time, Frequency vs time, Phase vstime, CCDF, Peak-to-Average ratio,Amplitude, Frequency, and Phasemodulation analysis.Automated phase noise / jitterCarrier power, Frequency error, RMSmeasurements (PHAS) (RSA7100 only) phase noise, Jitter, Residual FM.WLAN 802.11a/b/g/j/p measurementapplication (SV23)WLAN 802.11n measurementapplication (SV24)WLAN 802.11ac measurementapplication (SV25)10 www.tek.comAll of the RF transmitter measurementsas defined in the IEEE standard, and awide range of additional scalarmeasurements such as CarrierFrequency error, Symbol Timing error,Average/peak burst power, IQ OriginOffset, RMS/Peak EVM, and analysisdisplays, such as EVM and Phase/Magnitude Error vs time/frequency or vssymbols/ subcarriers, as well as packetheader decoded information and symboltable.SV24 requires SV23.SV25 requires SV24.
DatasheetFlexible OFDM analysis(SVO)OFDM analysis with support for WLAN802.11a/g/j and WiMAX 802.16-2004.Constellation, Scalar measurementsummary, EVM or power vs carrier,Symbol table (Binary or Hexadecimal).General purpose digital modulationanalysis(SVM)Error vector magnitude (EVM) (RMS,Peak, EVM vs Time), Modulation errorratio (MER), Magnitude Error (RMS,peak, mag error vs time),Phase error(RMS, Peak, Phase error vs time),Origin offset, Frequency error, Gainimbalance, Quadrature error, Rho,Constellation, Symbol table.FSK only: Frequency deviation, Symboltiming error.Playback of recorded files (SV56)Playback of files recorded with one ofthe USB spectrum analyzers (RSA306,RSA500, or RSA600). Controls for fileselection, begin/end points. Ratecontrols for gap-free or live-rateplayback.LTE Downlink RF measurements (SV28) Presets for Cell ID, ACLR, SEM,Channel Power and TDD Toff Power.Supports TDD and FDD frame formatand all base stations defined by 3GPPTS version 12.5. Results include Pass/Fail information. Real-Time settingsmake the ACLR and the SEMmeasurements fast, if the connectedinstrument has required bandwidth.WiGig IEEE 802.11ad/ay (SV30)(For offline analysis only. Real-time60 GHz measurements can be madewith Opt. SV30 on DPO70000SX Seriesoscilloscopes.)Presets for Control PHY (802.11ad) andSingle Carrier PHY (802.11ad and802.11ay). The 802.11ay analysisresults are shown for the EDMG,PreEDMG1, and PreEDMG2 regions.The 802.11ad preset measures EVM ineach of the packet fields per thestandard, and decodes the headerpacket information. RF power, ReceivedChannel Power Indicator, Frequencyerror, IQ DC origin offset, IQ Gain andPhase imbalance are reported in theSummary display. Pass/Fail results arereported using customizable limits.CISPR Detectors (Quasi Peak andAverage) (SVQP)This option enables CISPR Quasi Peakand Average detectors (defined perCISPR16) in Spectrum and Spuriousdisplays.EMC/EMI pre-compliance andtroubleshooting (EMCVU)This option supports many predefinedlimit lines. It also adds a wizard for easysetup of recommended antennas, LISN,and other EMC accessories with a onebutton push. When using the new EMCEMI display, you can accelerate the testby applying the time consuming quasipeak only on failures. This display alsoprovides a push-button ambientmeasurement. The Inspect tool lets youmeasure frequencies of interest locally,removing the need for scanning.www.tek.com 11
SignalVu-PC Vector Signal Analysis SoftwareSpecificationsPerformance (typical)The following is typical performance of SignalVu-PC analyzing acquisitions from any MSO/DPO5000, DPO7000, DPO70000SX, or DPO/DSA/MSO70000 Series oscilloscopes.Vector modulation analysis is provided for the MDO4000B/C spectrum analyzer acquisitions. All other MDO spectrum analysis specifications are available in the MDO4000Series datasheet. No published performance is available for 5/6 Series MSO, MSO/DPO2000, MDO/MSO/DPO3000, and MDO4000 Series oscilloscope acquisitions.Performance for SignalVu-PC when used with the RSA7100 real-time spectrum analyzer and the RSA306, RSA500, RSA600 USB real time spectrum analyzers are shownrespectively in the RSA7100, RSA306, RSA500, and RSA600 datasheets.Frequency-relatedFrequency rangeSee appropriate oscilloscope data sheetInitial center frequency setting Equal to time-base accuracy of oscilloscopeaccuracyCenter frequency settingresolution0.1 HzFrequency offset range0 Hz to the maximum bandwidth of the oscilloscopeFrequency marker readoutaccuracy (Reference Frequency Error Mark
wideband radar, high data rate satellite links, wireless LAN or frequency-hopping communications, the SignalVu-PC comprehensive suite of tools and application software can speed your time-to-insight by showing you the time-variant behavior of these signals. Key features Multi-domain tool set for spectrum analysis, vector signal analysis,