Transcription
Reporting StrategiesYour Guides:Robert Newell and Clayton Reynolds
AgendaREPORTING STRATEGYINTRODUCTIONCA PPM REPORTINGOPTIONSEXTERNAL BI TOOLS /USE WITH CA PPMBEST PRACTICES2
3Reporting StrategyIntroduction
Industry Trends & The Future of BI Data and analytics as a core business function D&A is now making the shift into a core business function, rather than a secondary activity. D&A now isa shared business asset aligned to business results. Gartner noted that D&A silos break down because ofbetter collaboration between central and federated D&A teams. Graph relates everything Graphs form the foundation of most modern data and analytics capabilities and are reliant on thefoundation to find relationships between people, places, things, events and locations across a widevariety of data assets. D&A leaders rely on graphs as quick answers to complex business questions,which require contextual awareness and an understanding of the nature of connections and strengthsacross multiple entities. Gartner predicts that by 2025, graph technologies will be used in 80% of data and analytics innovations,up from 10% in 2021, facilitating rapid decision making across the organization. Augmented Analytics Machine LearningAugmented data preparationVisual-based data discoveryAutomated advanced analyticsNatural Language Processing4
Evolution of Business IntelligenceSolutions suggested;recommendscorrective actionPredictiveShowcase exceptions;where action needsto be takenData is summarizedfor easy, quickviewingRaw data with nointelligence st of today’s reportingfalls within these threePredict problemsbefore theyhappen (PredictiveAnalytics, MachineLearning)Intervene and fixissuesautomatically(AI)
Example: Resource AllocationsSuggest how work could berebalanced amongst teammembers, or tasks/projectscould be ed over/underallocationUtilization by Role, orby OBSSolutionsRaw allocation dataExceptionsSummarizedRawBased on historicaldata on teammembers, pastprojects, andrecent timesheets,suggest whereover/underallocation is likelyto occurAuto-rebalance work amongstteam members, automaticallymove task dates, and updateresource allocations allwithout human intervention
7CA PPM Reporting Options
8OOTB Reporting Tool - Flexibility vs EffortVeryJaspersoft Studio ReportsJaspersoft DashboardsPortletsJaspersoft Ad-HocLittleFlexibilityLowEffortHighEffort
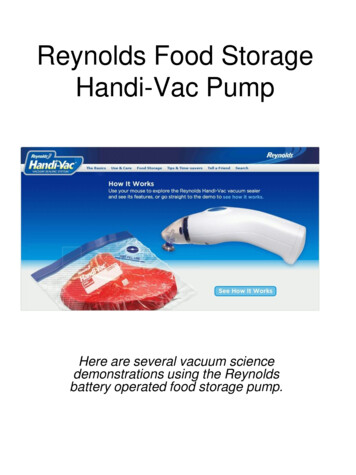
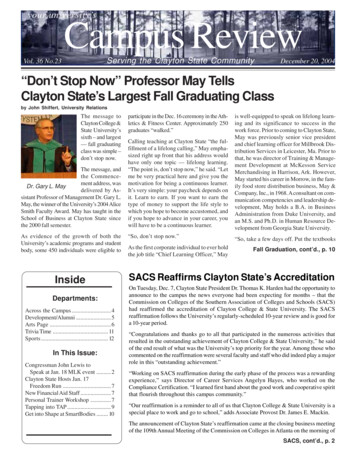
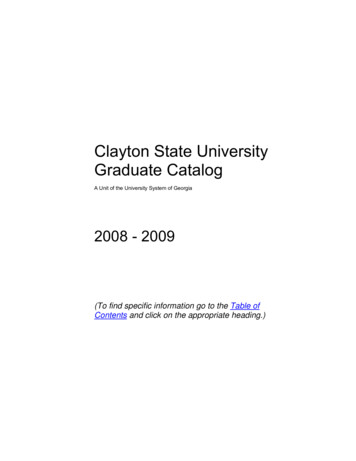
OOTB Reporting ToolsPortletsDashboards (Jaspersoft)Studio Reports (Jaspersoft)Ad-Hoc (Jaspersoft) Data wholly resides in Clarity Reports are operational, used day to day. Data is rendered within acceptableperformance thresholds The data does not need to be accessed by nonclarity users The number of data elements required does notnegatively affect the usability. Personalization features Summary level information that can befurther drilled into Dashboards provide an easy-to-read interface Dashboards provide interactive viewing, and drilldown capabilities Data wholly resides in ClarityPDF Format neededFormat requires advanced formattingReport access outside of Clarity required Data wholly resides in Clarity PDF Format needed Used for ‘on the fly’ reporting Archiving is required Multiple reports required and presented as asingle package Large number of calculations NOTE: Ad Hoc reports are best suited for‘super-users’ who have an understanding ofthe underlying data.9
Real World Example - Portlets10
Portlets in the Modern UX In the Modern UX, custom portlets are – to an extent – being replaced by aheavy focus on personalization. Channels still leveraged for classic portlet dashboards.11
Real World Example – Jaspersoft Studio Reports12
Real World Example – Jaspersoft Ad Hoc13
Recent Jaspersoft Improvements 15.3 Re-Introduction of Reports and Jobs – moving the ability to quickly access and schedule reports outof the Advanced Reporting link Ability to have “My Reports” again Jaspersoft reports now utilize the Parameters native to CA PPM The ability to run a report via the Actions menu on an Object is back 15.4 New version of Jaspersoft (6.4.2) Running reports via Reports / Jobs output can now output to XLS (previously just ppt and pdf) Dashboard enhancements 15.5.1 New version of Jaspersoft (7.1) New Roadmap Timeline report 15.6 New trending reports14
15External BI Tools
Enterprise BI Many organizations have an enterprise BI toolwithin their reporting landscape, and it isimportant to establish how CA PPM fits into thereporting solution. Gartner magic quadrant BI platforms include: Microsoft PowerBI Tableau Qlik View If you are an on-premise implementation youcan connect directly to the built-in datawarehouse If you are a SaaS implementation, you haveseveral options for connecting: Flat file extracts & report directly against files Flat file or API-based extracts loaded into on-premiseor cloud database (3rd party ETL tools help) OData ConnectionNOTE: Recommended to use Power BI, as OData support inTableau and Spotfire is limited16
OData Direct Connection As of 15.3, on Demand customers have theability to use an OData connector to point a BItool at the CA PPM DWH. This will enable theuse for Spotfire, Tableau, PowerBI, QlikView, etc The connector will only go against the updatedData Warehouse The connector was optimized to work withPowerBI, but can used with other reporting BItools – even Microsoft ExcelNOTE: Recommended to use Power BI, as ODatasupport in Tableau and Spotfire is limited Row level security possible with custom BI UserID on the CA PPM Resource In 15.4, CA added the ability to have individuallogins for OData access17
Rego Data Extractor Extract data using SQL language Create and schedule multiple extractions depending on business need Flexible options Batch data for large exports Zip files Custom data and line separators Dynamic filenames with flexible date formatting Flexible distribution of extracts including email and Knowledge Store Performance metrics The amount of data extracted Time of extraction Success Failures Test cases for extracts up to 40 million records per day 100 extracts per day18
Real World Example - PowerBI19
Real World Example - Tableau20
21Best PracticeRecommendations
Diverse StrategyIn most cases, the reality is not a single reporting solution, but a mix of tools Case 1 (SaaS, 1,000 Users) Portlets – data governance & exception reporting Jaspersoft Ad-Hoc – end user ad-hoc requests, semi-”standard” Enterprise BI (Tableau) – Standard reports / dashboards Case 2 (SaaS, 200 Users) Mostly OOTB or RegoXchange portlets and Jaspersoft reports Set of executive-level PowerBI dashboards using OData connection Case 3 (On-Prem, 5,000 Users) Built on on-premise DWH. Data extracted from CA PPM, VersionOne, JIRA, ServiceNow, etc. Instead of integrating tools, combined on the reporting side Not a single enterprise BI tool, but tool agnostic – PowerBI, Excel, Cognos all pointing to thesame DWH22
23Best Practices With any report, identify the top question(s) thatthe report should answer Having people go into the tool to pull out extractsand fish for the data Use the right report technology for the job (Portlets,Jaspersoft, Enterprise, etc.) Developing reports that have too many datacolumns, which can cause the report to lose itspurpose Converting excel reports that are alreadyoperationalized and moving them into the tool cangain big benefits Having scenarios where the user is taking a reportfrom the system, copying and pasting parts of it intoa ppt/excel, and generating another report outsideof the tool Creating different versions of the same report fordifferent business units. This should be handledwith thoughtful filters Creating reports with data that is inconsistent withother systems, and not having a clear understandingof ownership of data Automation of report delivery Having leadership adopt the tool and utilize thetool's dashboards (eventually moving away from"receiving" dashboards to "using" dashboards) Ensure that the reports are designed for ‘EasyReading’ Ensure the data definition of data is the uniform forall reportsWhat WorksWhat Doesn’t
24Questions?Let Rego be your guide.
Thank You For Attending regoUniversityInstructions for PMI credits Let us know how we can improve!Don’t forget to fill out the class survey.Access your account at pmi.orgClick on CertificationsClick on Maintain My CertificationClick on Visit CCR’s button under the Report PDU’sClick on Report PDU’sClick on Course or TrainingClass Name regoUniversityCourse Number Session NumberDate Started Today’s DateDate Completed Today’s DateHours Completed 1 PDU per hour of class timeTraining classes TechnicalClick on I agree and mWebsitewww.regouniversity.comLet Rego be your guide.25
important to establish how CA PPM fits into the reporting solution. Gartner magic quadrant BI platforms include: Microsoft PowerBI Tableau Qlik View If you are an on-premise implementation you can connect directly to the built-in data warehouse If you are a SaaS implementation, you have several options for connecting: