Transcription
Asset Management Plan2015-2018AT Asset Management Plan 2015 - 2018AT Asset Management Plan 2015 - 2018
Foreword2015 – 2018 Asset Management PlanAuckland Transport (AT) manages the largest and most strategically important urban transportnetwork in New Zealand, serving a city of 1.5 million people representing one third of New Zealand’spopulation and 35 per cent of the national economy.AT manages 16.5 billion of mainly road and public transport assets and this Asset Management Plandemonstrates that these assets are being managed in a prudent, efficient and forward-lookingmanner.The efficient management and growth of this network and its services is essential to the social andeconomic wellbeing of New Zealand’s largest city and consequently is vitally important to theeconomic well-being of New Zealand as a whole.For AT, it is not just a matter of optimising the value and efficiency of the networks and systemsalready in place, but also effectively managing the overall condition of the network and planning futureservices to meet the needs of Auckland’s rapidly increasing population.This document details the strategies and management systems deployed by AT and sets out thefuture renewals and maintenance investment required to continue building the assets, infrastructureand delivery systems of a transformational, sustainable and affordable urban transport service. It alsoaddresses the shortfalls that will begin to accrue if budgets are not sustainable over the medium tolong term.This plan notes that the renewals funding required to maintain current levels of service fromAuckland’s transport assets over the coming 10 years has been assessed at 3.44 billion, which is 930 million more than the 2.51 billion approved in Auckland Council’s 2015-2025 Long Term Plan.While this will be sufficient over the next three years, beyond that the situation will deteriorate and by2025 more than nine per cent of assets will be in very poor condition, comparing unfavourably withthe current situation where less than one per cent of assets that are in a very poor condition, madepossible with renewals funding of 3.44 billion.The network maintenance and asset operations funding provided for the next 10 years is 1.86 billion,which is aligned to historic levels of expenditure, but does not reflect the increasing demands of agrowing city. It also does not reflect the increased requirement for maintenance that will arise from thereduced level of renewal investment from 2019 onwards.Network maintenance and operational budgets should increase by about 1.5 per cent a year to keeppace with growth-led demand. Simultaneously, AT must ensure that this does not compromise theprudent management of on-going asset deterioration, considering that depreciation of the network iscurrently running at a rate of 261 million a year (or 715,000 a day).Renewals and maintenance funding constraints will result in a lower quality transport network in themedium to long term. This will challenge the expectation of AT, and its intent, to proactively managethe network to an appropriate standard aligned to the outcome it is required to deliver and which isexpected in one of the world’s most liveable cities. It will also increasingly focus on what will becomethe growing maintenance needs of a deteriorating network.To avoid AT precipitating an unsustainable deterioration in asset condition that will have to beaddressed in the future (and possibly by future generations), AT will need to confront these issues inthe 2018 - 2021 AMP and prudently manage any adverse effects that result.AT Asset Management Plan 2015 - 2018AT Asset Management Plan 2015 - 2018
Three years is not a long time when managing assets with a lifespan of decades. Accordingly, AT hasuntil 2018 to work with its funding partners Auckland Council and NZ Transport Agency to develop asustainable Asset Management Plan, in which renewals and maintenance funding needs are clear,investment is optimised and the trade-offs between cost, risk and levels of service are transparent.This plan sets out the issues and choices and provides the starting point from which to tackle thechallenges and costs of maintaining AT’s network assets for the benefit of current and futuregenerations.Dr Lester Levy, CNZMDr David WarburtonChairmanAuckland TransportChief ExecutiveAuckland TransportAT Asset Management Plan 2015 - 2018AT Asset Management Plan 2015 - 2018
QualityrecordORIGINATORAuckland TransportStrategic Asset Management and SystemsInfrastructure DivisionCONTRIBUTORSDilip DattaBrett ElstonAndy FinchThisula KithulagodaRobert McSpaddenMichael MasonVikram NallaMay OoAnna PercySiri RangamuwaDeepa SearesGlen SyredGerri WaterKampAsset management plan document setStrategic summaryAsset management plan – overviewAsset class management plans (14)Asset risk management planAT Asset Management Plan 2015 - 2018AT Asset Management Plan 2015 - 2018(This document)
Table of contentsExecutive summary .9Key elements of this plan .221.Infrastructure asset management .272.The transport asset portfolio . .353.Outcomes and levels of service . .454.Growth and demand .695.Risk management .776.Sustainability .917.Asset investment requirements .998.Funding and impacts 113Appendices1.Legislative requirements .1232.Notes, assumptions and limitations of financial information .1243.Detailed financial tables .1254.Asset class management plan summaries .137Road network4.1Pavement .1394.2Stormwater .1454.3Footpaths and cycleways .1514.4Bridges and major culverts 1594.5Walls (seawalls, noise walls and retaining walls) .1654.6Parking .1714.7Traffic systems (signals, signs and markings) 1774.8Street lighting .1854.9Corridor structures and fixtures 191Public transport network4.10 Rail stations and depots/ stabling 1974.11 Rolling stock (trains) .2034.12 Wharves .2094.13 AT HOP .2154.14 Bus network 221Bibliography 227AT Asset Management Plan 2015 - 2018
AT Asset Management Plan 2015 - 2018
Executive summaryContextAuckland Transport (AT) was established in 2010 as a council-controlled organisation ofAuckland Council. Its purpose is to provide an effective, efficient and safe land transportsystem for the Auckland region, in the public interest (1).AT is responsible for 16.5 billion of assets, including road and public transport assets with areplacement value of 13.4 billion. These assets are summarised in Table 11, and make upthe essential transport infrastructure network that enables people and goods to move aroundAuckland.Over the next 30 years (the timeframe covered by this plan), Auckland’s population isexpected to grow from 1.5 million to over 2.2 million people. This includes 237,000 newresidents in the next 10 years, and a corresponding growth in jobs and businesses (2).This growth will mean that the costs of renewing, maintaining and operating Auckland’stransport network will increase, as new infrastructure is added to the network toaccommodate increasing demand.Scope and purpose of this planThis Asset Management Plan 2015–2018 (AMP) sets out how AT will manage the assetsthat it is responsible for within Auckland's transport network over the next 3 years, lookingforward 10 years in detail and 30 years in outline. A new AMP will be prepared in 2018.AT uses asset management planning as a mechanism for managing and maintaining thetransport assets it is responsible for.Asset management planning: ensures that network assets continue to provide the essential transport servicesthey were built for identifies the optimal maintenance, operations and renewals requirements forAuckland’s transport assets to provide the agreed levels of service sets out a recommended approach for managing asset risks and resilience forecasts the consequential renewals and operations impact of urban growth andnew transport investments recommends specifications for new assets so that they provide the best whole-oflife value.1Some transport assets are the responsibility of other agencies, and hence are not covered by this plan. Statehighways are managed by the New Zealand Transport Agency, and rail tracks and signals by KiwiRail.AT Asset Management Plan 2015 – 2018AT Asset Management Plan 2015 - 2018Page 9 of 139
Table1:SummaryoftransportassetsAT Asset Management Plan 2015 – 2018AT Asset Management Plan 2015 - 2018Replacement valueCurrent value7,302 kilometres roads 6.910 billion 4.724 billion12,000 km stormwaterchannel, 75,481 catch pits 2.341 billion 1.524 billion6,959 kilometres offootpaths,321 km of cycleways 0.865 billion 0.487 billion1,020 bridges and majorculverts 0.819 billion 0.441 billion3,735 sea walls and retainingwalls 0.318 billion 0.182 billion105,347 streetlights 0.194 billion 0.098 billion624 signalised intersections,road signs and markings 0.146 billion 0.080 billionCorridor structuresincluding. 1,457 seats,183km of fences and railings 0.171 billion 0.114 billion6 parking buildings872 pay and display units 0.210 billion 0.184 billion41 active rail stations,associated stabling anddepot 0.619 billion 0.478 billion57 electric trains (EMUs),10 Diesel Multiple Units 0.504 billion 0.496 billion21 ferry wharves 0.110 billion 0.058 billion6 Busway stations2,432 bus shelters 0.060 billion 0.046 billionAT HOP ticketing system 0.083 billion(inc software) 0.060 billion41 lifts and 16 escalators(included in asset values above)Page 10 of 139
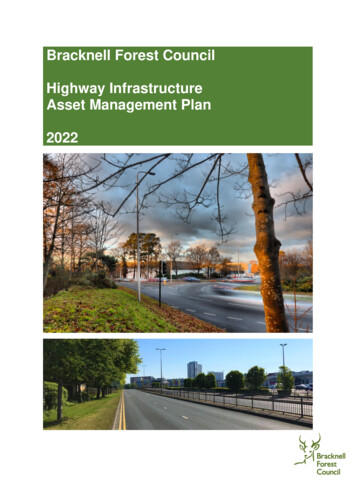
AT’s asset management approach and recommended transport programme, as set out inthis AMP, is a key input into the long term planning of AT and Auckland Council, and inparticular to AT’s Auckland Regional Land Transport Plan 2015–2025, which in turn informs: the transport content of Auckland Council’s Long-Term Plan 2015–2025 (thelong-term plan), including the 30-year Infrastructure Strategythe Auckland content of the New Zealand Transport Agency’s National LandTransport Programme 2015–2018.Network valuationAT’s transport network assets (excluding land) would cost 13.4 billion to replace, and aredepreciating by approximately 261 million annually or 715,000 per day. As shown inFigure 1, the current total depreciated value of the network is 8.97 billion, which means thatthe network overall has used 33 per cent of its ability to deliver future economic sat30June2014Levels of serviceLevels of service set out what the public can expect from transport assets, in terms of theirperformance, condition and role in providing a safe, effective and efficient transport network.The headline performance measure for levels of service is customer satisfaction; this isconsistent with AT’s strategic commitment to transforming and elevating customer focus andexperience.Customers are likely to be satisfied when the transport network is: safe: the network is safer, and feels safer for all users over time accessible: it is easy to access the network and get to your destination convenient: the network is easy to use and travelling is a pleasant experience reliable: travel times for people and freight are predictable and reliable resilient: when things go wrong, other travel options are available and access isquickly restored.Generally Aucklanders are satisfied with the level of service provided by their transportnetwork. Satisfaction with roads increased 2012-2014, and satisfaction with footpaths wasAT Asset Management Plan 2015 – 2018AT Asset Management Plan 2015 - 2018Page 11 of 139
stable, as shown in Figure 2. Satisfaction with PT services is high, but declined in 2014 dueto a range of factors including rapid patronage growth.Future targets aim to maintain current satisfaction levels for roads and footpaths through to2018 by ensuring that assets are maintained, operated and renewed as needed to deliver afit for purpose level of service. AT has set a target to improve customer satisfaction withpublic transport from 81.4 per cent (its current level) to 85 per cent through a combination ofasset and service ransportservicesThe customer satisfaction targets agreed between AT and Auckland Council through the2015 AT Statement of Intent are set out in Table 2Table2:CustomersatisfactiontargetsPerformance measureActual Actual2012/13 2013/14Statement ofintent/annualplan targets2014/15Long-term plan targets2015/16 2016/17 2017/182018/19–2024/25Customer satisfaction – roads68%71%70%70%70%70%70%Customer satisfaction – %84%85%85%60–65%60-65%60–65%Customer satisfaction – publictransportCustomer satisfaction – road63%New measure60%safetySource:AucklandCouncilLong- 3)Key technical performance measures that AT uses to monitor and support achievement of itscustomer satisfaction targets are shown in Table sPerformance measureChange from the previous financialyear in the number of fatalities andserious injury crashes on the localroad network, expressed as anumberAT Asset Management Plan 2015 – 2018AT Asset Management Plan 2015 - 2018Actual2012/13Actual2013/14429(year to31 Dec2013)StatementAuckland Council long-term planof intent/targetsannual plan2018/19–targets2015/16 2016/17 2017/182024/252014/152.66%reductionReduce Reduce ReduceReduce byfromby atby atby atat least 9previousleast 9least 9least 9yearPage 12 of 139
Performance measurePercentage of customer servicerequests relating to roads andfootpaths that receive a response2within specified time framesRoad maintenance standards (ridequality), as measured by smoothtravel exposure, for all urban andrural roadsActual2012/13Actual2013/1485%85%Rural 95Urban 85Rural 95Urban 85Percentage of the sealed local roadnetwork that is resurfacedStatementof intent/annual plantargets2014/157.6%Auckland Council long-term plantargets85%Rural 93Urban 838%8%85%85%Rural 92 Rural 91Urban 82 Urban 818%Percentage of footpaths inacceptable condition (as defined in99%99%99%99%AT’s AMP)Source:AucklandCouncilLong- 16(3)85%Decreasingto Rural 87Urban 778%8%99%98%Current condition of the network and recent trendsThe condition of any asset will deteriorate with use and over time. Over the past three years,AT has invested close to 200 million each year in asset renewals. At this level ofinvestment, asset condition has been maintained overall, and the proportion of assets in verygood, good or moderate condition is 97% as shown in Figure el(4)Assets in very poor condition often present higher levels of risk and require moremaintenance in order to provide suitable levels of safety and service.The two asset classes with the highest proportion of assets in very poor condition arewharves (4.4 per cent of assets) and road pavement (3.2 per cent). These are also the twogroups for which asset condition has improved the most over the past three years.2As defined in Auckland Transport’s customer service standards: two days for an incident investigation as a high priority; threedays for an incident investigation as a normal priority; and one hour emergency response time.AT Asset Management Plan 2015 – 2018AT Asset Management Plan 2015 - 2018Page 13 of 139
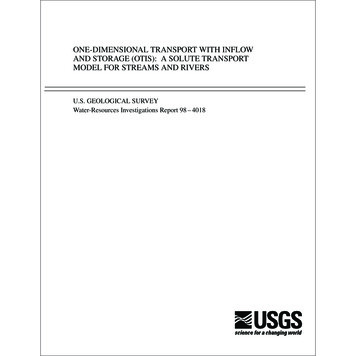
Identifying investment needsThe levels of investment required for transport assets, as identified in this AMP, derive fromthe lifecycle, level of service and risk outcomes that the assets are required to provide.AT uses best practice asset management tools to set appropriate levels of maintenance andrenewals activities for its assets, in order to deliver a safe network that meets customerexpectations at the lowest whole-of-life cost.Key drivers for the recommended investment in renewals and maintenance are: the need to protect the current investment in the network the need to manage and protect the service potential of the network new assets added to the road and PT networks each year to keep up with populationand business growth changing travel modes, and the council’s strategic aim of achieving atransformational shift in people’s preferred travel modes to public transport the need to deliver the required levels of service at the lowest whole-of-life cost the need to manage risk for critical infrastructure.Decisions about the actual level of investment that will be made in renewals, maintenanceand operations are made by AT’s two funders: Auckland Council and New ZealandTransport Agency.Auckland Council is the major funder, and its long term plan drives AT’s overall fundinglevels. The New Zealand Transport Agency also contributes funding to AT, with its decisionsguided by the Government Policy Statement on Land Transport 2015/2016–2024/2025.Renewals investment needsRenewals are essential, ongoing investments to replace assets before they fail. Timelyrenewal of the many assets that comprise the road and public transport networks isnecessary, in order to protect the current investment in the network, and manage safety,service, financial and reputational risk.AT’s recommended renewals programme is based on: optimising the benefits provided by assets, and minimising their whole-of-life costs,including maintenance and replacement costs delivering the required level of service, now and in the context of future growth reducing and managing the risk of asset failure.The renewals programme recommended in this AMP describes the long-term investmentneeded to provide sustainable asset condition and levels of service across the network.Total renewals funding recommended over 10 years, excluding the specific projects listedabove, is 2.88 billion in 2014/2015 dollars. Allowing for forecast inflation, the 10 year fundingrequired is 3.44 billion.The impact of implementing the recommended renewals programme would be to reduce theproportion of transport assets in very poor condition to less than 1 per cent, and to achieve aAT Asset Management Plan 2015 – 2018AT Asset Management Plan 2015 - 2018Page 14 of 139
gradual improvement in the condition profile of these assets as backlogs are reduced. Overthe next 10 years, there would be an increase in the proportion of assets in very goodcondition – from 61 per cent in 2016, to 69 per cent in 2025, as shown inFigure 4.Figure4:Assetcondition,actual2013- ‐15andforecast2016- walsoptimisationmodel(4)Renewals available fundingIn its 2015 Long Term Plan, Auckland Council adopted an accelerated transport programmewhich will maintain the momentum of transport improvements over the coming three years.The Accelerated Transport Programme (ATP) includes funding for transport asset renewalsat close to recommended levels for the first three years. However, from 2018/2019, renewalsfunding does not keep pace with need.The following transport projects are classified as renewals in the Accelerated TransportProgramme, and are additional to the core renewals programme set out in this AMP. Refurbishment of the 10 diesel trains used for the Pukekohe service in 2019/2020(noting that the preferred option is the extension of electrification to Pukekohe,subject to Government funding) LED Streetlighting, which will reduce whole-of-life costs by installing more energyefficient, longer lasting LED luminaires Seismic strengthening projects, including a seismic upgrade of the Quay St seawall Replacement of some assets from AT’s revenue-generating parking activities General AT asset replacement/renewal (corporate and IT assets)The costs of the projects listed above are not included in the investment needs and fundingdecisions set out in this AMP.AT Asset Management Plan 2015 – 2018AT Asset Management Plan 2015 - 2018Page 15 of 139
Figure 5 shows recommended renewals investment for the coming 10 years in the context ofpast investment, the funding levels proposed in Auckland Council’s long term plan andannual tPlan2015–2025 (5),AucklandCouncilLong- ‐TermPlan2015–2025(2)The level of funding for renewals approved in Auckland Council’s 2015 Long-Term Planaligns with the level recommended in this AMP for the first three years. After that, it fallsshort of the recommended level of funding based on asset needs.Less spending on renewals means that assets will degrade over time, leading to long-termloss of asset condition and value. The consequences, in terms of both costs and condition,of the long-term plan renewals funding is shown in Figure 6.AT Asset Management Plan 2015 – 2018AT Asset Management Plan 2015 - 2018Page 16 of 139
0- ionmodel(4)After 2018, the investment approved for renewals in the long-term plan is not sufficient tocover identified renewals needs, and this will lead to deterioration in the assets’ condition. Bythe end of the 10 years covered by the plan, the proportion of assets in very poor conditionwill have increased from less than 1 per cent in 2016 to 9.4 per cent in 2025.Having high levels of assets in very poor and poor condition for a sustained period will leadto reduced levels of service, and an increased risk of failure and safety issues. This, in turn,will require higher levels of network monitoring and reactive maintenance.The 30-year outlook, as proposed in Auckland Council’s Auckland 30-year InfrastructureStrategy (6), is for further restrictions on renewals funding in future decades, with a 4 billiongap between the recommended and the approved renewals programme over the next 30years.Maintenance investment needsMaintenance and asset-based operations cover the routine activities that keep Auckland’sroad network, rail stations, bus stops and stations, and ferry wharves open for business.Maintenance and asset-based operations are the second largest item of AT operationalexpenditure each year, after public transport service contracts.New transport assets, from whichever source, bring consequential operations, maintenanceand renewals requirements. Based on past trends, around 1.5% more assets are added tothe network each year, through a combination of vested assets in new developments and ATcapital projects.The financial impact of this is a corresponding increase in maintenance and operationsfunding requirements each year, just to keep up with growth in the asset base. Over the 10years, consequential opex totals 98.1 million as shown in Table 4.AT Asset Management Plan 2015 – 2018AT Asset Management Plan 2015 - 2018Page 17 of 139
onscostsfromassetgrowth( 16-2025totalConsequential opex from Approved funding, maintenance and operationsRoad maintenance budgets do not increase at all over the coming 10 years as shown inFigure 7 and Table 5. Public transport maintenance and asset-based operations budgetsincrease by around 1.9% each year, which is below the forecast rate of undingformaintenanceandoperations( million, 0162025totalRoads maintenance andasset-based 869717273747577708PT maintenance and assetbased operationsA widening gap will arise between maintenance budgets and asset needs, for the followingreasons. inflation consequential opex from asset growth, estimated at 1.5% (compounding) each year additional costs associated with patronage growth (for public transport) and growth invehicle, freight, cycle and pedestrian trips (for roads) The shortfall in renewals funding creating increased demand for maintenance. Forexample, if roads are resealed less often, then more pothole maintenance will berequired as the pavement deteriorates.AT Asset Management Plan 2015 – 2018AT Asset Management Plan 2015 - 2018Page 18 of 139
Funding gap and consequencesFigure 8 compares the impacts that the recommended (AMP) and approved (AcceleratedTransport Programme, ATP) renewals funding levels will have on the proportion of poor andvery poor assets in the alsoptimisationmodel(4)Funding at the approved levels will increase the overall level of backlog in the network; thatis, the proportion of assets that are in worse condition than their nominated renewalintervention point. The backlog liability that will arise from the two different levels of funding(recommended and approved) is shown in Figure 9.At approved funding levels, backlog liability will increase from 2018/2019 as renewalsbudgets fail to keep pace with the rate of asset deterioration. More backlog liability will becreated than the funding that is being saved by the constrained budgets, because provisionis not being made so that renewals can occur at the optimal time. Whole of life asset costsincrease because assets in poor condition have higher maintenance costs and deterioratemore renewalsoptimisationmodel(4)AT Asset Management Plan 2015 – 2018AT Asset Management Plan 2015 - 2018Page 19 of 139
Addressing the funding gap from 2018The next long term planning cycle, leading to publication of the 2018-2021 AssetManagement Plan, provides an opportunity to address the significant issues raised by theproposed future shortfall in renewals funding from Year 4 of the ten-year Long Term Plan.With limited funding, priority setting has an increasing role in asset management. This issueis not unique to Auckland. In response to concern about the long term affordability of roadmaintenance and renewals, the New Zealand Transport Agency and Local Government NewZealand have established the One Network Road Classification to better align assetmanagement and funding decisions with network priorities. This classification will be used toinform asset management planning, investment choices, and maintenance and operationaldecisions throughout New Zealand and is especially relevant to the challenges faced inAuckland.The New Zealand Transport Agency anticipates that it will use the One Network RoadClassification as the basis for its funding allocations for road maintenance and renewalprojects from 2018 onwards.AT will apply the One Network Road Classification in order to better understand the linksbetween cost, risk and levels of service and to ensure that maintenance, operational andinvestment decisions align with national and international best practice in assetmanagement.The asset management and risk mitigation tasks set out in Table 6 will ensure continuousimprovement in Asset Management during the 2015-2018 period, and build the evidencebase for a reassessment of renewals funding levels in the 2018 AMP.Table6:Assetmanagementissuesandrisks2015- ‐2018Issue/risk Increased requirement for assetmanagement planningManagement/mitigation tasksFully integrate the One Network Road Classificationinto AT planning, management, financial anddelivery processesAdditional monitoring, risk management andreporting activities to manage higher levels of riskAnnual updates of the AMP including key indicatorssuch as customer satisfaction, health and safetyissues, network condition and performance. Approved maintenance and assetbased operations funding does notprovide for the impacts of assetgrowthReprioritise work from lower to higher risk impactassets eg. defer renewals of lower volume localroads in order to prioritise regional and arterial roads Approved renewals funding from2018/2019 forward does not meetrecommended renewals needsAdvise on of the consequences resulting from thelevel of funding proposed in the LTP, and the impactof the shortfall relative to the needs identified in theAMPReduce maintenance standards for some assetsWork closely with Auckland Council and theTransport Agency to ensure that AT’s funding needsare clear, and that tradeoffs between cost, risk andlevel of service are transparent.AT Asset Management Plan 2015 – 2018AT Asset Management Plan 2015 - 2018Page 20 of 139
Issue/risk Management/mitigation tasksLevels of service for some assetscannot be sustained at currentlevels of fundingRe-assess investment needs and levels of service.Consult on any proposed significant changes.Revisit the agreed levels of service and fundingenvelope consequences in the 2018-21 fundinground.Close monitoring of asset condition, network risk andcustomer satisfaction trends.Forecasting of the links between funding and trendsin customer complaints and asset integrity.Summary of key points AT’s is responsible for transport assets with a replacement value of 13.4 billion Current asset condition is good and customer satisfaction is high Growth adds approximately 1.5% more assets (and costs) to the network each year The recommended (AMP) budget provides
AT Asset Management Plan 2015 - 2018 Page 11 of 139 AT's asset management approach and recommended transport programme, as set out in this AMP, is a key input into the long term planning of AT and Auckland Council, and in particular to AT's Auckland Regional Land Transport Plan 2015-2025, which in turn informs: