Transcription
Fundamentals of Asset ManagementStep 10. Build Asset Management PlanA Hands-On Approach
Tom’s bad day Fundamentals of Asset Management2
AM plan 10-step re ModesDetermineResidualLifeDetermineLife Cycle &ReplacementCostsSet TargetLevels ofService (LOS)DetermineBusiness zeCapitalInvestmentDetermineFundingStrategyBuild AMPlanAsset Mgmt Plan;Policies andStrategy;Annual BudgetFundamentals of Asset Management3
Recall View 4: Management frameworkAsset ManagementBusiness ProcessesAsset ManagementPlansStrategic InitiativesAnnual BudgetsOperating BudgetFundamentals of Asset ManagementCapital Budget4
Asset decision frameworkBig picture Whole portfolioperspective Trends Macro forces Micro view Event based Specific asset focus Case-by-case decisionpointsPolicy frameworkBudget arenaMaintain? Repair? Refurbish? Replace? Augment?Fundamentals of Asset Management5
Tom’s Jones Street asset management plan: Keypoints State of the facility Required LOS Facility is well into mature stage of life cycleMost imminent major failure mode—capacity Assume two years before peak design flow isexceeded—growth Additional capacity can not be feasibly addedPhysical state is very poor, especially pumps and motorsAsset is largely at 75% to 90% physical life consumedStop SSOsMeet Whispering Oaks flow requirementsCritical assets RoofPowerControlsPump assembliesFundamentals of Asset Management6
Tom’s Jones Street asset management plan: Keypoints O&M/CIP investment strategies Keep lift station running for two years, then decommissionAll replacement equipment sized for reuse in new lift stationMove to predictive maintenance (set up monitoring intervals) for dynamic(mechanical/electrical) equipment based on root causeRun to failure with effective reactive response plan for restAssure that reactive response plan provides for continuous functioning(bypass/supplemental power/supplemental pump)Toward a funding strategy Identify O&M budget requirements to fund interim O&M strategyPrepare valid capital budget/project to replace lift stationPrepare business case and present to CouncilFundamentals of Asset Management7
Steps in developing your AMP1. Existing levels of service (LOS) 2.Assess existing assets 3.Physical detailsCondition/remaining lifePerformanceCapacity (current, ultimate)Predict demand, LOS 4.RegulatoryCustomer-relatedInternal operationsCapacity, demandsLevels of servicePerformance riskPredict failure mode Capacity (due to growth)LOSMortalityEfficiencyFundamentals of Asset Management8
Steps in developing your AMP, cont.5.Predict capital program 6.Predict O&M 7.Growth (additional flows)New assets LOSAge of overall portfolioPredict future expend. model 8.Growth, augmentationRenewal, reliabilityNew LOSBusiness efficiencyCapital, debt serviceOperationsMaintenanceAdministrationPredict future income model RatesChargesOther sourcesTotalFundamentals of Asset Management9
Steps in developing your AMP, cont.9.Ask: Are customerswilling to pay?Yes10. ExecuteNo11. Review program options (reduce cost) Reduce LOSImprove efficiencyDispose of under-utilized and under-performing assetsManage demand for service (pricing, regulation)Alter maintenance or operationsAccept higher residual riskRationalize project work in order of riskFundamentals of Asset Management12. Return to 1;revise AMPitems asnecessary10
The Enterprise Asset Management PlanExecutiveSummaryState of the AssetsSection - 1Levels of ServiceSection - 2Growth & DemandSection - 3Lifecycle ManagementSection - 4O&MRenewalManagementStrategiesSection - 6Risk ProfileSection - 5AugmentationFinancial PlanningSection - 7Business Improvement PlanSection - 8Fundamentals of Asset Management11
The enterprise asset management planFundamentals of Asset Management12
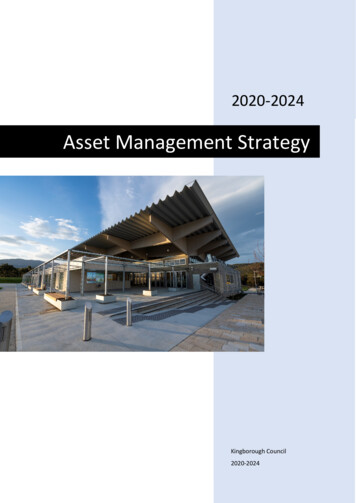
The Enterprise Asset Management Plan—assetsystem summary2. Demand Profile and PerformanceA total of six influent trunk lines bring influent into the metering and diversionstructure at Plant No. 1. This structure contains magnetic flow meters, pHmeters and electro-conductivity meters along with gates that can be raised orlowered to move flows from one trunk-line to another as necessary. A portionof the influent can also be diverted to Plant No. 2 through an interplant pipelineto regulate flow into Plant No. 1.Screening Station (Bar screens)Flow from the Metering and Diversion Structure is routed to the influentchannel for the mechanically-cleaned bar screens at Headworks #2. There arefour individual bar screen channels containing automatically cleaned screens.Two of the screens are operated and the other two are standby. The structurecontains space to accommodate two additional screens in the future.Grit System (Grit Removal)There are five aerated grit removal chambers at Headworks #2 and two atHeadworks #1 that are standby. The purpose of these is to remove inorganicsolids that are present in the wastewater. The removal of this grit helpsprevent clogging in pipes, protects mechanical equipment, and reduces theamount of material that collects in the sludge digesters. Each grit chambercontains four grit collection hoppers. Grit is removed from the chambers usingtelescoping valves that continuously discharge grit slurry by gravity toclassifiers. Grit from the classifiers discharged to the conveyor belt carryingscreens normally or to a separate grit bin for off-site disposal. Flow from theHeadworks #2 grit removal chambers is collected in an effluent channel thatdischarges to the Primary Influent Distribution Structure (Splitter Box).Max. Flowrate 490 MGDHydrogen PeroxideMax. Pressure 150 psiSunflower Pump Station30 MGD duty30 MGD standby?Headworks No. 130 MGD dutyMain Sewage Pumps30 MGD duty30 MGD standbyGrit Removal2 chambersHeadworks No. 2210 MGD dutyMain Sewage Pumps280 MGD duty70 MGD standby4. Key Issues for Further InvestigationBar Screens4 units ( allowance for 2units to be constructed)234 MGD max1 unit standbyGeneralGrit WashersGrit Storage CapacityTBARatingMetering & DiversionStructure10A2Headworks #110B5Headworks ilures. Proper operation of the meters is important because treatmentcosts are allocated to the various revenue areas based on influent meterreadings.Headworks No. 12 daysOdor Control Facilities(Bleach)3 @ 24000 cfm duty1 @ 24,000 cfm standbyFeed Pumps3 @ 11.3 gph duty1 @ 20 gph standbyRecirculation Pumps4 @ 600-700 gpm duty4 @ 600-700 gpmstandbyMuriatic Acid ScrubbingCleaning Pumps1 @ 30 gpm duty1 @ 30 gpm standbyTrunk Line Scrubbers1 * Caustic1 * Biotower24,000 CFM duty24,000 CFM standbyFerric ChlorideFeed Pump3 @ 200 gph duty1 @ 200 gph standby4 duty (See 10H-120,Pump information)4 standby pumpsFlowrate Capacity 85gpmPressure 116 psiSplitter BoxMax. Flowrate Capacity325 gpdMax. Pressure 150 psiSupport GeneratorsPower Rating 1000 KWScrubbers Headworks2 on trunk linesFundamentals of Asset Managementproperly under emergency conditions.Headworks No. 2Grit Chamber No. 2 is out of service.6. Investment ProgramTable 3This project is in keeping with industry practices as required for reliableand dependable plant operations. The capital budget identified on thissheet is based on the non-critical items necessary to ensure the facilitycontinues to function and conforms to the ultimate layout of the facility.The FY 2004/05 budgets for P1-71 and P1-105 have been reallocatedafter further evaluation of critical and non-critical work. P1-105 willaddress increases in the facilities capacity to meet expected increases inwastewater flow projected in the 2001 Interim Strategic Plan Update.The scope of work consists of rehabilitating and refurbishing the VFDs forthe main sewage pumps and the cable trays and wiring from the VFDs tothe pumps. An evaluation of the pumping capacity of Headworks No. 2 atPlant 1 conducted in 2001. Capacity issues will not be addressed throughthis project as capacity upgrades are being handled through a separateproject (Ellis Avenue). There are other potential tasks items for this projectwhich includes: a grit characterization study based on a computer model,gate operators, and installation of ventilation in Headworks 1 to meetNFPA 820. Other tasks that were previously part of this project have beenmoved to Job No. P1-105.5-Year 3,430537Total4,9202403933203,430537Table 4P1-105 - Headworks Rehabilitation and Expansion at Plant No. 1P1-71 - Headworks Rehabilitation/RefurbishmentQuestions have been raised as to the ability of the headworks to operateInsufficientperformanceDesign & ConstructionThis project rehabilitates and refurbishes process equipment andinfrastructure within the Plant 1 Headworks facility, to ensure that thefacility continues to be operational. Several studies have been conductedon the Headworks facility and a number of non-critical items have beenidentified for repair and upgrade. The bulk of the project includesupgrades to existing bar screens, an additional bar screen, a screeningscompressor, improvements to the grit removal facilities, improvements tothe power distribution system including three new larger emergencygenerators, and miscellaneous process, mechanical, structural and I&Cupgrades.Concerns about the reliability and accuracy of meters exist due to meterHydraulic 1800 gpmOverflow Rate 12,000gpd/ft21 duty and 1 standbyTBATBAProject I-10 to increase flow to Plant 1 by 40 MG/D87 MGD duty25 MGD standby5 tanks2 tanks standby325 MGDHydrogen PeroxideHeadworksProcessMetering & Diversion StructureSplitter BoxSplitter BoxThe splitter structure discharges to the Primary Clarifier Basin # 1 to 5 througha 72 inch-diameter pipeline and/or to the rectangular PCB # 6 to 15 throughtwo 90 inch-diameter pipelines. Splitting is accomplished using the sluicegates.TBAMetering & Diversion StructureMain Sewage PumpsAfter passing through the Headworks #2 bar screens, wastewater flows into theInfluent Pump Station wet well. The Influent Pump Station lifts screenedwastewater to the influent channel serving the grit removal chambers. Thereare four 70 mgd variable speed pumps at Headworks #2 and two 30 mgdconstant speed pump at Headworks #1, which services as stand by pumps. Asluice gate in this wet well can be opened to allow screened wastewater to flowto the Headworks #1 Influent Pump Station wet well if required allowing the wetwells at Headworks #2 and Headworks #1 to act as one large wet well underextreme wet weather conditions.StudySub System(s)Headworks #1 & #2There are two Headworks at Plant 1, which have a total rated pump capacity of210 mgd with 130 mgd of stand by. Headworks #2 can be increased byanother 70 mgd in the future by addition of another pump. It has two supportgeneration units with a power rating of 1000 KW. Headworks #2 is the newestand is the operated system and Headworks #1 is the standby system. Threekey processes for Headworks are bar screens, influent pumps, and gritremoval.5. Current ProgramFailure SummaryDesign Capacity(Min, max, peak and/oraverage)Grit SystemGrit ChambersActualPerformanceTable 2CapacitySystemMetering & Diversion Structure3. Failure ModePeak, Average and Standby Design CapacitiesTable 1Condition1. Asset ProfileThis project is in keeping with industry practices as required for reliableand dependable plant operations. These reliability of these VFDs must berestored by late 2008 such that Plant 1 may reliably accept diverted flowfrom Plant 2 during Plant 2 Headworks changeover.P1-104 – Regional FOG Control Collection at Plant 1J71-8 – Headwork Scrubbing ReplacementO&M Cost SummaryManagement StrategiesCost ns11082005-062006-07TBA13
Detail, left page1. Asset Profile2. Demand Profile and PerformancePeak, Average and Standby Design CapTable 1SystemMetering & Diversion StructureA total of six influent trunk lines bring influent into the metering and diversionstructure at Plant No. 1. This structure contains magnetic flow meters, pHmeters and electro-conductivity meters along with gates that can be raised orlowered to move flows from one trunk-line to another as necessary. A portionof the influent can also be diverted to Plant No. 2 through an interplant pipelineto regulate flow into Plant No. 1.Sub System(s)Design Capacity(Min, max, peak and/oraverage)Metering & Diversion StructureMax. Flowrate 490 MGDHydrogen PeroxideMax. Pressure 150 psiSunflower Pump Station30 MGD duty30 MGD standby?Headworks No. 130 MGD dutyMain Sewage Pumps30 MGD duty30 MGD standbyGrit Removal2 chambersHeadworks No. 2210 MGD dutyMain Sewage Pumps280 MGD duty70 MGD standbyBar Screens4 units ( allowance for 2units to be constructed)234 MGD max1 unit standbyGrit SystemGrit ChambersGrit WashersHydraulic 1800 gpmOverflow Rate 12,000gpd/ft21 duty and 1 standbyGrit Storage Capacity2 daysHeadworks #1 & #2There are two Headworks at Plant 1, which have a total rated pump capacity of210 mgd with 130 mgd of stand by. Headworks #2 can be increased byanother 70 mgd in the future by addition of another pump. It has two supportgeneration units with a power rating of 1000 KW. Headworks #2 is the newestand is the operated system and Headworks #1 is the standby system. Threekey processes for Headworks are bar screens, influent pumps, and gritFundamentals of Asset Management87 MGD duty25 MGD standby5 tanks2 tanks standbySplitter Box325 MGD14
Detail, right page3. Failure ModeStudyFailure SummaryTBARatingMetering & DiversionStructure10A2Headworks #110B5Headworks ditionProcessTBACapacityTable 25. Current ProgramTBATBA54. Key Issues for Further InvestigationGeneralProject I-10 to increase flow to Plant 1 by 40 MG/DMetering & Diversion StructureConcerns about the reliability and accuracy of meters exist due to meterfailures. Proper operation of the meters is important because treatmentcosts are allocated to the various revenue areas based on influent meterreadings.Headworks No. 1Fundamentalsof Asset ManagementQuestions have been raised as to the ability of the headworks to operateDesign & ConstructionP1-105 - Headworks Rehabilitation and Expansion at Plant No. 1This project rehabilitates and refurbishes process equipment andinfrastructure within the Plant 1 Headworks facility, to ensure that thefacility continues to be operational. Several studies have been conductedon the Headworks facility and a number of non-critical items have beenidentified for repair and upgrade. The bulk of the project includesupgrades to existing bar screens, an additional bar screen, a screeningscompressor, improvements to the grit removal facilities, improvements tothe power distribution system including three new larger emergencygenerators, and miscellaneous process, mechanical, structural and I&Cupgrades.This project is in keeping with industry practices as required for reliableand dependable plant operations. The capital budget identified on thissheet is based on the non-critical items necessary to ensure the facilitycontinues to function and conforms to the ultimate layout of the facility.The FY 2004/05 budgets for P1-71 and P1-105 have been reallocatedafter further evaluation of critical and non-critical work. P1-105 willaddress increases in the facilities capacity to meet expected increases inwastewater flow projected in the 2001 Interim Strategic Plan Update.P1-71 - Headworks Rehabilitation/Refurbishment15The scope of work consists of rehabilitating and refurbishing the VFDs for
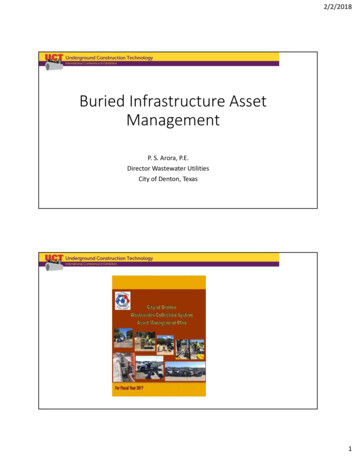
The asset management improvement plan sectionOCSD Asset Management Improvement ProgramStaff Lead Program 2005/06 Budget - Overall TimelineProject No.Project NameJuneJulyAugSeptOct11 & 12Data Standards Asset Registers8AMIS Function Applications andStrategy13Condition Assessment Guidelines2CIP Validation Stage 44BRE Collections5BRE Plant6LOS Stage 2(JH)74 Box Model(DS)1Asset ManagementPlan 210ORDM / LLCCA9Risk Policy14Organizational Alignment3Reliability Centered -DS)Note: (GHD) Initials in brackets denotes Project ManagersFundamentals of Asset Management16
Example: Organizational AM strategiesNo.DescriptionRemarks /DeliverablesBenefits1Asset ManagementPlan 2006Increase confidence level rating withbetter accurate data on condition andperformance, more definedmanagement strategies, improvefuture predictions on changed levelsof service overall results / outputs etcincluding rate modeling. Completeupdated asset management plananalysis and assess improvementsmade. Links and inputs from mostprojects. Asset ManagementPlan outputimprovements. Improved ConfidenceLevel Rating. Improved BusinessRisk Exposureassessments, fundingand rate models,operations andmaintenance budgets. Expenditure predictionTool enhancementsand improved BusinessRisk Exposuremodeling. Significant benefitsderived for 2004program ( 25M incapital) and over 50Min life cycle costs. Improved ability torank and prioritizeprojects.2/10CapitalImprovementProgram ValidationStage 4 (2005/06)Fundamentals of AssetAdd life cycle costs, Business caseanalysis methodology, includingimproved maintenance budgets/options and improve risk model to fulleconomic cost and Triple BottomLine. Link / integrate this process tothe start of the asset creationManagementgateways system. Improve analyticalbudget setting process. Greater understanding17
The AM “charter”Fundamentals of Asset Management18
The AM charterAsset Inventory We will know the assets that we own,or for which we have legal responsibility, and willmaintain an accurate computerized asset registerdeveloped around an asset hierarchy that supportsadvanced asset management functions.Fundamentals of Asset Management19
The AM charterCondition Assessment We will gather, record, andanalyze condition assessment data; store and analyzeit using user friendly computerized systems; designthese systems to support high confidence level assetrelated decision making; and create a comprehensiveand dynamic condition index.Fundamentals of Asset Management20
The AM charterMaintenance We will retain a detailed maintenancepolicy, and operate a user friendly, accurate, andcomprehensive enterprise asset management system(that includes a Computerized MaintenanceManagement System) to ensure that the assets,facilities, and systems perform to their design criteriaand meet their design lives.Fundamentals of Asset Management21
Telling the story—institutionalization Annual budget process Annual reportFundamentals of Asset Management22
Key points from this sessionWhat does my asset management plan look like?Key Points: AM focuses relentlessly onproviding sustainedperformance at the lowestlife-cycle cost to theorganization AM is both a way of thinkingand a set of specific practices The more we understandabout our assets, the betterwe can mange them Understanding our assetsstarts with asking the rightquestionsFundamentals of Asset ManagementAssociated Techniques: The Enterprise AssetManagement Plan The Total Enterprise AssetManagement ImprovementProgram Best AM Practices; BestAppropriate Practices The Five Core AM Questions The 10 Step Process to anasset management plan23
Fundamentals of Asset Management24
Fundamentals of Asset Management 6 Tom's Jones Street asset management plan: Key points State of the facility Facility is well into mature stage of life cycle Most imminent major failure mode—capacity Assume two years before peak design flow is exceeded—growth Additional capacity can not be feasibly added