Transcription
Market Power and Second Degree Price Discriminationin Retail Gasoline MarketsTravis Roach Department of EconomicsUniversity of Central OklahomaTRoach2@uco.eduJanuary 28, 2019AbstractEmpirical evidence of ‘quality-based’ second degree price discrimination is scarce. Theco-existence of regular-grade 10% ethanol-blended gasoline (E10) and regular-gradenon-blended gasoline (E0) in a major metropolitan city allows for second degree pricediscrimination to be examined while eliminating the issue of endogenous product differentiation because the two blends of gasoline are near-perfect substitutes. Using aunique data set including daily price information for 402 retailers that sell only E0gasoline, only ethanol-blended E10 gasoline, or both blends simultaneously, I find evidence that retailers use second degree price discrimination to segment the populationbetween perceived lower and higher quality gasoline; despite the fact that both blendscan safely be used in nearly all vehicles. Additionally, I uncover two elasticities ofdemand for gasoline and discuss the welfare effects of price changes and market segmentation.JEL Codes:Keywords: D22, L11, Q41Price Discrimination; Gasoline; Ethanol; Renewable Fuel StandardI acknowledge funding from the University of Central Oklahoma’s Student Transformative LearningRecord (STLR), a Department of Education Title III grant program.
1Introduction and BackgroundSecond degree price discrimination or ‘quality-based’ price discrimination is a theoreticalmainstay in the industrial organization field. However, empirical evidence of quality-basedsecond degree price discrimination remains somewhat of an enigma due to precision issues,endogenous product differentiation, endogeneity of menu choices, and the sheer existence ofproduct variants. For example, were power windows in cars introduced as an add-on featuredue to latent consumer demand, or does consumer demand only exist because suppliersintroduced power windows? What percentage of credit should be assigned to demanders orsuppliers for the introduction of power windows? Further, are cars with power windows (orleather seats, or any other ‘upgrade’) too different from cars without power windows to trulydiscuss price discrimination? This type of quality-based price discrimination can be seenthroughout the ‘damaged goods’ literature which was formalized by Mussa and Rosen (1978)and popularized with Deneckere and Preston McAfee (1996). Damaged goods are productsthat are deliberately ‘damaged’ to lower quality versions of themselves so that firms may offera menu of product qualities and price choices. By offering targeted price-quality packagesfirms are able to raise profitability and extract consumer surplus without full information onthe consumer (first degree price discrimination) nor an identifying characteristic to segmentconsumers into groups (third degree price discrimination). Deneckere and Preston McAfee(1996) mostly discuss differences in computer chip capacities, and their prices, to show howfirms are able to segment their customer base and become more profitable. Historical railwayregulation of third class passenger cars that were roofless while the other two classes of traincars were properly roofed shows just how far price discrimination and endogenous productdifferentiation can go.1Using the co-existence of 10% ethanol-blended regular-grade gasoline (commonly referredto as E10) and non-blended regular-grade gasoline (“E0”) in a major metropolitan area I amable to circumvent the issue of endogenous product differentiation and arbitrage because thetwo non-durable goods are near-perfect physical substitutes.2 Both types of gasoline havethe same octane rating, and both are marketed as ‘regular-grade’ gasoline (while midgradeand premium are also offered). Indeed, in nearly every other state in the United States youare not able to make a choice between E0 or E10 because only E10 is provided. Accordingto the Energy Information Administration (EIA), E10 makes up more than 95% of the fuelconsumed in vehicles with gasoline-run engines. Moreover, the market share of E0 among12See the Railway Regulation Act of 1844 in the United Kingdom.There is a small energy efficiency difference between E10 and E0 that I discuss and account for below.1
all gasoline sales has been in decline from its already small market share. Despite the broadacceptance, and in most cases full switch to E10, gas stations in Oklahoma City are nearlyevenly split between E0 and E10 with an array of stations that sell either only E10, only E0,or both types simultaneously.The dual existence of E0 and E10 persists despite the fact that the EPA has stated thatE10 can safely be used in nearly all vehicles.3 Notwithstanding broad vehicle compatibility,there is a substantial population that believes E10 is a lower quality fuel than non-blendedregular gasoline - especially in Oklahoma (Ulmer et al. (2004)). The impetus of this beliefcould be due to reports about vehicle damage or mislabeling4 , the fact that E10 cannot beused safely in other gas-run motors (e.g. lawn equipment), or a sort of regional pride due tothe heavy presence of the oil and gas industry. I remain agnostic to the origins of ethanolaversion and instead take as given that ethanol-blended fuels are viewed by some as a lowerquality fuel. I am thus able to use the unique retail gasoline market in Oklahoma City as away to investigate differences in market power and price discrimination between two goodsthat are homogeneous and only vary in perceived quality.To preview results, I find that E0 is able to command a price-premium over E10 without cost-based justifications. The E0 price premium is approximately 13.4 cents per gallon,8.3% higher. The price premium is 7.5 cents per gallon after accounting for energy contentdifferences. I further find that retailers that offer both E10 and E0 at the same stationcharge a lower price on E0 than their E0-only competitors in order to persuade the marginalconsumer to reveal their preferences and purchase E0. The results of such pricing behaviorhas implications for firm-level sales as well as aggregate fuel sales. I conservatively approximate station-level elasticities of demand and find that stations selling both fuels are able toincrease sales of E0 by more than 5% due to price discrimination. Further, because E0 sellsat a price premium I find that aggregate fuel sales are lower by more than 15 million gallonsper year depending on the share of the population that consumes only E0 and the aggregateelasticity of demand.Beyond providing a new empirical example of a theoretical mainstay, the present paperoffers an example of potential future market responses outside of Oklahoma due to changing Renewable Fuel Standard (RFS) ethanol requirements and the ‘blend-wall’. In order toachieve increasing ethanol volume requirements set out by the RFS, the EPA has approvedthe sale of E15, a 15% ethanol blend, for some vehicles. Warranty and vehicle damage con3‘Classic cars’ or those produced prior to the 1970’s are not able to use E10.See Chandler (n.d.) and Equipment error leads to excess ethanol in local gasoline News OK (n.d.) forjust two examples of ethanol reporting in the region.42
cerns abound with this fuel, and public information regarding higher blends of ethanol fuelare wanting if the history of confusion and E85 sales may serve as an indicator (Liao et al.(2016)). Too, Qiu et al. (2014) shows that an unintended consequence of relaxing the blendwall and moving to E15 may actually lead to more petroleum-based gasoline consumption.As E15 becomes more prevalent, and if E10 continues to exist in these same markets asa near perfect substitute, then the results of this paper indicate that firms will be able tocharge higher premiums on lower ethanol blends, and that firms that offer both fuel-typessimultaneously may price discriminate between the two blends.1.1Prior LiteratureDespite a robust literature discussing market power and the ability to extract consumersurplus and raise profit margins by using quality-based price discrimination, econometricevidence of such pricing is scant. The reasoning behind this is that identification amongdifferentiated products is difficult. Or as Clerides (2004) notes, “[i]t is important to keep inmind that the identification of price discrimination becomes increasingly tenuous the furtherone moves away from a world of homogeneous products and equal costs” (Clerides (2004)).Verboven (2002) comments on the dearth of empirical evidence of quality-based pricediscrimination when discussing tax incidence and sales of gasoline and diesel cars in Europe.This author finds that diesel vehicles sell at a premium consistent with price discrimination.Busse and Rysman (2005) discuss the non-linearity in prices for space in yellow page advertising. They find that as the amount of competitors increase (other directory services),the price for large ads decreases relative to smaller ads. The prior finding is indicative ofquantity-based discrimination which closely resembles quality-based discrimination. Clerides(2002) discusses quality-based price discrimination between hard and soft cover books. Hefinds that margins are a stronger indicators of price discrimination. Leslie (2004) uses differences in Broadway theater ticket pricing and runs simulated experiments to compare thewelfare effects of second and third degree price discrimination. The most closely relatedstudy to the present paper is Shepard (1991) in which pricing discrimination between selfservice and full-service gas stations is investigated. Shepard (1991) finds that stations thatoffer both types of service at one location use non-linear price schedules to segment theircustomer population and drive high-end consumers to their full-service product.The majority of the retail gasoline literature is focused on regular grade gasoline asregular typically accounts for 70-90% of gasoline sales at the station-level (Noel (2016)),3
and currently 87% of all fuel sales in the United States.5 There are a few exceptions tothis literature, however, that are pertinent to the present research because they look intonon-linear pricing differences between fuel grades. Borenstein (1991) shows that there werehigher margins on unleaded versus leaded gasoline during the transition away from leadedgasoline, and that this may have resulted from price discrimination. Borenstein notes thatthe impetus behind this likely occurred because firms knew that vehicles that used unleadedwere newer, and hence may have been owned by wealthier individuals. Leach et al. (2008)show that midgrade and premium prices are generally set as fixed price-differentials overregular, but note that grade pricing is non-linear in octane-rating. Although midgradegasoline is simply a 50-50 blend of regular and premium grades, midgrade generally sells formore than the average of its two constituent prices. Setiawan and Sperling (1993) discusspurchasing decisions between different fuel grades. Interestingly, premium grade gasoline isconsidered by consumers to be a higher quality fuel, even though there is no engineeringevidence to support it. The defining difference between grades is the octane rating, andvehicles that do not require a higher octane fuel to avoid engine knock do not require, norbenefit, from choosing premium fuel over of regular (or midgrade). The authors find thatconsumers are over-purchasing both midgrade and premium fuel. Barron et al. (2004) lateradd that the premium to regular price differential increases in areas with higher incomes,decreases as the distance between competitors grows, and is larger when midgrade is alsooffered.The balance of this paper continues as follows: Section 2 describes the unique station-leveldata set; Section 3 shows the theory behind second degree price discrimination and developsthe econometric specification used to estimate price differences. Too, robustness exercisesare carried out to confirm that price differences are in fact due to price discrimination andnot some unobserved factor; Section 4 discusses the implications of price discrimination andmarket power using an approximation of station-level elasticities; Section 5 concludes.2Data DescriptionThe data on retail and wholesale (rack) prices for gasoline, ethanol, and diesel fuel primarilycome from Oil Price Information Service (OPIS). I use daily price information for stationsacross the Oklahoma City metropolitan area for the five month period from January to May2016. This sample includes more than 48,500 observations. The OPIS data is incomplete,5In March 2017 the market shares for premium, midgrade, and regular were 11.27%, 1.81% and 86.91%,respectively. The 10-year average for regular grade is 86.72%.4
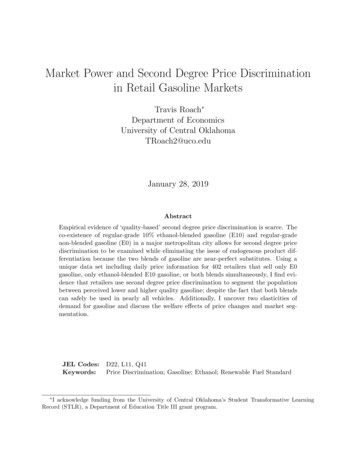
however, in that stations that offer both types of fuel simultaneously are not fully reportedbecause only one price per day is recorded for each station. I supplement the OPIS datawith ‘hand-collected’ daily observations from stations across the city that sell both typesof gasoline simultaneously.6 All prices were collected at the same time of day, each day.7All firms that were operating at the beginning of the sample were still in operation at theend of the sample. There were two firms that entered the market at the end of the samplethat I remove from the data to remove bias, and because there is only five days of pricinginformation available. I discuss these firms briefly in the conclusion. Summary statistics areshown in table 1.Interestingly, the market is segmented in such a way that the stations are nearly evenlysplit between those that sell E10 only (34.91%), E0 only (34.91%), or both simultaneously(30.19%). In addition to E10 and E0 price information I use diesel retail and wholesale pricesfrom OPIS to run a robustness exercise. For stations that sell both diesel and gasoline thereis still a near-even split among gasoline-types offered - 34.46%, 30.05%, 35.48% for E10 only,E0 only, and both, respectively.A potential concern lies in the fact that station types could be distributed across thecity in such a way that spatial differentiation is the driving factor behind price differences,not price discrimination between fuel types. Figure 1 shows the distribution of station typesacross the Oklahoma City metropolitan area. In this figure orange markers indicate stationsthat sell E0 only, yellow markers indicate stations that sell E10 only, and blue markersindicate stations that sell both types. While figure 1 provides anecdotal evidence that thestation-type is not spatially correlated, I later control for fixed effects based on location andcluster standard errors to guarantee that spatial variation does not drive price discrimination.6I am thankful to STLR for funding to support two truly stellar undergraduate research assistants.Unlike some other retail gasoline markets, prices are very ‘sticky’ in the OKC metro area, so multiplewithin day price changes are extremely unlikely. Noel (2007) discusses the three main variants of retailgasoline markets.75
Figure 1: Station Distribution3Empirical StrategyEthanol-blended and non-blended gasoline are, for all intents and purposes, perfect physicalsubstitutes. Vehicles manufactured since the 1970’s have been approved by the EPA to safelyconsume E10. However, a non-trivial population in Oklahoma will only purchase E0, andthe reasoning behind the decision making is somewhat vague as Ulmer et al. (2004) show.These authors find that 21.8% of survey respondents believe engine performance will fallwith E10 use, and 33.3% believe E10 is harmful to an engine. Even though the impetus ofethanol aversion is unclear, I take as given that ethanol-blended fuels are viewed by some asa lower quality fuel.Due to the simultaneous existence of these products I am able to measure how perceivedproduct differentiation effects prices. Across all station-types if regular grade gasoline sellsat a premium to E10, without cost-based justification, then it must be the case that thesefirms have some degree of market power (e.g. price 6 marginal cost). While accounting fordifferences in market power I am able to also determine if stations that offer both blendssimultaneously adjust their prices in a way consistent with the theory of second degree pricediscrimination.6
3.1TheoryI follow the standard model of second degree price discrimination that has been rigorouslydeveloped since Mussa and Rosen (1978) and Deneckere and Preston McAfee (1996) whichis documented in great detail in Stole (2007).Let consumer fuel preferences be represented by combinations of price and quality, θ, withconsumer quality preference distributed on the interval Θ [θl , θh ] according to the densityand distribution functions, f (θ) and F (θ), respectively. Consumer surplus for a purchase oftype θ gasoline is represented by:uθ (q, θ) P (qθ )(1)Further, assume that uθ (q, θ) 0 and that consumers have a greater willingness to payfor increasing product quality. This ensures that consumer preferences exhibit the standardsingle-crossing property.Firms do not have exact knowledge of consumer preferences, but seek to set price schedules in such a way that consumers reveal their preferences via their product choice. Inessence, firms seek to satisfy the following participation constraints for both ‘high-quality’and ‘low-quality’ preference typesul (qθl ) P (qθl ) 0(2)uh (qθh ) P (qθh ) 0(3)while at the same time setting prices such that they are incentive compatible so that consumers purchase ‘their’ packageuh (qθh ) P (qθh ) uh (qθl ) P (qθl )(4)ul (qθl ) P (qθl ) ul (qθh ) P (qθh )(5)In words, the utility a high-θ type consumer receives (uh ) from consuming the high-θproduct and paying the higher price is greater than the utility received from consuming thelow-θ type product and paying the low-θ price (and vice versa for low-θ type consumers).For example, firms set prices such that a high-θ type air-traveler will choose to fly first classand pay the first class price instead of putting up with less comfortable seating in order topay a lower price.For all q 0 it can be shown that since uh (q) ul (q), condition (2) implies thatuh (qθl ) P (qθl ) 0 which by condition (5) implies that uh (qθh ) P (qθh ) 0. Thus, from7
the incentive compatibility constraint we find that high-θ type consumers must be receivinga positive surplus.uh (qθh ) P (qθh )(6)Additionally, it is straightforward to show that low-θ type consumers will receive no additional surplus and will be charged their valuation of the product.It is important to note that the positive surplus that high-θ consumers receive is expressedhere in utility terms and not necessarily a price discount. Shepard (1991) shows that theprice difference for the higher-quality good between multi-product firms and single productfirms should be positive. The intuition behind this is that the inframarginal effect of raisingprices at a multi-product station is simply customers switching to the lower-quality product.However, I later show that the opposite occurs in this fuel market.8 That is to say, the ‘highθ’ good, E0, sells at a discount at multi-product stations compared to their single productcounterparts.The surprising result that multi-product stations sell their high quality good at a lowerprice may be due to the nature of retail gasoline markets which exhibit stiff horizontalcompetition. Armstrong and Vickers (2001) and Rochet and Stole (2002) offer a theoretical construct that more closely matches the nature of the market in study. In their workduopolists earn profits based their locational advantage, but because they have no competitive advantage in supplying quality they do not gain by distorting quality. These authorsfind that equilibrium prices take the form of cost-plus-fixed-fee pricing.9 This equilibriumpricing strategy depends critically upon firm symmetry in providing utility and upon marketcoverage, though. Given the homogeneous nature of retail gasoline both of these conditionsare most likely fulfilled. Taken together with the result that high-θ consumers must receivesome positive surplus, a slight discount on the cost plus fixed fee pricing strategy (comparedto E0-only stations) may be the driving factor behind the price discrimination result foundhere.Connecting to the market in study, there are three types of retail gasoline stations:those that sell E10 only, those that sell non-blended E0 only, and those that sell both fueltypes simultaneously. If price discrimination is not present at the stations that sell bothblends, then there should not be a significant difference between the price for the perceivedhigher quality good (E0) at stations that sell both fuel types and competing stations that8In Shepard (1991) quality is ‘distorted’ more so than here because firms are offering two completedifferent service packages.9An empirical example of this in gasoline markets is Leach et al. (2008) which shows that different gradesare typically sold at fixed price intervals.8
only sell the higher-quality good (E0). That is, regular E0 fuel sold at E0-only or ‘both’stations will be priced equally to be competitive with one another. If price discrimination ispresent, however, then we expect the price at stations that sell both blends together to bedifferent than the price at E0-only type stations in order to attract consumers at the marginto consume the ‘high-θ’ good instead of the perceived lower quality good. Additionally,we would expect that E10 would be priced the same across E10-only stations and ‘both’stations as it is not profit-maximizing to give ‘low-θ’ consumers any surplus. I test thesetwo assertions and find evidence of second degree price discrimination at stations that sellboth goods simultaneously while controlling for differences in wholesale costs and othercharacteristics.3.2Econometric SpecificationThe defining feature of price-discrimination is that firms that sell both ‘high’ and ‘low’ qualitygoods offer differing prices to different consumer groups with no cost-based justification.That is to say, in the absence of price discrimination the price differential between blendedand non-blended gasoline should be based solely on differences between the wholesale priceof gasoline and ethanol. For example, consider an extreme case where the effective price ofethanol is zero. In this scenario, E0 gasoline would be sold at a 10% premium to ethanolblended gasoline based solely on the difference in marginal costs to produce the two typesof fuel.10 Thus, the hypothetical maximum price differential between the two types of fuelshould be 10%.There is one other price differential to account for that is due to differences in fuelefficiency. The energy content in ethanol is approximately 33.3% less than pure gasoline;by extension, then, E10 is 3.33% less efficient than E0 gasoline.11 Thus, one would need topurchase 3.33% more E10 gasoline than if they had purchased E0 gasoline to travel the samedistance. This means that part of the price differential between blended and non-blendedgasoline is justified on energy content grounds alone. Returning to the extreme case in whichthe wholesale cost of ethanol is zero, after adjusting for differences in energy-efficiency themaximum hypothetical price differential between the two fuel-types is approximately 13.33%.The difference between the average E0 and E10 retail price is 25.6 cents. Using the midpointmethod this is a 15.2% price difference between the two types of fuel. Thus, even before10In the other extreme if ethanol is more expensive than gasoline, then ethanol-blended fuel will sell at apremium.11Ethanol-free gasoline contains approximately 114,000 BTUs (British Thermal Units) of energy per gallon,E10 contains 110,300 BTUs.9
considering wholesale prices the price differential between the two types is greater than it‘should’ be indicating that firms are able to set higher prices on E0.To fully examine how firms are price discriminating across fuel-types I control for differences in the wholesale cost of each fuel-type. I construct the wholesale cost of E10 andnon-blended gasoline using gasoline and ethanol rack prices for branded and unbranded stations using information from OPIS. Within the E10 wholesale price I also account for changesin Renewable Identification Number (RIN) prices which are an implicit subsidy for ethanolblending. RINs are openly traded and are used as an accounting method for firms to meetrequirements under the Renewable Fuel Standard. The average RIN price during this timeperiod was 0.713.In addition to the wholesale prices of gasoline and ethanol I include a number of fixedeffects that may also drive a distortion between E0 pricing and E10 pricing. First, day ofthe week fixed effects are included to account for price variation on weekends or weekdays. Ialso include fixed effects based on the zipcode a gas station is located in. Oklahoma City is alarge metropolitan area, 620 square miles in total, that comprises 41 different zip codes thatvary greatly in demographic and real estate makeup (downtown, commercial, residential,etc.). Individual station fixed effects can not be included because the type(s) of gasolinesold at each station does not vary over the time period studied here. Instead, I Include adichotomous indicator variable to denote whether or not the station sells branded gasoline(e.g. Phillips 66). The price discrimination model is shown below in equation (7).P riceif t β0 β1 E0f β2 Bothi β3 E0f BothinX β4 Brandedi π0 i Rackif,t i µi λt εif t(7)i 0Where P riceif t is the price of fuel type f at station i on day t; E0f is a dichotomousvariable equal to one if the sales series is for non-blended gasoline (zero for E10 gasoline);Bothi is a dichotomous variable equal to one if the station sells both blends simultaneously;The interaction of these two variables yields the estimate of price discrimination (β3 ). Rackif tis the station-type and fuel-type specific wholesale price with n possible lags; µi representszip code fixed effects and λt represents day of the week fixed effects. Standard errors areclustered by brand.12The major coefficients of interest are β1 and β3 as they represent the exertion of marketpower and price discrimination, respectively. If β1 is statistically different from zero, then12All variables of interest remain statistically significant at the same levels when standard errors areclustered by individual store or by zip code.10
non-blended E0 gasoline commands a premium compared to ethanol-blended gasoline andfirms receive a higher mark-up on this type of fuel after controlling for differences in wholesalemarginal costs. If β3 is statistically different from zero, then firms that offer both types offuel simultaneously use price schedules to segment the customer population. Estimates ofequation (7) are shown below in table 2. Columns 1 and 2 use the price level as the dependentvariable. Columns 3 and 4 are analogous to 1 and 2 except that the natural log of the pricelevel and the natural log of the rack price is used.3.3ResultsThe dual existence of E10 and E0 leads to very interesting pricing phenomena. First, firmsthat sell E0 are able to exert some form of market power because sales of E0 are able to11
command a price-premium to E10 while holding wholesale cost differences constant. I findthat E0 fuel sells at approximately a 13.4 cent premium to E10 (a 12.9 cent premium whenfurther lags in the rack price are used). Columns 3 and 4 show that this is tantamount toa 8.3% and 8.1% price premium, respectively. Some of this price premium is justified onenergy-efficiency grounds because E0 is more efficient than E10 by 3.33%. However, it wouldonly require 5.92 cents more on average. Thus, for every gallon of gasoline sold 7.5 centsare returned to the gas station without justification on energy-efficiency or wholesale costgrounds. According to the Department of Transportation, adults between the ages of 20 and54 drive over 18,000 miles per year on average. For an average-sized tank of 15 gallons andfor a car that travels 18,000 miles a year and gets 25 miles per gallon this translates intospending an additional 54 per year.Second, I find that firms that offer both E10 and E0 simultaneously alter their priceschedules in a manner consistent with second degree price discrimination. Specifically, Ifind that stations that sell both fuel-types charge approximately 1.8 cents less for E0 thanwould be expected, 1% less on average. When further lags of the rack price are included inthe model I find a price discrimination effect of nearly 2 cents or 1.1%. This is consistentwith the result that these firms should offer some sort of consumer surplus to ‘high-θ’ typeconsumers. Using the same hypothetical consumer as above, this results in paying 13 lessper year to consumer E0 from stations that sell both blends simultaneously. To the firm,however, this price difference drives more sales of E0 which has been shown to commanda higher premium. This increase in sales, with respect to elasticities, is discussed in moredetail in section 4.3.4RobustnessAs a first measure of whether or not price differences at stations that sell both blends togethercan be attributed to price discrimination I look to see if there are statistically significantdifferences in the price of E10 sold at E10-only stations and ‘both’ stations. According totheory, the low-θ type customers will not receive any additional surplus and will be chargedtheir valuation of the product. That is to say, there is no incentive for a firm to charge pricesbelow the market price for E10. Using the baseline specification I re-estimate equation (7)using only E10 prices. In this model I find that the estimate for Bothi cannot be differentiatedfrom zero statistically. The point estimate is approximat
University of Central Oklahoma TRoach2@uco.edu January 28, 2019 Abstract Empirical evidence of 'quality-based' second degree price discrimination is scarce. The co-existence of regular-grade 10% ethanol-blended gasoline (E10) and regular-grade non-blended gasoline (E0) in a major metropolitan city allows for second degree price