Transcription
H1 2018Shareholder letter
HighlightsProcessed volume 70.0 Bn43.1% growth year-on-year156.4Net revenue 156.4 Mn124.893.567.3% growth year-on-yearH1 201770.3EBITDA 70.3 Mn83.1% growth year-on-year44.9% EBITDA marginH1 2018H2 201760.638.4H1 2017H2 2017H1 2018Sustained profitable growth at scaleSignificant momentum in growth pillars»» Growing volume, net revenue and EBITDA, spreadacross channels and geographies»» Key merchant wins in enterprise segment in H1 2018»» Continued high cash generation with FCF conversionof 89.3%»» POS (point-of-sale) processed volume up 120.0%year-on-year»» Increased investment in mid-market segmentContinued innovation on single platformFocused on building the business»»L aunched Terminal API - the future of our in-store offering»» Going public in H1 2018 proved not to be a distraction»» First to market with Real-Time Account Updater forboth Visa and Mastercard
H1 2018 Shareholder letterpage 3Sustained profitablegrowth at scaleDear shareholders,August 22, 2018We continued our strong and profitable growth in the first half of this year,ending June 30, 2018, helping our merchants grow across channels andgeographies. Net revenue over this period was 156.4 million, up 67.3% yearon-year. Processed volume was 70.0 billion, up 43.1% year-on-year. Ourgrowth was mainly driven by existing merchants and we successfully addedhousehold names such as eBay, Valve and Dunkin’ Donuts to our platform.In the first half of the year we saw a continuation of the transformation ofcommerce, leading to an increased merchant focus on accepting paymentsacross channels and geographies. This trend, coupled with changingshopper behavior, the rise of mobile payment methods, and the increasingpressure on retailers’ operations, highlighted the benefits of our singleplatform, and consequently driven significant growth in the first half of 2018.EBITDA for H1 2018 was 70.3 million, up 83.1% from H1 2017. EBITDAmargin also increased, from 41.1% to 44.9%, while we continued to investin the growth of the company through expansion of our team and increasedmarketing efforts in the first half of this year. Net income for the period was 48.2 million, up 74.6% from 27.6 million for the first half of 2017.As we continue to pursue sustainable profitable growth at scale, our free cashflow (EBITDA - CapEx) during the first half of this year was 62.7 million, up71.2% year-on-year.
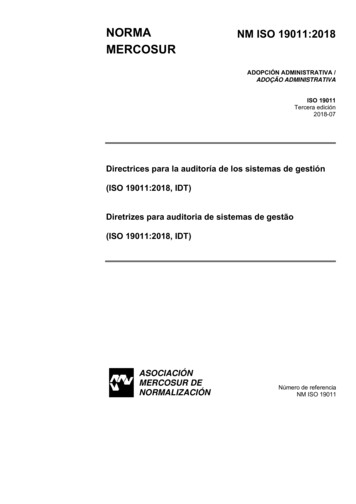
H1 2018 Shareholder letterSignificant momentum in growth pillarsWe have traditionally grown our business by solving paymentsrelated issues for global enterprise merchants, which we define aslarge multinational corporates. This segment continued to growsignificantly in the first half of this year, through the organic growthof existing merchants, an increased share of wallet with existingmerchants, and the addition of new merchants to the platform. Weare also seeing increased traction in relatively new verticals for us,for example in hospitality, restaurant chains and supermarkets.The common denominator across these verticals is an increaseddemand for shopper-friendly mobile payment methods. We areseeing success here due to our ability to quickly implement newpayment methods, across all channels and on a global scale - allmade possible by our single platform.Unified commerce continues to be a major growth driver for us.POS processed volume has increased to 6.6 billion (9.4% of totalprocessed volume) in the first half of 2018, up 120.0% year-on-year.Through our single platform, we provide a holistic view of payments,regardless of sales channel, delivering unique shopper insights whilecombating fraud and improving payment authorization rates. In thefirst half of the year, we also launched the Terminal API – which is thefuture of our in-store solution and is seamlessly integrated with theincreasingly popular cloud-based POS systems that retailers usein-store. With Terminal API, payment transactions are run entirelyover the internet - no longer relying on old infrastructure. This makesit much easier for retailers to create new and more personal shopperjourneys in their stores - examples include ‘endless aisle’ concepts, orself-checkout using smartphones.In the first half of 2018, we continued to invest in the next adjacentsegment to enterprise, which we define as mid-market. Throughcontinued investments in marketing and team expansion in midmarket-specific roles, we successfully grew the mid-marketportfolio while also making product improvements tailored to thissegment. One of these product improvements was in the form ofAdyen Checkout, a software development kit (SDK) that allowsmerchants to quickly board onto our platform, even when lackingsignificant development resources. Further, we revamped ourCustomer Area, improving the user experience of the back-endof our platform. Alongside these investments, we increased ourfocus on partnerships, i.e. e-commerce platforms with significantcustomer bases in this segment such as Magento, NetSuite andSalesforce, by building committed development groups.page 4
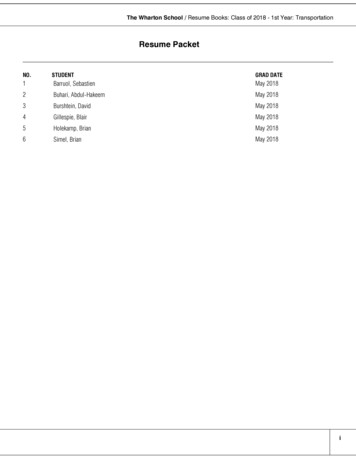
H1 2018 Shareholder letterpage 5Continued innovation on single platformWe were first to market for both Visa and Mastercard Real-TimeAccount Updater, which help our subscription merchants reduceinvoluntary churn – the process of losing customers passively andinvoluntarily due to expired credit cards or other payment methods.We added further automation to our product offering, leading toan increase in authorization rates for our merchants, which in turnallowed us to increase our share of wallet across our portfolio. Thefurther automation of the product also led to increased operationalefficiency, allowing our Data Science and Product teams to fully focuson further improving this and other products.Focused on building the businessExternally, one of the highlights of the first half of this year was ourlisting on Euronext Amsterdam on June 13, 2018. We decided topursue an IPO to give our existing shareholders a path to liquiditywhile providing us the opportunity to continue to grow as anindependent company. Our focus remained on building the businessthroughout this project, and it’s a testament to the team and ourculture that we were not distracted by our listing. To facilitate this IPO,we changed our registration in the Netherlands from a B.V. (BeslotenVennootschap – private company with limited liability) to an N.V.(Naamloze Vennootschap – public limited company).In the first half of 2018, we expanded our operations mainly in the USand Asia Pacific. We grew the global Adyen team to 768 FTE, up from668 at the end of last year, and up 39.9% year-on-year.Of those hired in the first half of the year, 47.3% were in techroles, 37.3% in commercial roles and 15.4% in staff or supportingfunctions. As we view keeping our culture as business critical, seniormanagement has continued to invest significant time and energy intoour rigorous hiring process.FTE growth
H1 2018 Shareholder letterpage 6
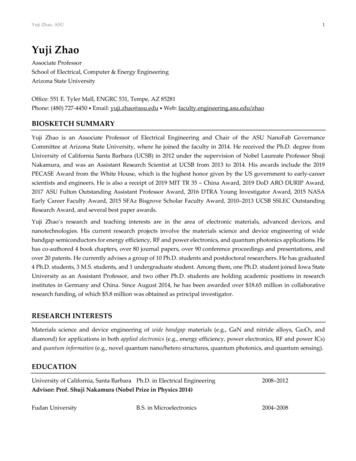
H1 2018 Shareholder letterDiscussion offinancial resultspage 7Net revenue by geographyBy billing address. In EUR millions.Europe102.786.1Robust volume growthDemonstrating continued growth at scale, we processed 70.0billion on our platform in the first half of 2018, up 43.1% year-on-year.POS volume increased 120.0% year-on-year to 6.6 billion, and nowrepresents 9.4% of total processed volume on the platform. This is upfrom 6.1% of total processed volume in the first half of 2017.67.6H1 2017H2 2017H1 2018North AmericaNet revenue growth across geographiesand merchant portfolioNet revenue was 156.4 million in H1 2018, up 67.3% year-on-year.Net revenue growth was well balanced geographically in the first halfof 2018 – with year-on-year growth across Europe (51.9%), NorthAmerica (142.9%), Latin America (58.7%), and Asia Pacific (147.5%).We saw net revenue growth across the width of the merchant base*.Growth investments22.114.29.1H1 2017H2 2017Latin AmericaOperating expenses were 42.7 million in the first half of 2018, up 68.9%year-on-year, representing 27.3% of H1 2018 net revenue. The increase isa result of continued investment in the growth of the company. ersonnel costs were up 45.8% year-on-year to 43.6 million in thePfirst half of this year, highlighting our commitment to investing inteam growth. The majority of the new hires were made in commercialand tech roles.14.516.510.4H1 2017Sales and marketing expenses were 11.4 million in H1 2018, as a resultof continued investment across regions and in our brand equity. Thisinvestment supported the expansion of our operations into the midmarket segment. These expenses are up from 7.2 million in H1 2017.H1 2018H2 2017H1 2018Asia Pacific14.6 ther operating expenses grew to 5.9 million in the first half, up fromO 2.2 million year on year. This delta was partly due to IPO-related costs.9.25.9H1 2017* On a constant currency basis, H1 2018 revenue of 697.1m would have been approximately6% higher than reported. Please refer to Note 1 of Interim Condensed Consolidated Financialstatements for further detail on revenue breakdown.H2 2017H1 2018
H1 2018 Shareholder letterIncreasing EBITDAIn the first half of 2018, we generated an EBITDA of 70.3 million,up 83.1% from 38.4 million in H1 2017, reflecting our sustained netrevenue growth alongside continued investment in our operations.EBITDA margin increased from 41.1% in H1 2017 to 44.9% in H12018, despite increased advisory and IPO-related costs, which wereincluded in the operating expenses.Strong net income growthNet income was 48.2 million in the first half of 2018, up 74.6% year-onyear. This was partially impacted by the revaluation of a derivative liability,which in turn was largely offset by gains on equities and currencies.High free cash flow conversionIn the first half of 2018 our free cash flow was 62.7 million, up 71.2%from 36.6 million in the first half of 2017. Cash flow conversion ratio((EBITDA-CapEx)/EBITDA) was 89.3%.page 8
H1 2018 Shareholder letterpage 9Financial objectives*Investor contactWe have set the following financial objectives, which remain unchangedfrom our IPO Prospectus. et revenue growth: We aim to continue to grow net revenue andNachieve a CAGR between the mid-twenties and low thirties in themedium term by executing our sales strategy. For 2018, we expect netrevenue to grow at least 40%. BITDA margin: We aim to improve EBITDA margin, and expect thisEmargin to benefit from our operational leverage going forward andincrease to levels above 55% in the long-term.Capital expenditure: We aim to maintain a sustainable capitalexpenditure level of up to 5% of our net revenue.Earnings call and webcastWe will host an earnings call at 15.00 CEST (09.00 ET) today to discussthese results. To listen to a live audio webcast, please visit our InvestorRelations page at adyen.com/ir. A recording will be available on thewebsite following the call.As an addendum to this letter, please find attached our H1 2018 financialresults and three one-page updates on the growth pillars we defined inour IPO Prospectus: Enterprise, unified commerce and mid-market.Sincerely,Pieter van der DoesCEOIngo UytdehaageCFO* Adyen has not defined, and does not intend to define, “medium-term” or “long-term”.Adyen’s medium-term and long-term financial objectives should not be read as forecasts,projections or expected results and should not be read as indicating that Adyen is targetingsuch metrics for any particular year, but are merely objectives that result from Adyen’spursuit of its strategy. Adyen’s ability to meet its 2018, medium-term and long-termobjectives is based upon the assumption that Adyen will be successful in executing itsstrategy and, furthermore, depends on the accuracy of a number of assumptions involvingfactors that are significantly or entirely beyond Adyen ‘s control and are subject to knownand unknown risks, uncertainties and other factors that may result in Adyen being unableto achieve these objectives.Eva Weberir@adyen.comMedia contactHemmo Bosscherpress@adyen.com
H1 2018 Shareholder letterpage 10
H1 2018 Shareholder letterpage 11EnterpriseTotal processed volume 70.0 Bn43.1% growth year-on-yearSelect merchant winsVolume increase driven by organicgrowth of merchants and increasedshare of wallet across portfolioContinued addition of new merchantsand successful pipeline conversionAccelerating platform improvements,providing merchants with amembership to ongoing innovation
H1 2018 Shareholder letterpage 12Unified commerce70.059.5POS volume48.9 6.6 Bn3.0H1 20175.46.6H2 2017H1 2018120.0% growth year-on-yearSelect merchant winswwI n the first half of 2018, we launched ourPOS offering in Singapore ur full unified commerce offering isOnow available in 37 countries e launched Terminal API – the futureWof our in-store solution
H1 2018 Shareholder letterpage 13Mid-marketContinued investment in marketingto build pipelineProduct improvements tailored to themid-market segmentRecruited for mid-market-specific roles,both in tech and commercial teamsSimplified and improved userexperience of our Customer AreaIncreased focus on partnerships, buildingout committed development groupsSelect merchant winsSelect partnerships
Interim Condensed ConsolidatedFinancial StatementsH1 2018 Adyen N.V.
H1 2018 Shareholder letterpage 15Condensed Consolidated Statement of Comprehensive IncomeFor the periods ending June 30, 2018 and June 30, 2017(all amounts in EUR thousands unless other stated)NoteH1 2018H1 2017Revenue1697,081442,368Costs incurred from financial institutions1(536,771)(346,492)Cost of inventory1(3,879)(2,366)156,43193,510Net revenueWages and salaries4(37,089)(25,390)Social securities and pension costs4(6,507)(4,521)Amortization and depreciation of tangible and intangible fixed assets12(4,048)(2,726)Other operating dendsIncome before interest income, interest expense and income taxesFinance incomeFinance expense(955)(100)(4,868)(35)Net finance income(5,610)(50)Income before income taxes60,59235,577(12,430)(7,969)Net income for the period48,16227,608Net income attributable to Owners of Adyen N.V.48,16227,608-2,153Other financial resultsIncome taxes67Other comprehensive incomeItems that may be reclassified to profit or loss:Gains on re-measuring of fair value through other comprehensive incomefinancial assetsDeferred income tax relating to this itemOther currency translation adjustmentsCurrency translation adjustments subsidiariesOther comprehensive income for the yearTotal Comprehensive income for the year (attributable to owners of ,99926,193Earnings per share (in EUR)- Net Profit per share - basic121.64- Net profit per share - diluted121.58The accompanying notes are an integral part of these interim condensed consolidated financial statements.
H1 2018 Shareholder letterpage 16Condensed Consolidated Balance SheetFor the periods ending June 30, 2018 and December 31, 2017(all amounts in EUR thousands unless other stated)NoteIntangible 9,95625,0761139,885-Receivables11-4,248Deferred tax ,71942,27325,567Plant and equipment12Other financial assetsContract assetsTotal Non-current assetsInventories3Receivables from financial institutionsTrade and other receivables11Receivable114,331-Current income tax receivables7-2,061Other financial assets.117,8376,989Cash and cash equivalents9943,127862,930Total Current assets1,193,4581,082,283Total assets1,399,0191,137,202Share capitalShare premiumTreasury shares2952958153,345149,3142(9,853)-8Other reserves61,43327,933Retained earnings277,841212,236Total Equity attributable to owners of Adyen N.V.483,061389,777Derivative financial instrumentsDeferred tax liabilities8, 117Total Non-current liabilitiesPayable to merchants and financial institutionsTrade and other payablesCurrent income tax payablesDeferred revenuesTotal Current liabilitiesTotal liabilities and 37,202The accompanying notes are an integral part of these interim condensed consolidated financial statements.
page 17H1 2018 Shareholder sed Consolidated Statement of Changes in Equity2118NoteFor the periods ending June 30, 2018 and June 30, 2017(all amounts in EUR thousands unless other stated)Balance - December 31, 2016Net income for the yearOther adjustmentsIntangible assetsOther comprehensive income/(expense)Re-measurement available-for-salefinancial assetOther currency translation adjustmentsCurrency translation adjustmentssubsidiariesTotal comprehensive income for theperiodTransactions with owners in theircapacity as owners:Proceeds on issuing sharesShare-based paymentsBalance – June 30, 2017
page 18H1 2018 Shareholder letterBalance - December 31, 2017Change in accounting policyRestated total equity at the beginning ofthe financial yearNet income for the yearReclassification of warrantOther adjustmentsIntangible assetsOther comprehensiveincome/(expense)Currency translation adjustmentsTotal comprehensive income for theperiodTransactions with owners in theircapacity as owners:Repurchase of Depositary ReceiptsOptions exercisedProceeds on issuing sharesShare-based paymentsBalance – June 30, 1,150(663)-1,6652,064554(163)2,4554,119The accompanying notes are an integral part of these interim condensed consolidated financial statements.
H1 2018 Shareholder letterpage 19Condensed Consolidated Statement of Cash FlowsFor the periods ending June 30, 2018 and June 30, 2017(all amounts in EUR thousands unless other stated)NoteH1 201860,592H1 )4,031(9,853)(9,200)1938-(5,822)939Net increase in cash, cash equivalents and bank overdraftsCash, cash equivalents and bank overdrafts at beginning of the yearExchange gains/(losses) on cash, cash equivalents and bank Cash, cash equivalents and bank overdrafts at end of the period943,127729,819Income before income taxesAdjustments for:- Finance income- Finance expenses- Other financial results- Depreciation of plant and equipment- Amortization of intangible fixed assets- Share-based paymentsChanges in Working capital:- Inventories- Trade and other receivables- Receivables from financial institutions- Payables to merchants and financial institutions- Trade and other payables- Deferred revenues- Purchase of contract assetsCash generated from operationsInterest receivedInterest paidIncome taxes paidNet cash flows from operating activitiesPurchases of financial assets at amortized costPurchases of plant and equipmentCapitalization of intangible assetsRedemption of investments at amortized costDividends receivedNet cash used in investing activitiesProceeds from issuance of ordinary sharesShare premium paid by the shareholdersRepurchase of depositary receipts (treasury shares)Net cash flows from financing activities621111211222The accompanying notes are an integral part of these interim condensed consolidated financial statements.
H1 2018 Shareholder letterpage 20Notes to the Condensed Interim Consolidated FinancialStatementsGeneral InformationAdyen N.V. (hereinafter ‘Adyen’) is a licensed Credit Institution by De Nederlandsche Bank (the Dutch Central Bank)and registered in the Netherlands under the company number 34259528. The Credit Institution license includes theability to provide cross-border services in the EEA. Adyen N.V. directly or indirectly owns 100% of the shares of itssubsidiaries, and therefore controls all entities included in these interim condensed consolidated financial statements.During the period Adyen has offered and was admitted to trading and listing of existing ordinary shares in the capital ofAdyen on Euronext Amsterdam. To facilitate this listing on Euronext Amsterdam, Adyen changed its legal structure inthe Netherlands from a B.V. (Besloten Vennootschap – private company with limited liability) to an N.V. (NaamlozeVennootschap – public limited company).All amounts in the notes to the interim condensed consolidated financial statements are stated in thousands of EUR,unless otherwise stated.Basis of preparationAdyen applies the option of publishing condensed group financial statements under IAS 34 – Interim FinancialReporting. The interim condensed consolidated financial statements for the six months ended June 30, 2018 havebeen prepared in accordance with IAS 34 for the purpose of being included in the half yearly financial publication ofAdyen. The interim condensed consolidated financial statements do not include all the information and disclosuresrequired in the annual financial statements, and should be read in conjunction with the Adyen annual consolidatedfinancial statements as at December 31, 2017.Significant accounting policiesSignificant and other accounting policies that summarize the measurement basis used and are relevant tounderstanding the financial statements are provided throughout the notes to the interim financial statements.Critical judgements and estimatesSignificant estimates involve a higher degree of judgment or complexity, and regard items that are more likely to bematerially adjusted due to inaccurate estimates and/or assumptions turning out to be wrong. Detailed informationabout these estimates and judgments are included in the notes along with information about the basis of calculation foreach affected line item in the financial statements. The areas involving significant estimates or judgments are: Revenue from contracts with customers – refer to note 1 Revenue and segment reporting; Principal versus agent for revenue out of settlement fees– refer to note 1 Revenue and segment reporting Fair valuation of financial liabilities at fair value – refer to note 11 Financial instruments;New Standards Adopted by the GroupThe accounting policies and methods of computation adopted in the preparation of the interim condensedconsolidated financial statements are consistent with those followed in the preparation of the Adyen annualconsolidated financial statements for the year ended December 31, 2017.Adyen has not early adopted any other standard, interpretation or amendment that has been issued but is not yeteffective. As required by IAS 34, the nature and effect of these changes are disclosed in the referenced notes. Adyenapplied the following standards for the first time: IFRS 15 Revenue from Contracts with Customers (refer to note 1 Revenue and segment reporting); and IFRS 9 Financial Instruments that require restatement of previous financial statements (refer to note 11Financial instruments).The qualitative impact assessment of the first time application on January 1, 2018 of these standards is disclosed innote 14 New standards adopted by Adyen.
H1 2018 Shareholder letterpage 21Key Disclosures1. Revenue and segment reportingAccounting policy – Contract with customers IFRS 15Adyen has the following sources of revenue:(i) Processing fees: fixed fee per transaction paid by merchants for the use of Adyen’s platform andrecognized as revenue when transaction is initiated via the Adyen payment platform.(ii) Settlement fees: fees paid by merchants, usually as percentage of the transaction value, whereAdyen offers acquiring services. These fees are recognized as revenue when a payment transaction hasbeen completed by means of settlement with a merchant. Settlement fees include interchange andpayment network fees and other costs incurred from financial institutions passed on to merchants aswell as a mark-up charged by Adyen for its acquiring services, as contractually agreed between eachmerchant and Adyen(iii) Sales of goods: As Adyen satisfies the performance obligations to deliver the POS terminal andrelated accessories upon transfer of control of the terminal to the merchant the revenues arerecognized at that point in time(iv) Other services: (such as foreign exchange service fees, third party commission and terminal servicefees) recognized at point in time or point over time depending on the service rendered.Contract assetsImpairments on contracts assets are recognized if the carrying amount is higher than the recoverableamount. The contract assets, which are partly monetary items, are amortized and booked to revenue ona pro rata basis in line with the fulfilment of the expected payments services performance obligation.The breakdown of revenue from contracts with customers per type of goods or service is as follows:Types of goods or serviceSettlement feesProcessing feesSales of goodsOther servicesTotal revenue from contracts with customersCosts incurred from financial institutionsCosts of inventoryNet revenueH1 2018602,04861,0706,20127,762H1 )156,431442,368(346,492)(2,366)93,510The breakdown of revenue from contracts with customers based on timing is as follows:Timing of revenue recognitionGoods and services transferred at point in timeServices transferred over timeTotal revenue from contracts with customersH1 2018694,6492,432697,081H1 2017442,368442,368The services transferred over time are related to the amortization of deferred revenue for services provided andterminal service fees.The interim operations of Adyen reported in these condensed consolidated financial statements are not consideredseasonal nor cyclical at this moment in time.
The following tables summarizes Adyen’s geographical breakdown of its revenue based on the billing location asThefollowingtablessummarizesrequestedby themerchantfor theAdyen’speriodsgeographicalindicated. breakdown of its revenue based on the billing location lof its revenue based on the billing location asrequestedbythemerchantfortheperiodsindicated. breakdownH12018ShareholderletterThe following tables summarizes Adyen’s geographicalbreakdown of its revenue based on the billing location as page 22requestedthemerchantfor theAdyen’speriodsgeographicalindicated. breakdown of its revenue basedH1Revenue-byGeographicalbreakdownH1 2017Thefollowingtablessummarizeson 2018the billing locationasrequestedthe merchantbreakdownfor the periods indicated.Revenue phicalthemerchantfor theAdyen’speriodsgeographicalindicated. breakdown of its revenue ationasRevenue- Geographical ed.Europe399,070264,673Revenue- Geographical 5Latin Pacific57,24228,483Europe399,070264,673Rest ofthe c57,24228,483LatinAmerica49,96533,693Restofthe fic57,24228,483Revenue697,081442,368Restofthe a49,96533,693Revenue697,081442,368Rest of the World2,1672,514Revenue697,081442,368Restof the 081442,368Duringthe provision ofpaymentRevenue697,081442,368Rest ofthetheperiod,WorldAdyen has signed a contract with a customer (as defined in IFRS 15) for2,1672,514Duringtheperiod,Adyenhassigneda contracta customerdefinedIFRS 15)for the provisionofEURpaymentservicesthatresultedin theinitialrecognitionofwithcontractassets (asof EUR136inmillion,a derivativeliability ssignedcontracta customerdefinedinIFRS15)forthe provisionofEURpaymentservicesthatresultedin t.EUR136Themillion,a derivativeliabilityof75.5willmillion anddeferredrevenueofEUR4auponsigningof the(ascontractassetsofEUR 136millionDuringtheperiod,Adyenhassigneda millioncontractwitha customer(asdefinedinIFRS15)forthe provisionof paymentservicesthatresultedin R136Themillion,a esservices that resulted in the initial recognition of contract assets of EUR 136 million, a derivative liability of EUR ionbeamortizedand bookedtoinitialrevenuea proratabasisinassetslinewiththefulfilmentof theexpectedpaymentsservicesservicesthatresultedin therecognitionofcontractofdetailsEUR136million,a derivativeliabilityofEUR75.5willperformanceobl
marketing efforts in the first half of this year. Net income for the period was 48.2 million, up 74.6% from 27.6 million for the first half of 2017. As we continue to pursue sustainable profitable growth at scale, our free cash flow (EBITDA - CapEx) during the first half of this year was 62.7 million, up 71.2% year-on-year.