Transcription
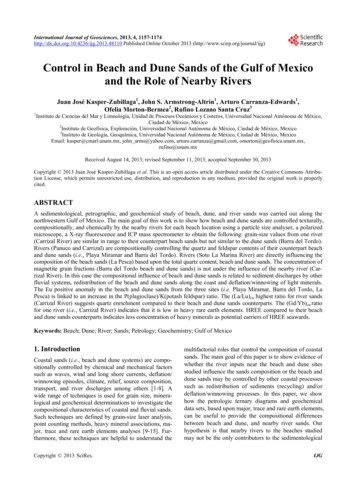
International Journal of Geosciences, 2013, 4, 1157-1174http://dx.doi.org/10.4236/ijg.2013.48110 Published Online October 2013 (http://www.scirp.org/journal/ijg)Control in Beach and Dune Sands of the Gulf of Mexicoand the Role of Nearby Rivers1Juan José Kasper-Zubillaga1, John S. Armstrong-Altrin1, Arturo Carranza-Edwards1,Ofelia Morton-Bermea2, Rufino Lozano Santa Cruz3Instituto de Ciencias del Mar y Limnología, Unidad de Procesos Oceánicos y Costeros, Universidad Nacional Autónoma de México,Ciudad de México, Mexico2Instituto de Geofísica, Exploración, Universidad Nacional Autónoma de México, Ciudad de México, Mexico3Instituto de Geología, Geoquímica, Universidad Nacional Autónoma de México, Ciudad de México, MexicoEmail: kasper@cmarl.unam.mx, john arms@yahoo.com, arturo.carranza@gmail.com, omorton@geofisica.unam.mx,rufino@unam.mxReceived August 14, 2013; revised September 11, 2013; accepted September 30, 2013Copyright 2013 Juan José Kasper-Zubillaga et al. This is an open access article distributed under the Creative Commons Attribution License, which permits unrestricted use, distribution, and reproduction in any medium, provided the original work is properlycited.ABSTRACTA sedimentological, petrographic, and geochemical study of beach, dune, and river sands was carried out along thenorthwestern Gulf of Mexico. The main goal of this work is to show how beach and dune sands are controlled texturally,compositionally, and chemically by the nearby rivers for each beach location using a particle size analyser, a polarizedmicroscope, a X-ray fluorescence and ICP mass spectrometer to obtain the following: grain-size values from one river(Carrizal River) are similar in range to their counterpart beach sands but not similar to the dune sands (Barra del Tordo).Rivers (Panuco and Carrizal) are compositionally controlling the quartz and feldspar contents of their counterpart beachand dune sands (i.e., Playa Miramar and Barra del Tordo). Rivers (Soto La Marina River) are directly influencing thecomposition of the beach sands (La Pesca) based upon the total quartz content, beach and dune sands. The concentration ofmagnetite grain fractions (Barra del Tordo beach and dune sands) is not under the influence of the nearby river (Carrizal River). In this case the compositional influence of beach and dune sands is related to sediment discharges by otherfluvial systems, redistribution of the beach and dune sands along the coast and deflation/winnowing of light minerals.The Eu positive anomaly in the beach and dune sands from the three sites (i.e. Playa Miramar, Barra del Tordo, LaPesca) is linked to an increase in the P(plagioclase)/K(potash feldspar) ratio. The (La/Lu)cn highest ratio for river sands(Carrizal River) suggests quartz enrichment compared to their beach and dune sands counterparts. The (Gd/Yb)cn ratiofor one river (i.e., Carrizal River) indicates that it is low in heavy rare earth elements. HREE compared to their beachand dune sands counterparts indicates less concentration of heavy minerals as potential carriers of HREE seawards.Keywords: Beach; Dune; River; Sands; Petrology; Geochemistry; Gulf of Mexico1. IntroductionCoastal sands (i.e., beach and dune systems) are compositionally controlled by chemical and mechanical factorssuch as waves, wind and long shore currents, deflation/winnowing episodes, climate, relief, source composition,transport, and river discharges among others [1-8]. Awide range of techniques is used for grain size, mineralogical and geochemical determinations to investigate thecompositional characteristics of coastal and fluvial sands.Such techniques are defined by grain-size laser analysis,point counting methods, heavy mineral associations, major, trace and rare earth elements analyses [9-15]. Furthermore, these techniques are helpful to understand theCopyright 2013 SciRes.multifactorial roles that control the composition of coastalsands. The main goal of this paper is to show evidence ofwhether the river inputs near the beach and dune sitesstudied influence the sands composition or the beach anddune sands may be controlled by other coastal processessuch as redistribution of sediments (recycling) and/ordeflation/winnowing processes. In this paper, we showhow the petrologic ternary diagrams and geochemicaldata sets, based upon major, trace and rare earth elements,can be useful to provide the compositional differencesbetween beach and dune, and nearby river sands. Ourhypothesis is that nearby rivers to the beaches studiedmay not be the only contributors to the sedimentologicalIJG
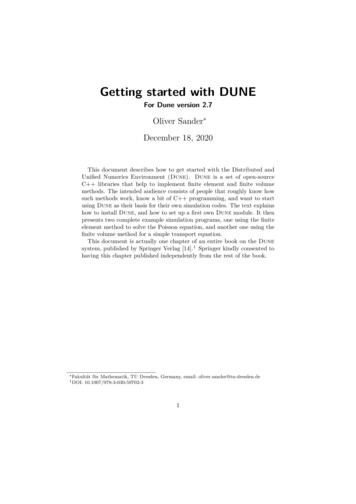
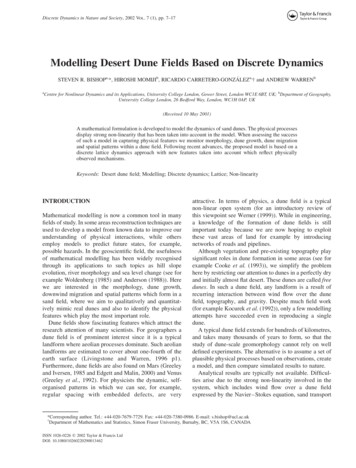
1158J. J. KASPER-ZUBILLAGAcharacteristics (i.e., grain-size, mineralogical and geochemical signatures) but some of the beach and dunesystems may be influenced rather by redistribution ofsediments along the coast and other mechanisms. Ourmajor reliable control in obtaining the data was to samplein two different seasons of the year (i.e., dry and wetseason).2. Study AreaThe study area is located in the coastal zone of the Tamaulipas State, Mexico (from 22 10'N - 97 47'W to24 07'N - 97 43'W). Sampling was carried out in threemain coastal sites: Playa Miramar, Boca del Tordo, andLa Pesca (Figure 1). Average beach width is 160 m, 42m, and 89 m for each locality, respectively. Main riversdischarging in each site are Pánuco, Carrizal, and SotoLa Marina, respectively.2.1. GeologyThe geology of the study area comprises Cretaceouslimestones and shales in the Soto La Marina river basin,Cenozoic basic volcanic rocks and acid intrusive rocks inthe Carrizal and Tigre river basins, Cenozoic shale, sandstone, conglomerate, and soils in Soto La Marina, Tamesis, and Panuco river basins (Figure 1). This area is considered a passive margin despite the fact that some volcanic outcrops are located in the central and northernportions of the Carrizal, Tigre, and Soto La Marina riverbasins although sands from modern environments willnot always be placed in a passive margin classification whenthey are influenced by volcanic outcrops in the area [16].According to Lugo-Hubp [17] the coastal area ofTamaulipas is part of the Coastal Plain of the Gulf ofMexico where fluvial erosion and deposition controls thecomposition and terranes of the southern coast. Additionally, some low altitude hills (400 m) can be observednear the coasts of southern Tamaulipas.2.2. Physical OceanographyIn the southern coast of Tamaulipas, semidiurnal tidesbetween 50 and 30 cm of amplitude occur [18]. Longshore currents are between 13 cm/s to 18 cm/s during thesummer or dry season and 7.5 to 9 cm/s during the winteror wet season [19]. Long shore currents have a northwesterly direction for both seasons, which is also evidenced by the presence of sand barrier spits attached tothe coast with a northwesterly orientation. Waves are of0.6 to 1.2 m in height with periods of 6 to 8 s with anorthern direction.2.3. Climate, Precipitation, and Wind RegimeThe study area is located in the warm-temperate regionof the Gulf of Mexico with temperatures from 28 C toCopyright 2013 SciRes.ET AL.30 C in summer and 14 C to 20 C in winter [18]. Precipitation during the dry season is 160 mm and duringthe wet season it is 5.6 cm, taking into account twomonth average precipitation rates belonging to both seasons. During the dry season, winds are from the north,east, northeast, and southeast with average velocities of 4m/s, 3 m/s, 4 m/s, 1.5 m/s, respectively. During the wetseason winds average velocities are of 3 m/s, 5 m/s, 4m/s, and 3 m/s with a northern, northeastern, eastern, andsoutheastern direction, respectively [20].3. Materials and MethodsApproximately 200 g of sand samples were collectedfrom the beach, dune and the three river systems close tothe studied sites. The uppermost centimeter was sampledin order to ensure the homogeneity of the sand laminae[21]. Samples were taken at Playa Miramar, Barra delTordo and La Pesca beaches, and the rivers Panuco, Carrizal, Soto La Marina during the dry (April) and wet(November) seasons (Table 1). A Global Positional System (GPS) was used to get the coordinates during thesampling procedure. Samples were located approximately 20 m from each other at each coastal site and takenfrom the inshore, foreshore, backshore at the beach andthe stoss side of the dune. River sand samples were collected very close to the river mouth from south to north(Figure 1). Samples were dried and 1 to 2 g of sands wasused for grain size analysis after storing 10 g of sampleto ensure repeatability in the grain size analysis. Thegrain size analysis was carried out by means of a LaserParticle Size Analyzer (Model Coulter LS230) that determines the particle sizes between –1.0 and 14.6 . Particle size distributions were given in m and convertedinto units to calculate the grain size distribution parameters following Folk (5). Graphic mean was calculated using Mz 16 50 84 3; sorting σ computed as 84 16 4 95 5 6.6 and skewness is a measure of symmetry in a grain size distribution.Its value can be obtained with 16 84 2 50 2 84 16 95 5 2 50 2 95 5 (Table 1). Point counting was carried out using the Indiana method [22] (200 to300 grains) for the major compositional framework oftotal quartz (Q), total feldspar (F) K-feldspar (K) plagioclase (P) and total lithics (R) volcanic sedimentary metamorphic plutonic lithics (Rv Rs Rm p), heavy minerals (HM) and biogenic (B) components (shells, algae, and corals) [23] (Table 2). Pointcounts were normalized to 100% and ternary diagramsfor mineralogic data were plotted using confidence limitsof the mean (CLM) at 99% of confidence level aroundthe mean population of samples. These regions wereconstructed using the algorithm developed [24] and converted into ellipses using the Sigma Plot Software VerIJG
J. J. KASPER-ZUBILLAGAET AL.1159Figure 1. Geological map showing the study areas and sample locations.Copyright 2013 SciRes.IJG
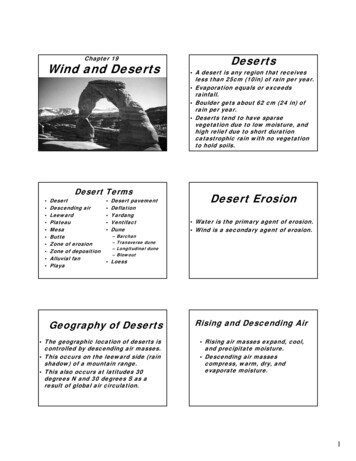
J. J. KASPER-ZUBILLAGA1160ET AL.Table 1. Average textural parameters for the beach, dune, and river sands of the northwestern Gulf of Mexico.Playa MiramarBarra del TordoLa PescaBeach(n 31)Dune(n 26)River1(n 5)Beach(n 26)Dune(n 14)River2(n 5)Beach(n 33)River3(n 5)Mz ( )1.93 0.642.27 0.502.36 0.092.14 0.192.22 0.321.93 0.501.55 0.651.80 0.76 ( )0.62 0.280.43 0.080.42 0.030.48 0.160.47 0.250.82 0.440.74 0.330.81 0.59Ski 0.03 0.17 0.01 0.080.11 0.19 0.05 0.12 0.02 0.11 0.21 0.21 0.03 0.23 0.24 0.40KG0.96 0.150.99 0.091.00 0.021.05 0.310.95 0.061.04 0.200.89 0.161.02 0.32Mz mean grain size; sorting; Ski skewness; KG kurtosis; phi units. 1Panuco River; 2Carrizal River; 3Soto La Marina River.Table 2. Average compositional data for the beach, dune, and river sands of the northwestern Gulf of Mexico.Playa MiramarBarra del TordoLa PescaRiver1(n 10)Beach(n 21)Dune(n 20)River2(n 10)246 14261 13222 35232 452.1 1.92.8 1.932.7 3.02 2.64Beach(n 25)Dune(n 21)Q198 55K1.6 1.5Beach(n 27)River3(n 10)248 23212 44249 281.0 1.10.78 0.852.0 1.5P3.3 3.34.1 2.51.5 1.723.9 5.43.75 7.481.8 2.41.59 1.500.7 1.1Rv6.6 4.25.6 3.93.2 3.825.2 5.43.55 3.593.3 3.35.85 3.242.0 2.1Rs10.2 5.211.2 5.36.6 2.416.9 3.15.65 3.503.3 2.45.81 3.394.4 3.0Rm0.3 0.70.4 0.60.1 0.320.2 0.50.3 0.80.1 0.30.19 0.62-Rp2.2 2.13.0 2.62.4 1.901.8 2.71.0 1.20.2 0.41.63 1.961.0 1.2HM-0.6 1.6-4.2 7.412.7 15.1--0.5 0.7B78 5827.2 9.922.5 8.4239 1239 2942.6 20.572.0 46.640.8 25.6Total4300300300300300300300300Q total quartz, K potash feldspar, P plagioclase, Rv volcanic lithics (basalts, andesites), Rs sedimentary lithics (limestones, chert, sandstones, shales),Rm metamorphic (schist), Rp plutonic lithics (granite), F K P; R Rv Rs Rm p; HM heavy minerals (magnetite, hematite, zircon), B biogenicfraction (shell fragments, algae). 1Panuco River; 2Carrizal River; 3Soto La Marina River; 4Total number of grains counted.sion 2001. The ellipses represent the area in which samples might have variations in relation to the mean. Thisimplies that the CLM define rigorously if two meanpopulations are significantly different.Tables presented in the manuscript are the average results of extensive data that are included as repository dataand table for the readers.Sand samples were dried at 110 C and treated withlithium meta and tetraborate to make pressed powderpellets. They were analyzed using an X-ray fluorescenceSiemens SRS 3000 equipment for major and trace elements (n 60). For major and trace elements precision isvaluated in terms of relative standard deviation being 1%. Trace elements were normalized using the uppercontinental crust values [25].The Rare Earth Elements (REE) analysis was carriedout for thirty eight sand samples by using 0.1 g of driedsample (mesh 200) and digested with strong acid. Digestion was performed in teflon vessels using 4 ml of HClO4and 10 ml HF. This mixture was heated and residue wasdissolved in distilled water and incorporated to a volumetric flask. Determination of REE was carried out withan ICP mass spectrometer VG Elemental model PQ3. Detection limits were calculated as the concentration equivalent to three times the standard deviation of five repliCopyright 2013 SciRes.cates of the blank solution. It was better than 200 ppt forall elements determined. Calibration of the apparatus wasdone with a 0.1, 1, 10 and 100 ppb multi-elemental standard solution (SPEX-High Purity) and a blank solution ofde-ionized water all containing HNO3 at 2%. Resultswere observed for international standards (JG-2). Thevalidity of the analytical procedure was assessed bymeans of accuracy and precision tests. They were calculated by comparing measured and reference values (JA2). All elements determined had a better than 10% relative standard deviation (RSD) precision. Data resultedfor BCU-3 or in “house standard” indicated good agreement with the certified values. The rare earth elementswere normalized using the chondrite values [25].4. Results4.1. Grain Size ParametersPlaya Miramar beach, dune and river sands are coarse tofine-grained, poorly to moderately well sorted sands (Table 1). They are symmetrical with some beach samplesshowing fine to coarse-skewed trends platykurtic tomesokurtic (i.e. beach sands) and mesokurtic curves (i.e.dune and river sands).Barra del Tordo beach, dune and river sands are meIJG
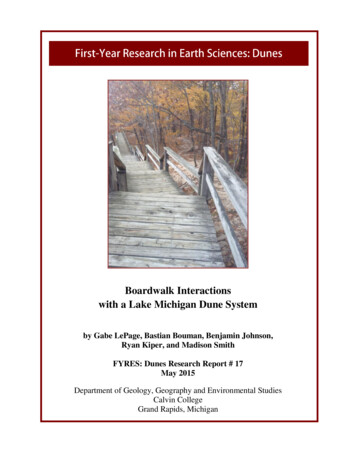
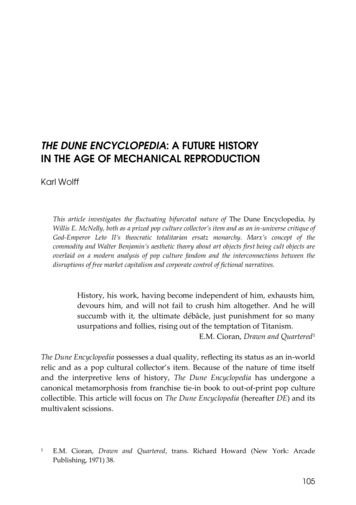
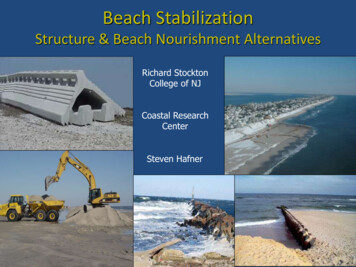
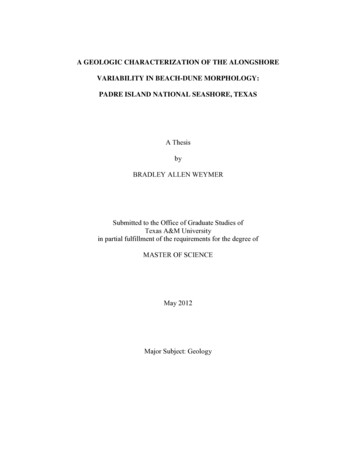
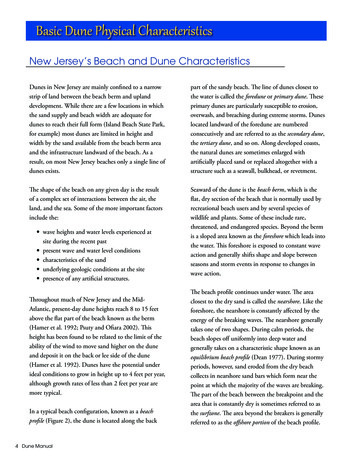
J. J. KASPER-ZUBILLAGAET AL.1161dium to fine-grained, poorly to well sorted sands (i.e.some beach and river sands) with symmetrical (i.e. somebeach, river and all dune sands) and coarse-skewed distributions and mostly mesokurtic curves.La Pesca beach and river sands are coarse (i.e. somebeach sands) to fine-grained (i.e. all river sands) poorlyto moderately sorted sands and fine to coarse-skewedtrends. They show platykurtic to leptokurtic curves. Thebest correlations of the three sand samples are betweenMz (φ) and σ (φ) at Playa Miramar, Barra del Tordo andLa Pesca for the beach sands at Playa Miramar (r 0.92)and beach and river sands at La Pesca (r 0.95; r 0.85, respectively) and the beach (r 0.74) and dunesands (r 0.95) at Barra del Tordo (Figures 2-4). Correlations between Mz (φ) and Ski were significant atBarra del Tordo beach, dune and river sands (Figure 3(b))showing symmetrical curves in the dune sand samples, inexception some river and beach sands are coarse skewed.The only significant correlation between Mz and KG wasat Barra del Tordo dune sands and La Pesca beach sands(Figures 3(c) and 4(c)).4.2. Modal AnalysisUsing the Q-F-R ternary diagrams (Figure 5 and Table 3)it is observed that the beach, dune and river sands of Playa Miramar (beach Q88:F3:R9; dune Q90:F2:R7; river Q94:F2:R4), Barra del Tordo (beach Q91:F3:R6; dune Q93:F3:R4; river Q96:F1:R3) and La Pesca (beach Q93:F1:R6; dune Q96:F1:R3) are quartzitic. However, itseems that there are significant differences in the composition of beach, dune and river sands between PlayaMiramar and Barra del Tordo, supported by the positionand size of the CLM in the Q-F-R diagram [8,24] (Figure 5).Quartz grains are mostly subangular to rounded (Figures 6(a) and (c)) in all the sand samples (beach, duneand river) and the volcanic rock fragments observed werebasalts and probably andesites. Sedimentary rocks weremainly limestones, chert, sandstones and shales. Metamorphic fragments observed were probably schists. Also,plutonic lithics (i.e. granites and granodiorites) (Figure 6(a)) were observed. Magnetite was the most abundantheavy mineral (Figure 6(b)) in the sands and the biogenic fraction was composed of shell fragments andprobably algae.When plotting the sand samples in the Rv Rs Rm pternary diagram it is observed that La Pesca beach sandsare enriched with Rv compared to the rest of the sites butthe Soto La Marina River shows depletion in Rv. Beachand dune sands are enriched in Rs in Miramar and Barradel Tordo beaches. The Panuco and Carrizal River sandshave a mix of Rv, Rs and Rm p fractions (Figure 7).Higher dispersal of the CLM area of the river sands inthe ternary diagrams compared to the beach and duneCopyright 2013 SciRes.Figure 2. Bivariate plots for the beach, dune and river sandsof Playa Miramar. (a) Mz – σ Mz grain size expressed inФ units; σ sorting expressed in Ф units ; (b) Mz – Ski Ski skewness ; (c) Mz – KG KG kurtosis .sands is due to small number of river sands and the heterogeneous supply of lithic fractions, which increases theCLM size. Heavy minerals mainly composed of magnetite grains are higher in the Barra del Tordo dune sandscompared to the rest of the locations (Table 2). The biogenic fraction (B) is composed mainly of shell fragmentsand some algae and it is high for the three sedimentaryenvironments (Table 2).4.3. Major Provinces Based Upon GeochemicalDataThe provenance discriminant function diagrams [26](Figure 8) shows that there are three major provinces,which influence the composition of the beach, dune andriver sands: the quartzose, intermediate and felsic provinces being the Carrizal River sands placed in theintermediate igneous province, whereas the beach anddune sands from Barra del Tordo are located in thequartzose sedimentary and felsic igneous provinces.IJG
1162J. J. KASPER-ZUBILLAGAET AL.sand samples.4.5. Rare Earth ElementsThe results of REE analysis for the three sites are givenin Table 5 and are shown as the average chondrite normalized patterns in Figures 10(a)-(c). There is a depletion of REE concentration especially for the Panuco andCarrizal River sands compared to the beach and dunesands from the Playa Miramar and Barra del Tordo sites.A Eu positive anomaly is observed for the beach, duneand river sands at Playa Miramar and La Pesca and riversands at Barra del Tordo.4.6. SiO2/Al2O3 versus K2O/Na2O BinaryDiagramOn a SiO2/Al2O3 versus K2O/Na2O diagram (Figures 11(a)-(c))most of the data of this work plot close to the data coming fromFigure 3. Bivariate plots for the beach, dune and river sandsof Barra del Tordo. (a) Mz – σ Mz grain size expressed inФ units; σ sorting expressed in Ф units ; (b) Mz – Ski Ski skewness ; (c) Mz – KG KG kurtosis .4.4. Trace Element GeochemistryAverage upper continental crust normalized data [25] oftrace elements shows a more conspicuous concentrationof Sr, Zr, Nb, Co and Cu and depletion of Th, Ba, Ni andV for the beach, dune and river sands at the three beachsites (Figures 9(a)-(c) and Table 4). The higher concentration of Co, Sr, Y and Nb is observed for the riversPanuco, Carrizal and Soto La Marina compared to theircounterparts Playa Miramar, Barra del Tordo and LaPesca, respectively. Depletion of Cr is observed for theCarrizal and Soto La Marina River sands compared toBarra del Tordo and La Pesca beach and dune sands.Also the Soto La Marina river sands show the highestconcentration of Y, Nb and Co among the whole set ofCopyright 2013 SciRes.Figure 4. Bivariate plots for the beach, dune and river sandsof Soto La Marina. (a) Mz – σ Mz grain size expressed inФ units; σ sorting expressed in Ф units ; (b) Mz – Ski Ski skewness ; (c) Mz – KG KG kurtosis .IJG
J. J. KASPER-ZUBILLAGAET AL.1163Figure 5. Q-F-R ternary diagram for (a) Playa Miramar, (b) Barra del Tordo and (c) La Pesca beach, dune and river sandswith confidence limits of the mean (CLM) at 99% of confidence level (Weltje 2002). Q, total quartz; F, total feldspar K-feldspar (K) plagioclase (P) ; R, total lithics volcanic (Rv) sedimentary (Rs) metamorphic (Rm) plutonic (p) ; n number of samples.Table 3. Average trace elements data (ppm) for the beach, dune, and river sands of the northwestern Gulf of Mexico.BaCoCrCuNbNiPbRbSrThVYZnZr1BeachPlaya MiramarDuneRiver1BeachBarra del TordoDuneRiver2286 7958.2 33.422 2011.3 7.117.3 10.413 66.6 1.544.9 17.7518 3462.5 0.09 421 125.55 3.15419 389254 12865.1 32.331 2112.7 6.716.3 10.714 66.1 1.442.9 22.6541 4262.5 0.010 421 133.72 3.39350 353375 17480 5029 2527.3 28.420.3 15.618 915.7 13.375.7 45.5491 3542.2 0.314 726 177.33 8.5189 14311 8489 4494 4215 633.2 14.619 86.3 1.250.2 20.1291 1183.1 0.814 338 1911.9 6.3751 400259 7865.2 27.254 3912.7 5.320.7 10.914 45.4 0.739 17398 1872.5 0.011 622 116.0 5.8440 326183 8357.7 26.08 923.3 16.211.7 4.912 527.3 19.132 15662 1492.8 0.39 111 760.7 68.198 11La PescaBeachRiver3291 64112 5339 5419 823.6 11.921 94.7 2.454.4 17.8362 2052.5 1.311 628 1113.3 20.9347 356486 254151 12618 2438.0 27.869 3751 275.5 3.188.3 11.8236 2063.8 1.912 7125 1346.17 7.75120 123Panuco River; 2Carrizal River; 3Soto La Marina River.Copyright 2013 SciRes.IJG
1164J. J. KASPER-ZUBILLAGAET AL.5. Discussion5.1. Textural ParametersFigure 6. Photomicrographs of (a) Q subrounded, roundedand angular quartz grains, Rp plutonic rock fragments, B shell fragments (sample 48a, Barra del Tordo beach sand);(b) magnetite grains (Mgn) in beach sands (sample 50,Barra del Tordo); (c) Zircon grain (Zr) in beach sands(sample 50, Barra del Tordo); (d) Q rounded and angularquartz grains P plagioclase, Rs sedimentary rock fragment (sandstone) (sample 11, Playa Miramar dune sands).Scale Bar is 50 microns.the Cazones beach sands (Gulf of Mexico) but slightlyaway from the Northwestern Coast of Mexico beach sandsamples based upon the work [10] that were used as areference for compositional trends of the sands. In thisstudy, most of the data overlaps and the separation between the beach, dune and river sands is not achieved.This is because the average major element values are notshowing significant differences among the sand typesdue to their mobility.Copyright 2013 SciRes.Negative correlations of grain size parameters in PlayaMiramar (Figure 2(a)) and La Pesca (Figure 4(a)) beachsands between Mz (φ) and σ (φ) may be due to a largerange in mean grain size values since both beach siteshave a wide coastal plain allowing a deposition of terrigenous sands but also to shell fragments that disperse thegrain size values. In contrast, dune sands at Barra delTordo are under a more selective process in the grain sizecharacteristics allowing a more limited range in the grainsize values in a narrow coastal plain (Figure 3). Correlations between Mz and σ for the three sites are negativeand highly significant as it has been observed in manybeach and dune sand systems [2,7,27-31]. River sandsshowed significant negative correlations for Mz (φ) vs. σ(φ). However their negative correlations were observedat Carrizal River near Barra del Tordo beach and dune(Figure 3(a)) and Soto La Marina River sands near LaPesca site (Figure 4(a)), which are probably associatedwith the wide range of grain sizes observed in thebeaches but not the dunes in Barra del Tordo associatedwith the presence of coarse shell fragments near the rivermouth. Positive correlations between Mz (φ) vs. Ski (φ)were significant at Barra del Tordo beach, dune and riversands (Figure 3(b)) with symmetrical curves (i.e. mostlydune sands). However, some river and beach sands werecoarse skewed indicating 1) long shore processes in anarrow coastal plain, which do not allow redistribution offine-grained sands and 2) a narrow coastal plains close toriver mouth discharging coarse sediments. The most significant correlation between Mz and KG indicate thatBarra del Tordo dune sands and La Pesca beach sandsare under the effect of winds and longshore currents respectively that are selective for the dune sands (i.e. Barradel Tordo) and redistributes the sediments in a widecoastal plain producing also platykurtic curves due to thepresence of shell detritus (i.e. La Pesca).5.2. Modal AnalysisThe differences in mineralogic components have beenobserved in the Q-F-R ternary diagram (Figure 5). PlayaMiramar, Barra del Tordo and La Pesca beach, dune andriver sands are influenced by quartz-rich sands. Quartzenrichment is controlled by the input of sedimentaryrocks mainly composed of sandstones and shales. Thisobservation is supported by the amount of sedimentarylithics composed mainly by sandstones concentrated inthe sands associated with a passive margin [32,33].The Panuco River concentrates slightly more quartzrich sands (94%) compared to the Playa Miramar beach(88%) and as much as the same percentage as the dunesands (90%) (Figure 5(a)). The Playa Miramar beachIJG
J. J. KASPER-ZUBILLAGAET AL.1165Figure 7. Rv – Rs – Rm p ternary diagrams for (a) Playa Miramar, (b) Barra del Tordo and (c) La Pesca beach, dune andriver sands with confidence limits of the mean (CLM) at 99% of confidence level (Weltje, 2002). Rv, volcanic lithic rock fragments; Rs, sedimentary lithic rock fragments; Rm, metamorphic lithic rock fragments; p, plutonic lithic rock fragments; n number of samples.and dune sands tend towards the R pole, which makesalso a significant difference with the composition of thePanuco River sands. This observation is also supportedby the lack of overlap among the beach, dune and riversands based upon the CLM area and the R percentagesamong the three sand types. This suggests that PlayaMiramar beach and dune sands may be partially influenced by the Panuco River input as it is discussed in theforthcoming section.The Barra del Tordo beach sands may be also not being influenced totally by the Carrizal River dischargessince the CLM does not overlap with the CLM observedfor the beach sands (Figure 5(b)). This suggests that theCarrizal Rivers is not contributing to the whole quartzfractions and probably to the F fraction to the Barra delTordo beach sands and their concentrations may be conCopyright 2013 SciRes.trolled by the influence of other fluvial systems and/orredistributions of relict quartz fractions in the sands alongthe coast. High quartz concentrations in the river mouthmay be also the part of the near shore processes and highenergy that increases the quartz content in the sands.La Pesca beach sands seem to have the similar composition as the Soto La Marina River sands since the CLMis overlapping for the beach and river sands (Figure 5(c)).In contrast to the study [34] in this case it has been observed that not always beach and dune sands tend to beclose to the composition of nearby fluvial systems.The Rv – Rs – Rm p ternary diagram (Figures 7(a)and (b)) shows that the Playa Miramar and Barra delTordo beach and dune sands receive sedimentary andplutonic-metamorphic lithics derived from the Panucoand Carrizal Rivers since the CLM area overlaps on theIJG
1166J. J. KASPER-ZUBILLAGAET AL.Figure 9. Multi-element normalized diagram for the (a)Playa Miramar, (b) Barra del Tordo and (c) La Pesca beach,dune and river sands, normalized against average uppercontinental crust.Figure 8. Provenance discrimination function diagram (Roser and Korsch 1988) for (a) Playa Miramar, (b) Barra delTordo, (c) La Pesca beach, dune and river sands. The discriminant functions are: Discriminant Function 1 ( 1.773TiO2) (0.607Al2O3) (0.760Fe2O3) ( 1.500MgO) (0.616CaO) (0.509Na2O) ( 1.224K2O) ( 9.090); Discriminant Function 2 (0.445TiO2) (0.070Al2O3) ( 0.250Fe2O3) ( 1.142MgO) (0.438CaO) (1.475Na2O) ( 1.426K2O) ( 6.861).Copyright 2013 SciRes.three sand samples CLM region. The CLM of the Panucoand Carrizal River sands covers a larger area comparedto the Miramar and Barra del Tordo sands and overlapswith the beach and dune sands CLM area suggesting thatbeach and dune sands may be under the influence of bothrivers. Furthermore, it seems likely that Carrizal River iseroding volcanic outcrops (i.e. basalts) but the concentrations of these fractions are not reflected in the ternarydiagram for the beach, dune and river sands probably dueto high dispersion in the Rv Rs Rm p composiIJG
J. J. KASPER-ZUBILLAGAET AL.1167Table 4. Average rare earth elements data (ppm) for the beach, dune, and river sands of the northwestern Gulf of Mexico.Playa MiramarLa PescaBeach(n 8)Dune(n 6)River(n 3)Beach(n 12)Dune(n 4)River(n 3)Beach(n 8)River3(n 3)12.5 4.813.6 8.210.3 0.913.0 6.013.8 4.38.3 1.27.74 1.339.00 2.12Ce22.2 9.324.9 15.718.0 1.124.6 13.125.3 7.214.2 1.713.5 2.915.5 3.3Pr2.73 0.953.11 1.842.28 0.233.07 1.573.13 0.811.85 0.251.74 0.322.03 0.43La1Barra del Tordo12Nd10.2 3.311.7 6.88.42 0.8411.5 6.011.6 2.87.01 0.896.39 1.297.53 1.52Sm1.98 0.502.33 1.271.65 0.172.14 1.132.14 0.461.37 0.201.25 0.241.49 0.36Eu0.87 0.190.93 0.150.83 0.290.74 0.160.75 0.090.61 0.220.54 0.080.76 0.31Gd1.77 0.442.11 1.281.49 0.111.88 0.961.96 0.521.23 0.151.09 0.221.35 0
rizal River). In this case the compositional influence of beach and dune sands is related to sediment discharges by other fluvial systems, redistribution of the beach and dune sands along the coast and deflation/winnowing of light minerals. The Eu positive anomaly in the beach and dune sands from the three sites ( Playa Miramar, Barra del Tordo, La